Download as PDF, PPTX


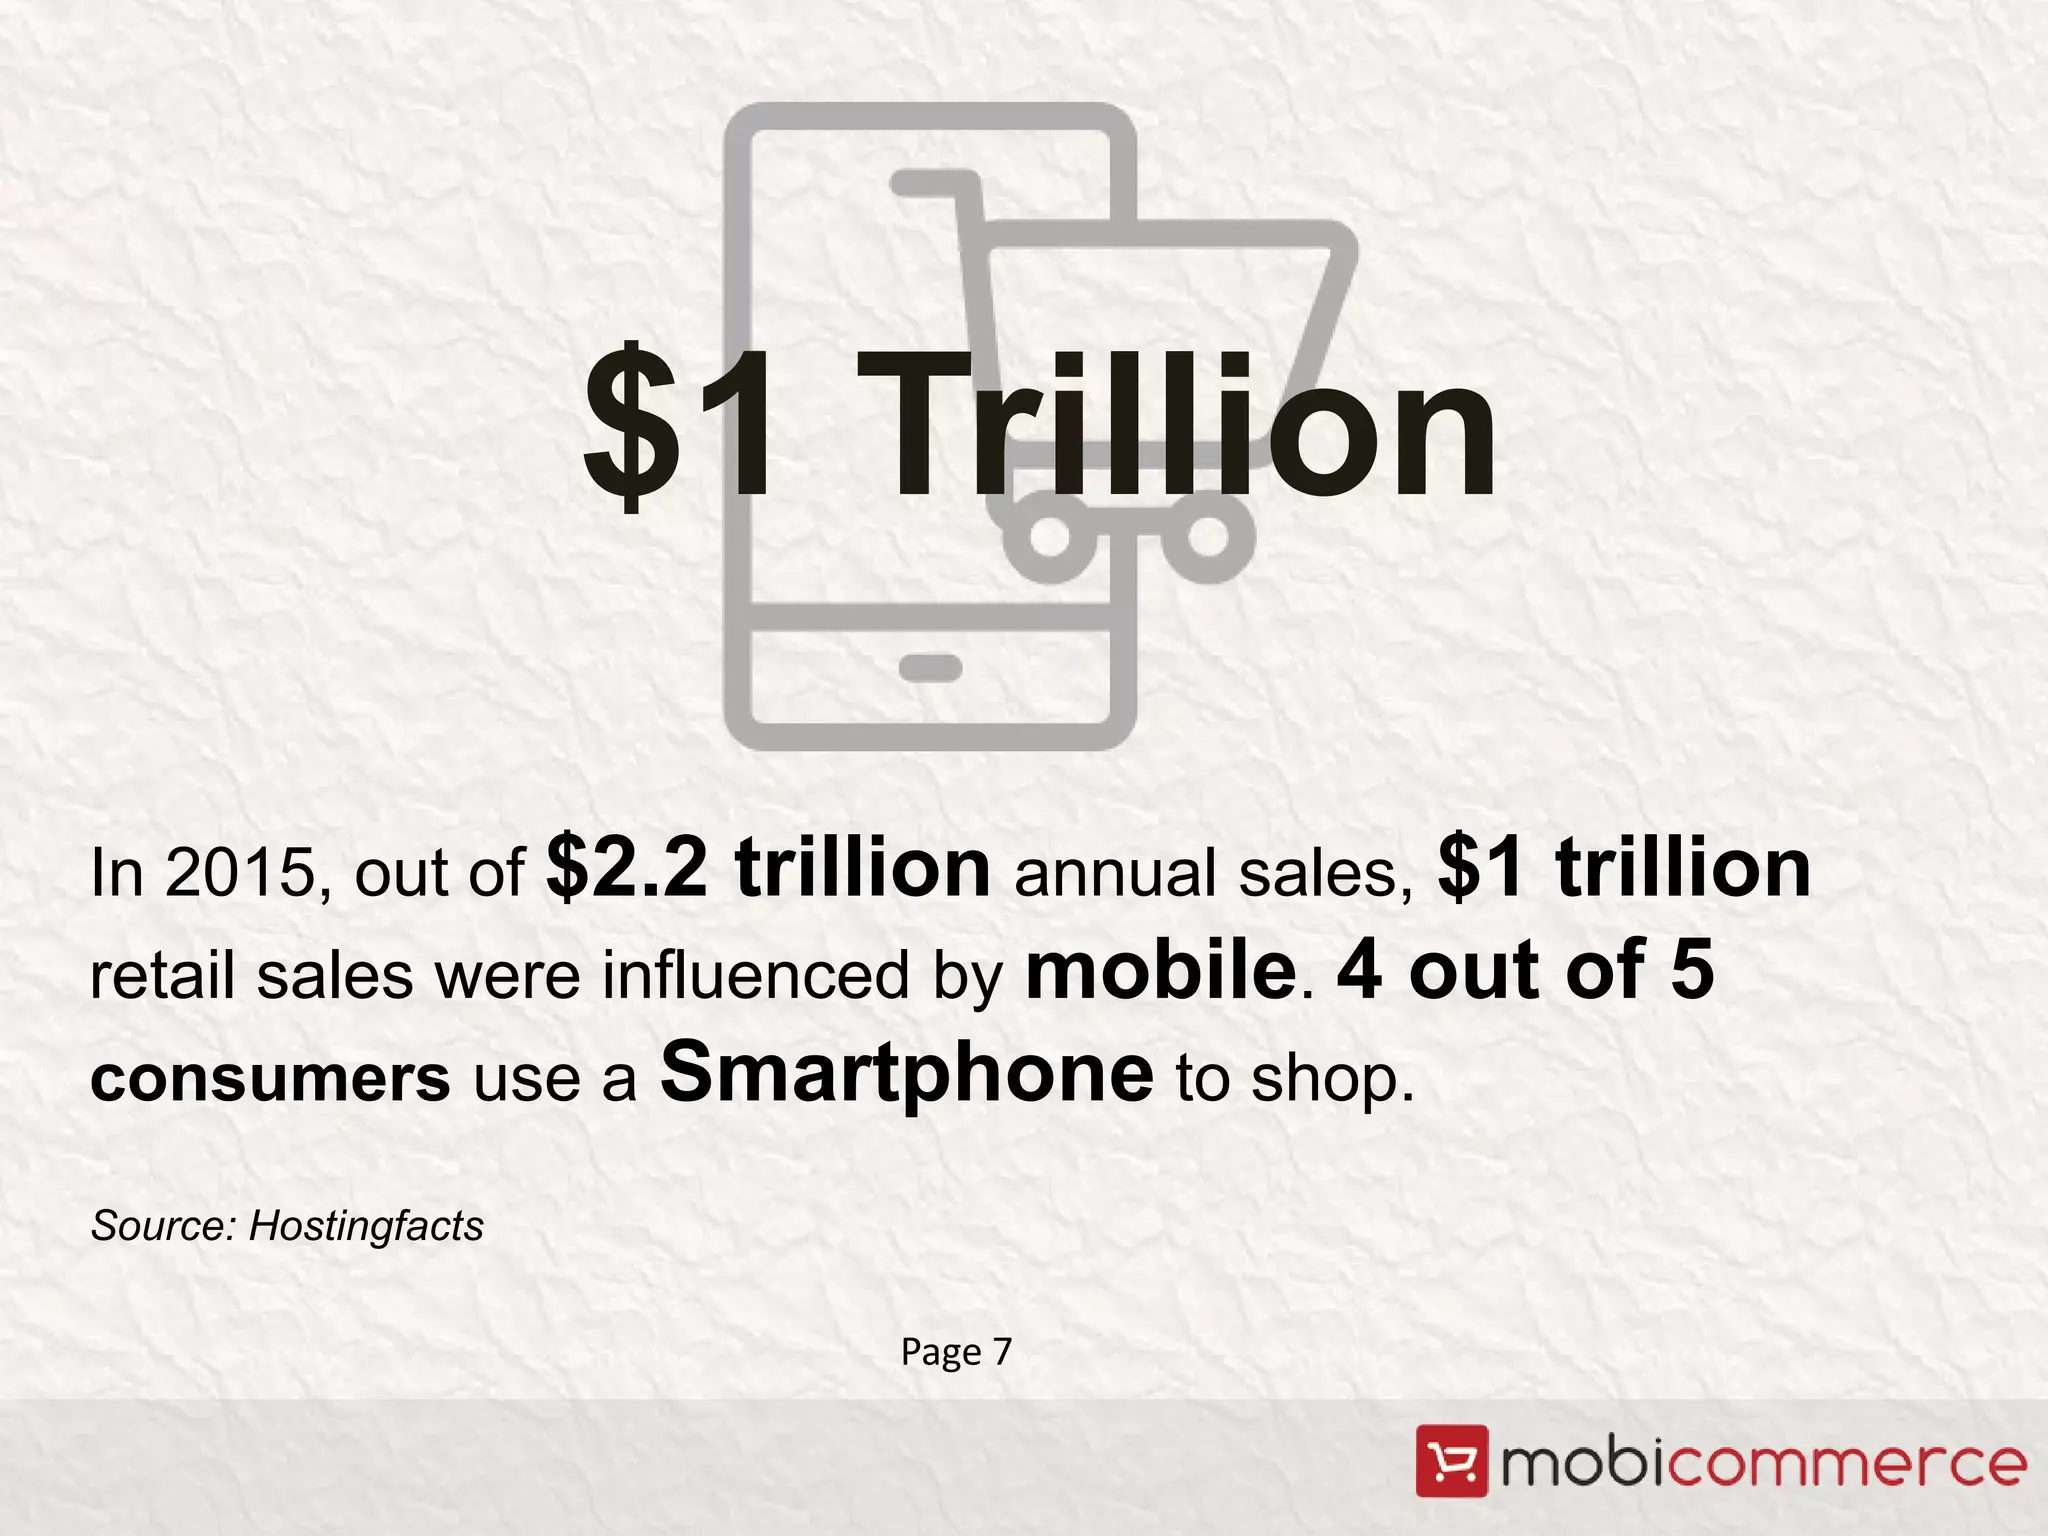
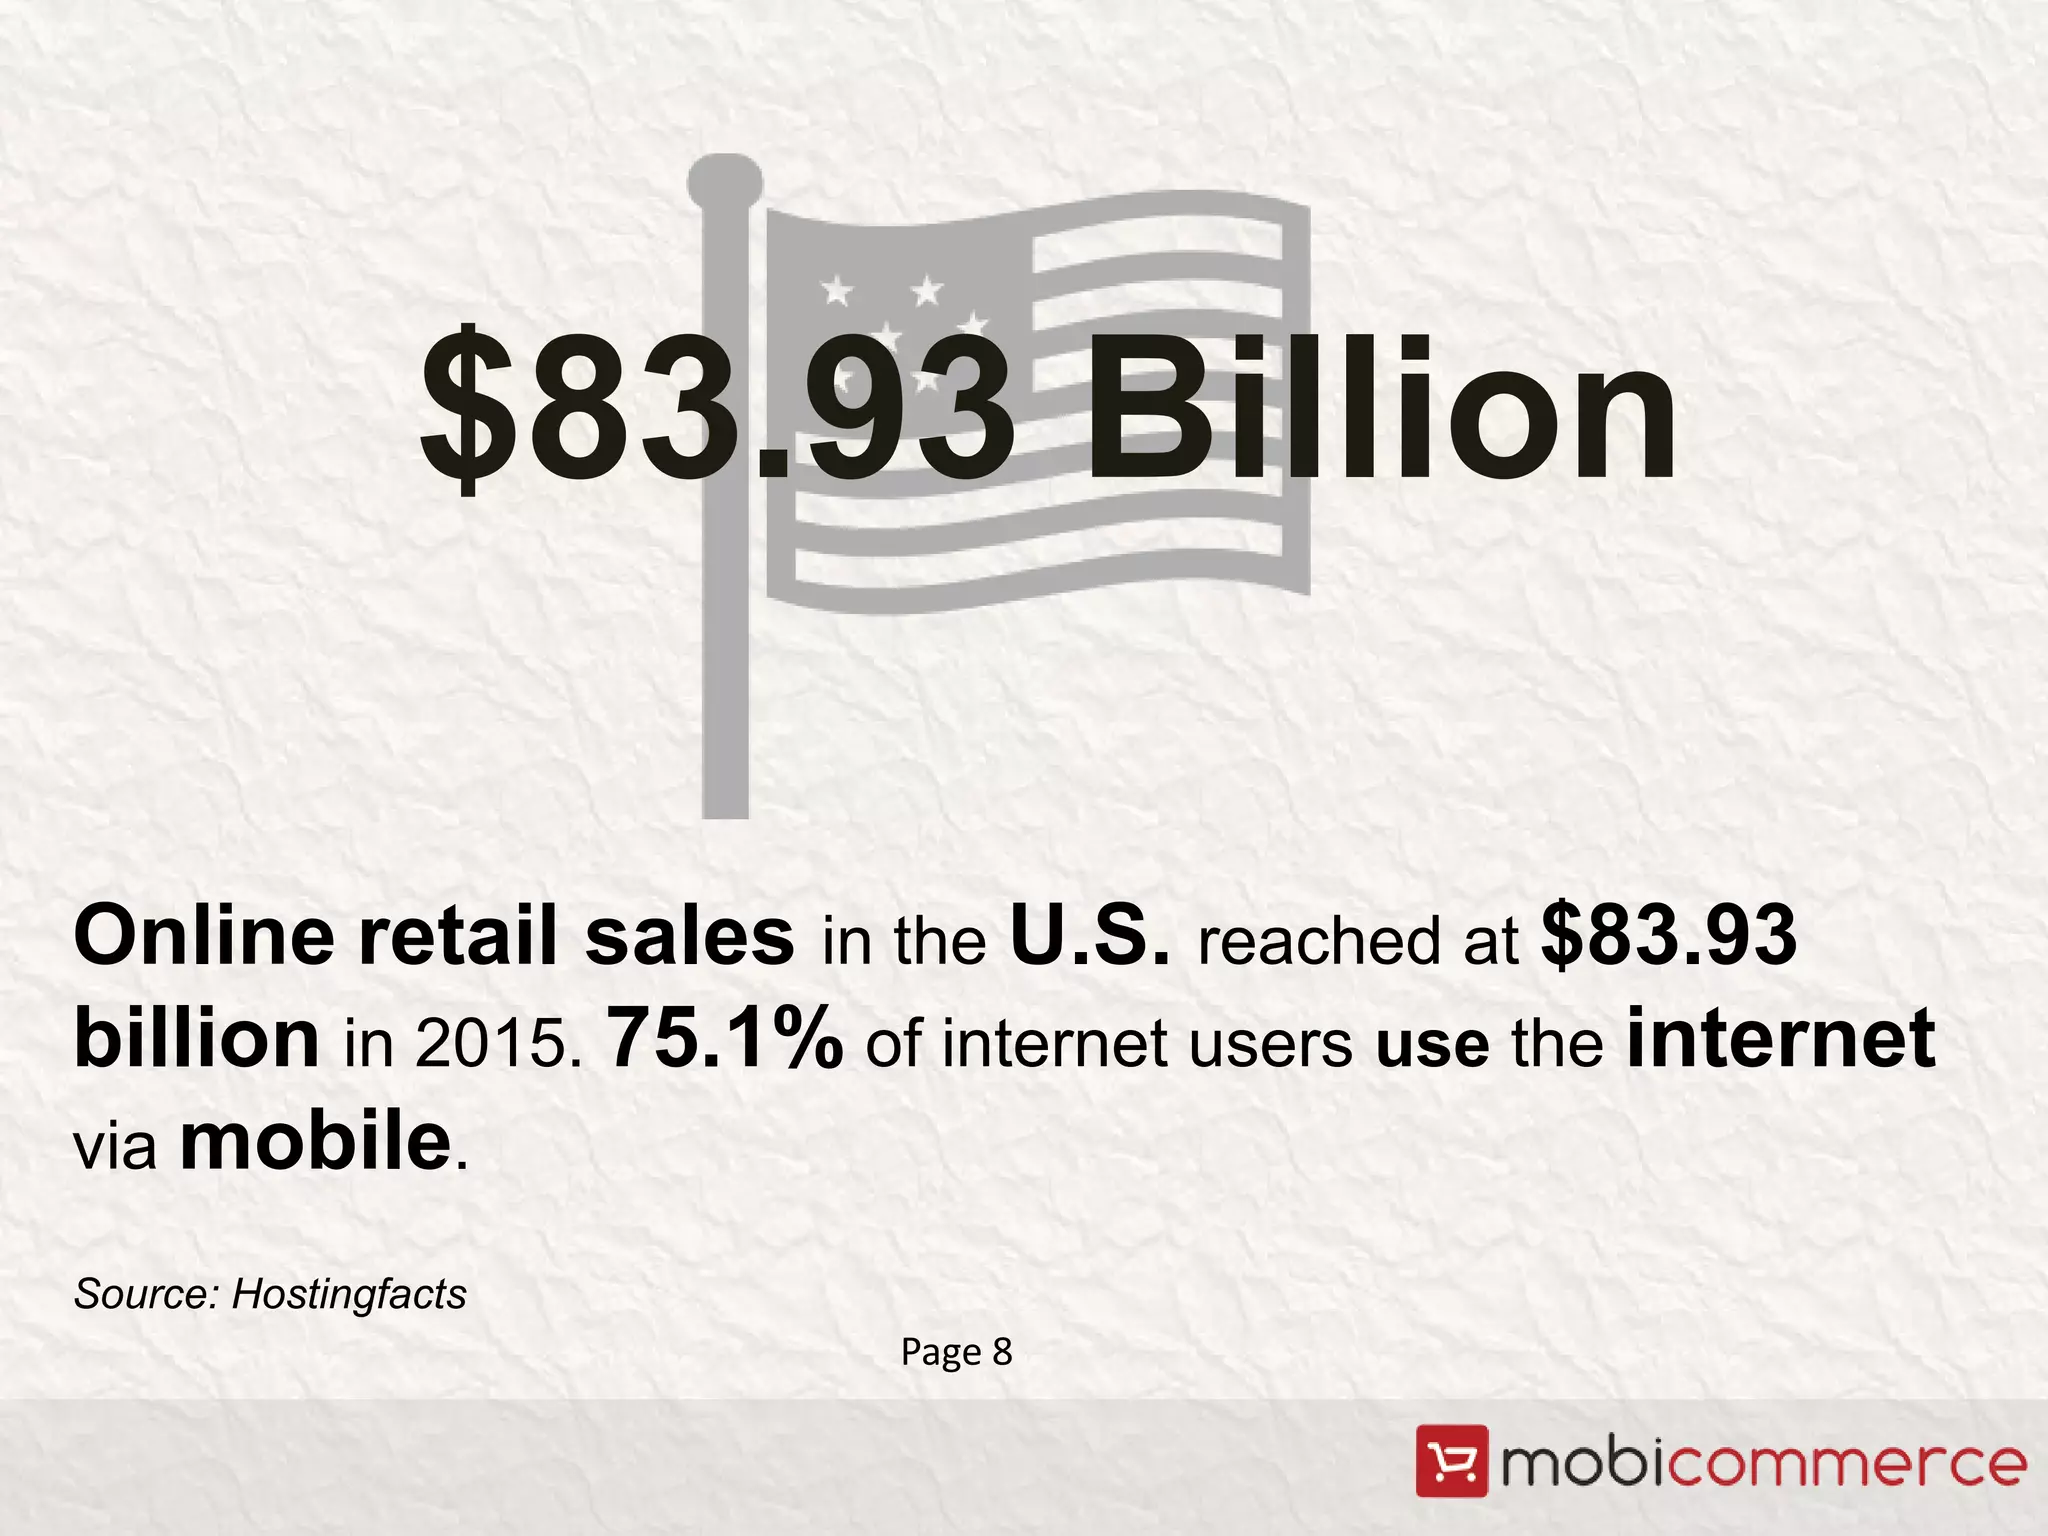


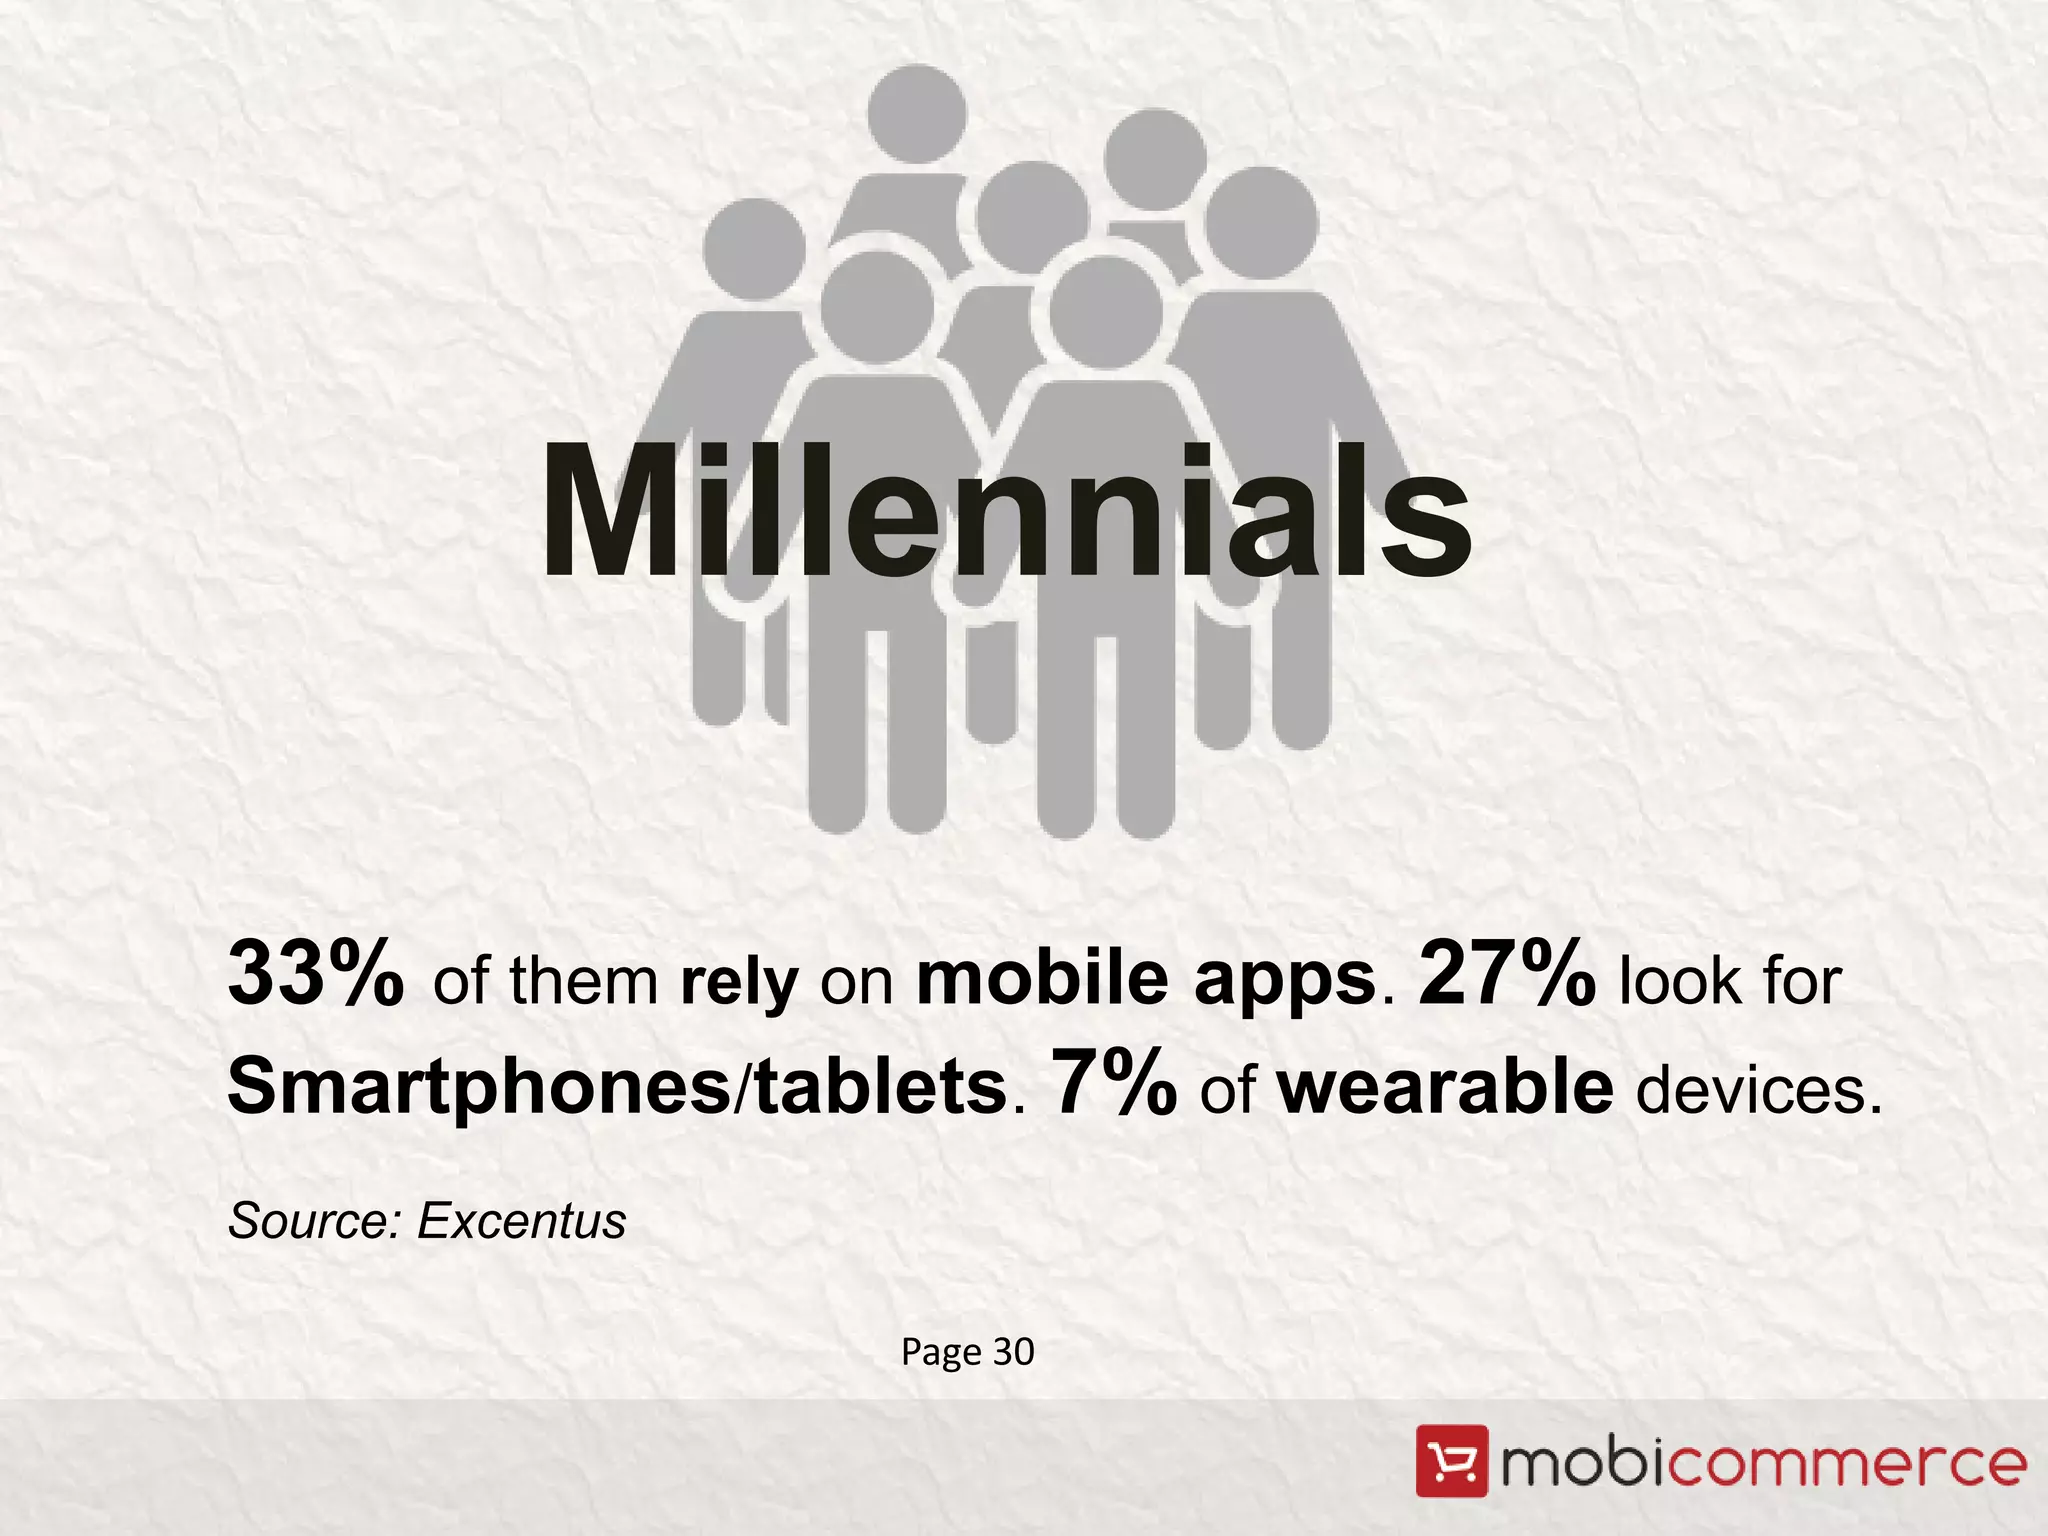


The document provides an overview of mobile shopping statistics, highlighting that 52.7% of internet users access the web via mobile devices and that mobile purchases are increasingly influential, contributing to $1 trillion in retail sales in 2015. It emphasizes the importance of mobile apps, with 80% of consumers using smartphones to shop, and discusses behavioral trends among millennials regarding mobile app usage and loyalty programs. Additionally, it notes that mobile coupons have gained popularity, with 85% of consumers seeking them before shopping.


