Download to read offline
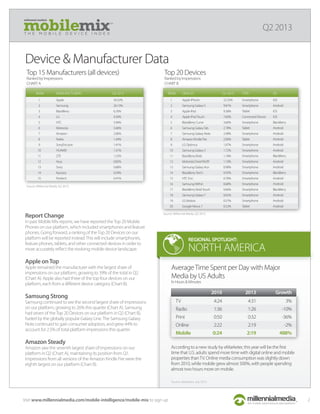


Apple maintained the largest share of mobile devices, while Samsung grew significantly. Smartphones and tablets continued to dominate, comprising 70% and 25% of devices respectively. Android and iOS accounted for 93% of the operating systems. Top categories included games, music, and communications apps, with text messaging being the most popular communication method.


![5G Explained! A High Level Overview [Introduction]](https://cdn.slidesharecdn.com/ss_thumbnails/5gexplainedahighleveloverview-260119165306-cc137a3e-thumbnail.jpg?width=640&height=640&fit=bounds)


