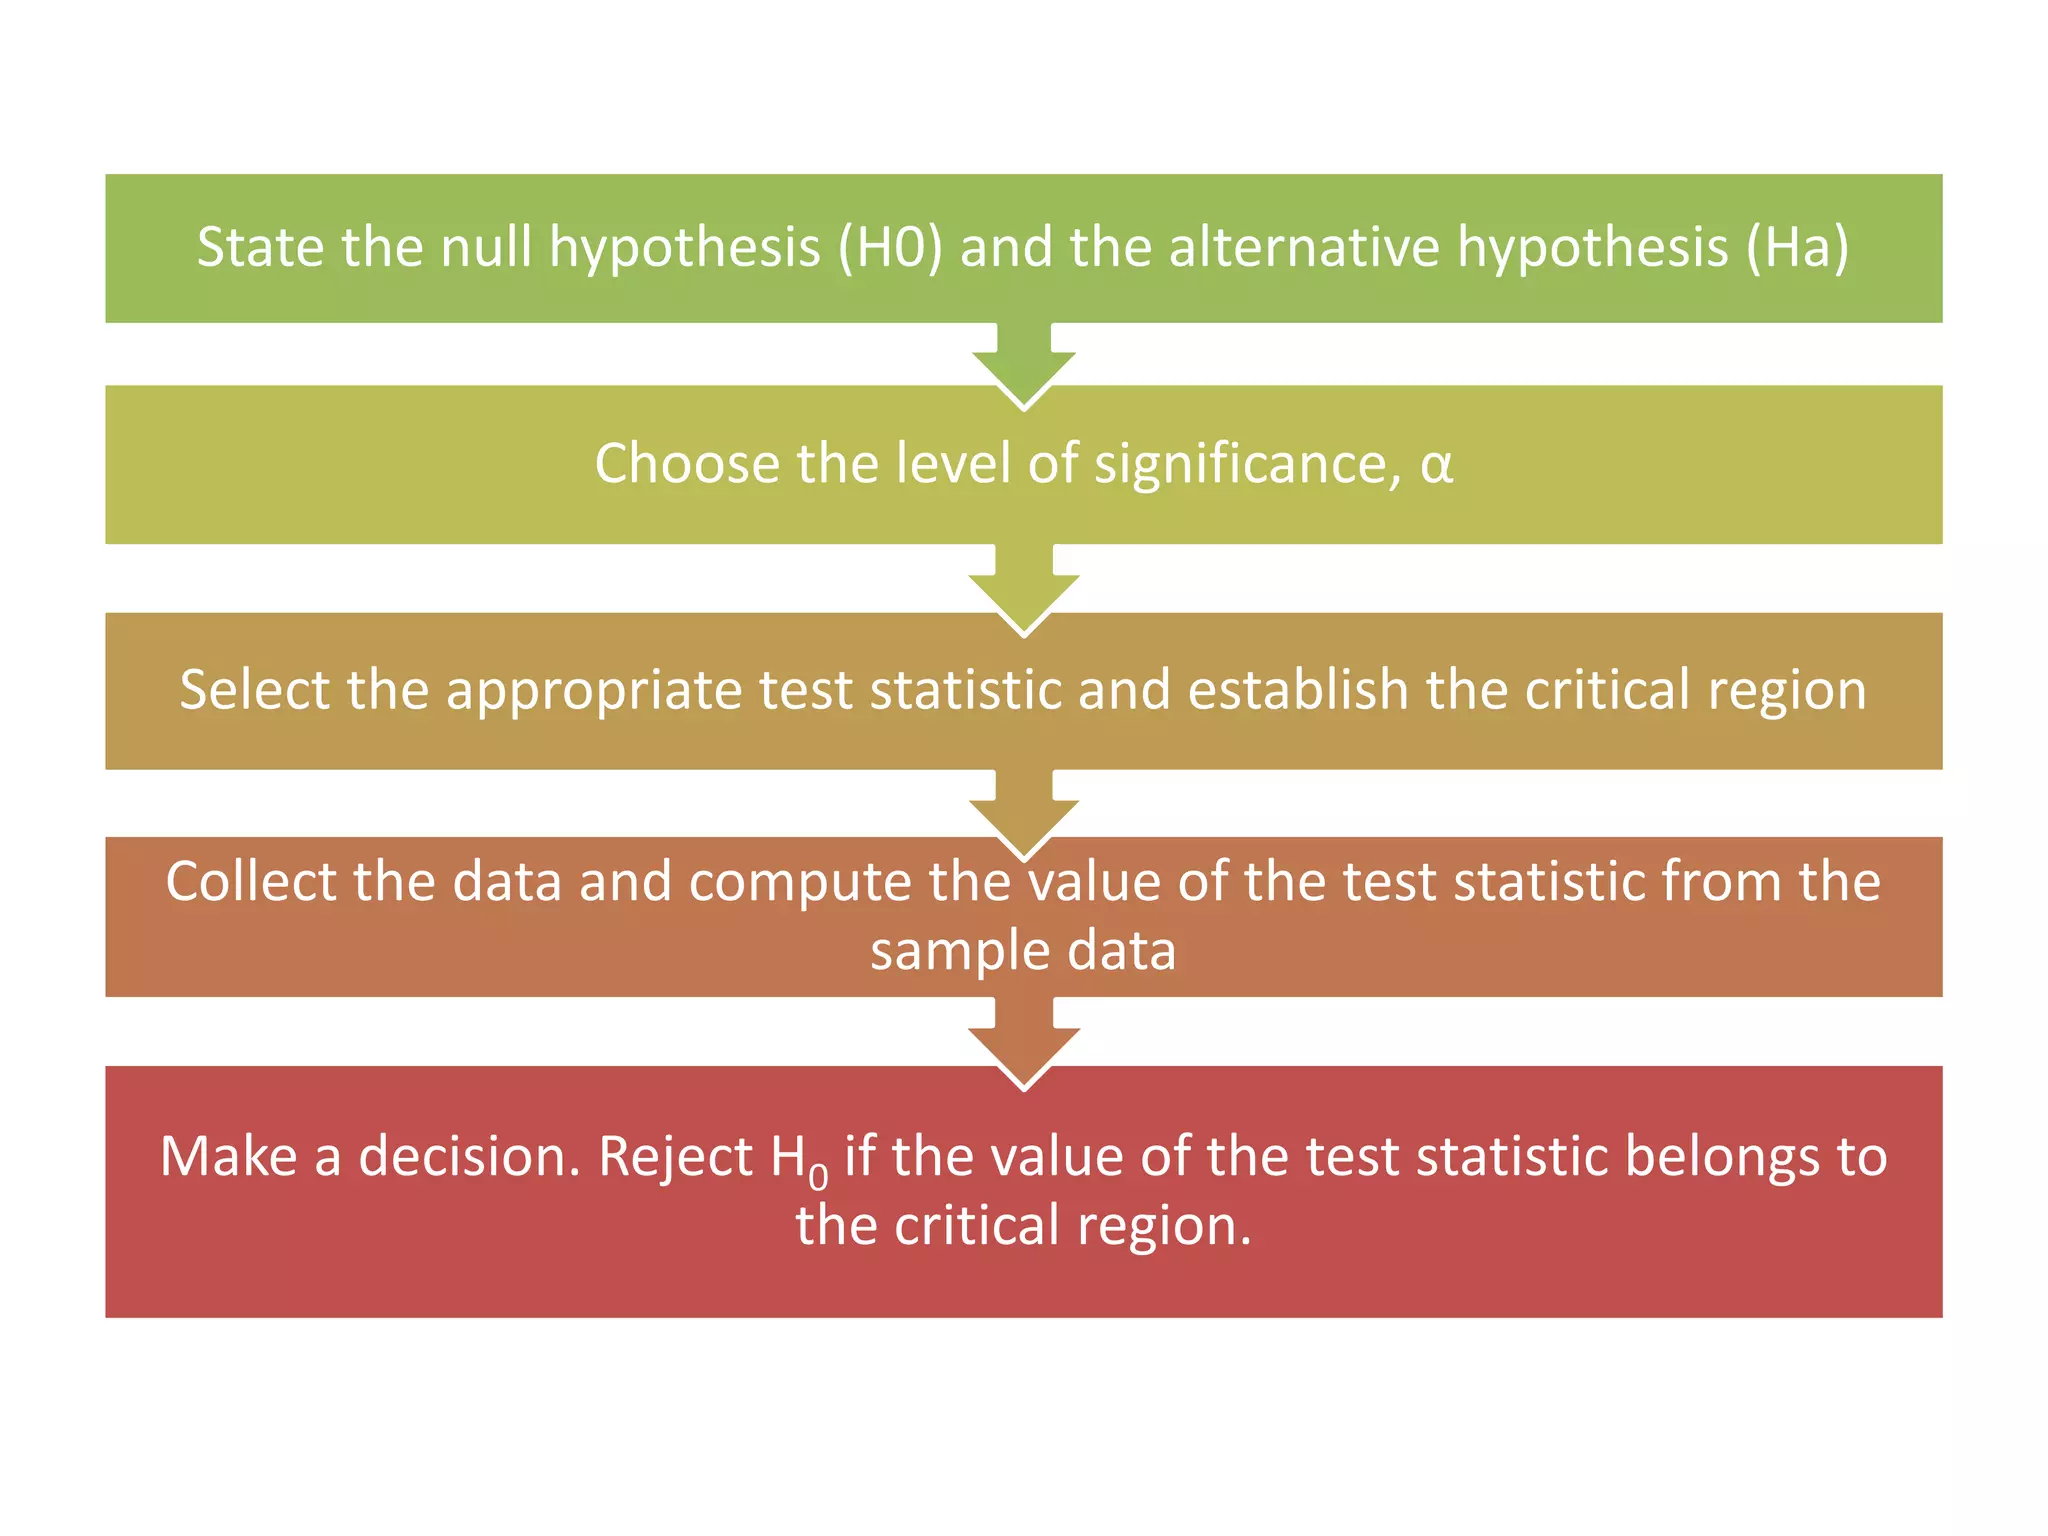
This document discusses hypothesis testing and the key concepts involved, including:
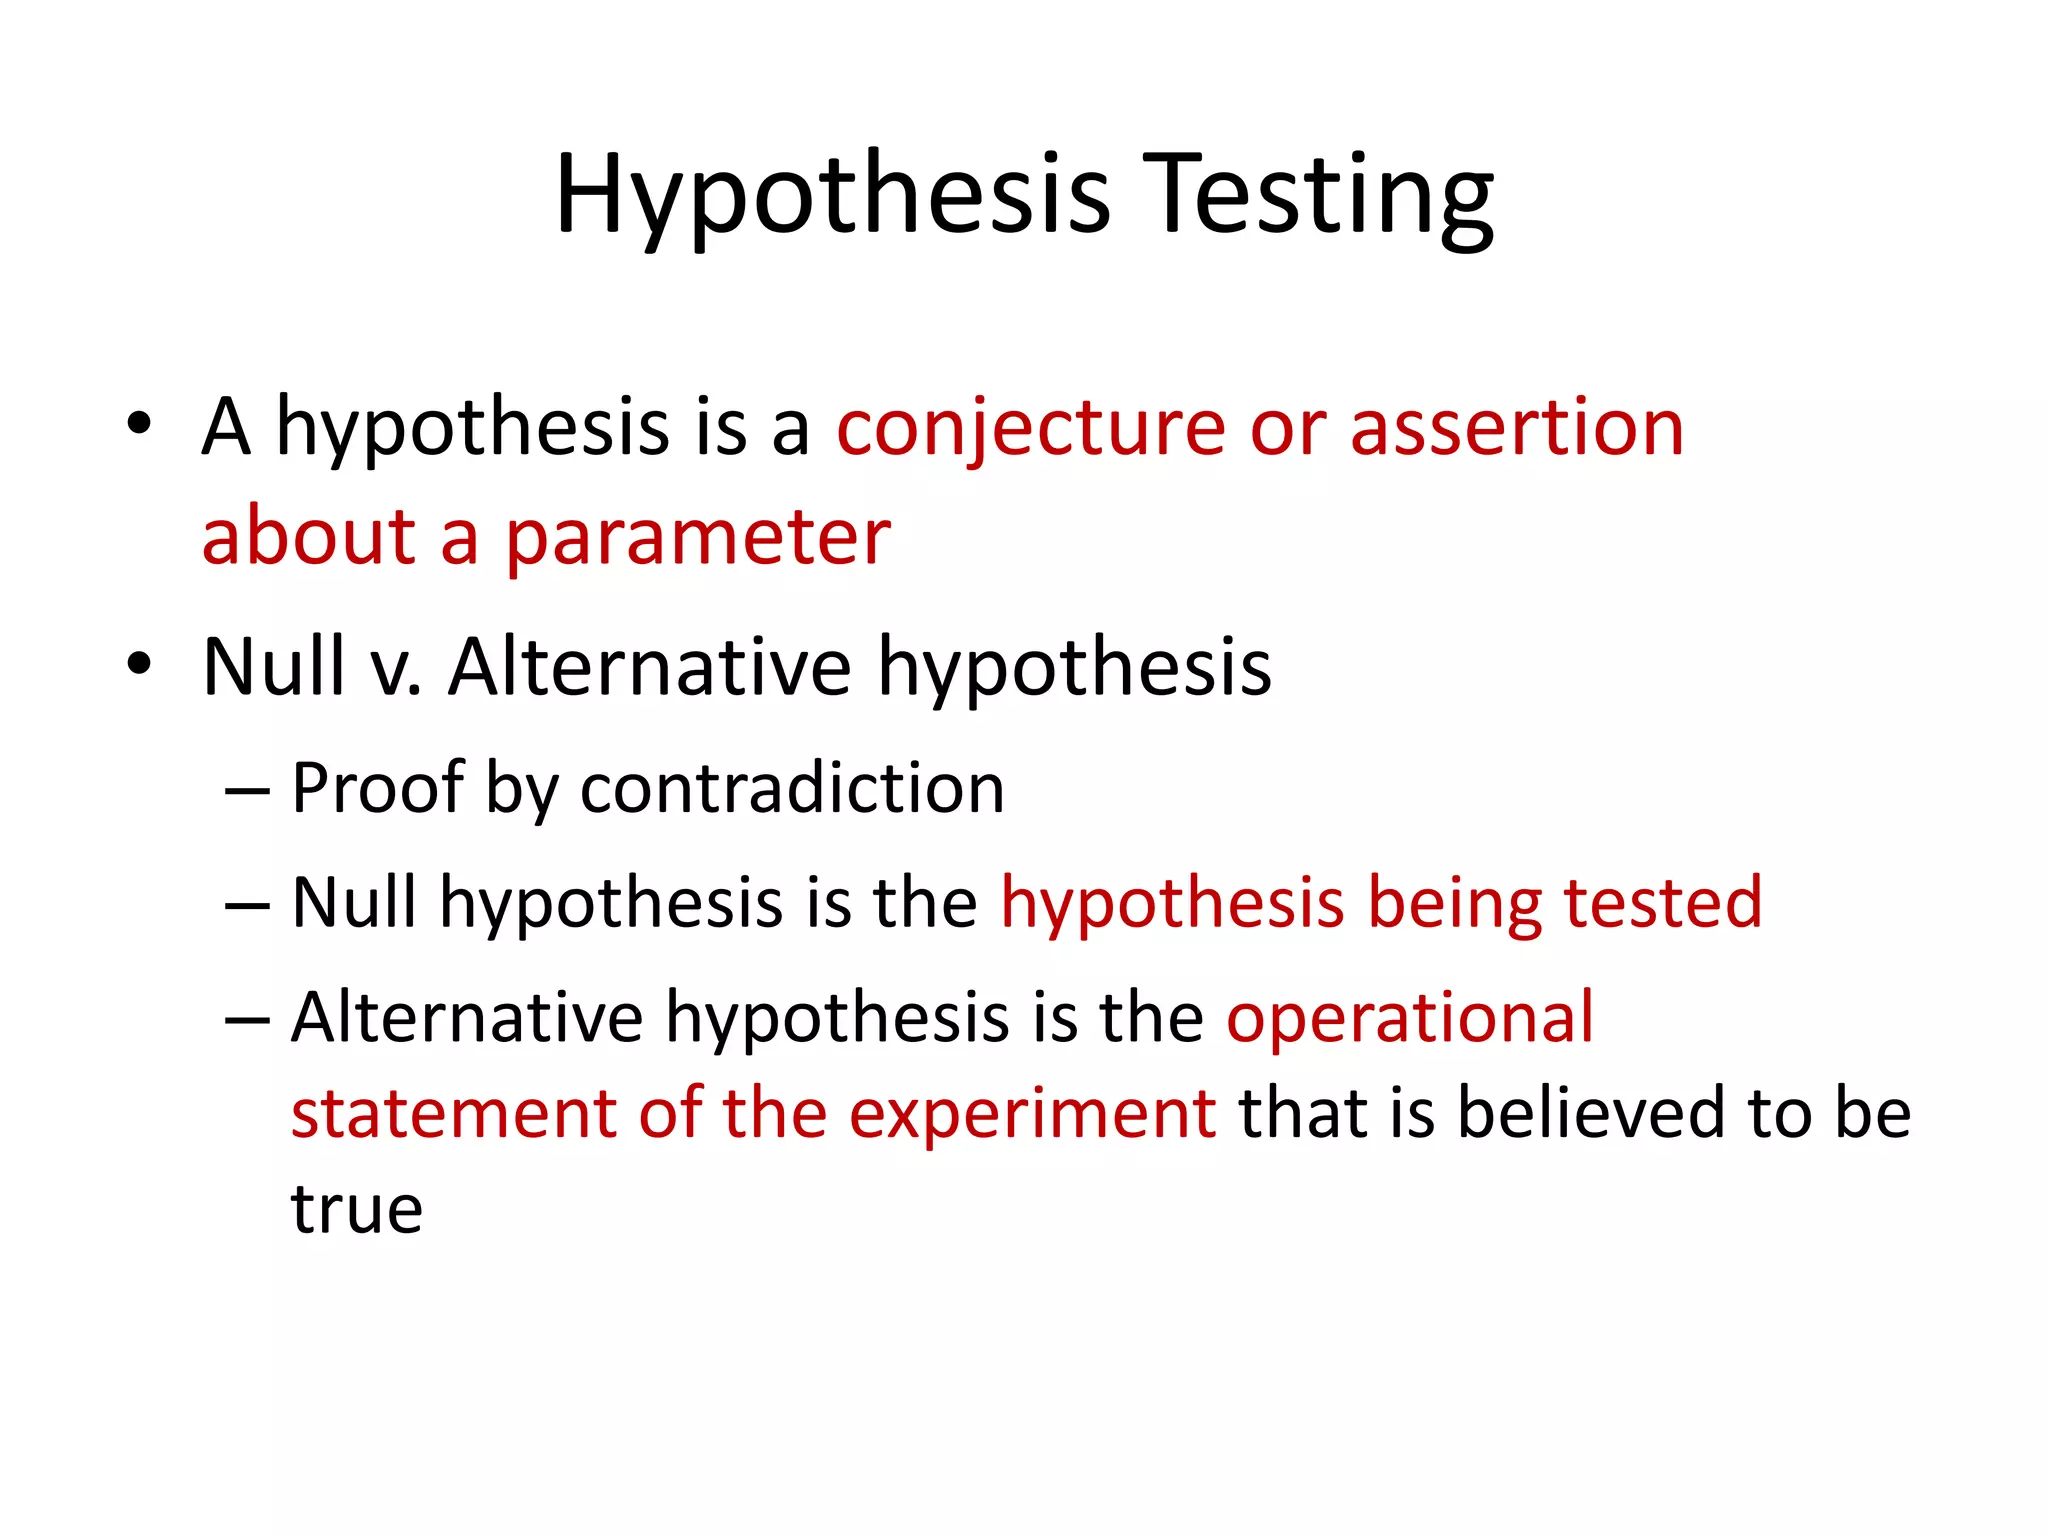
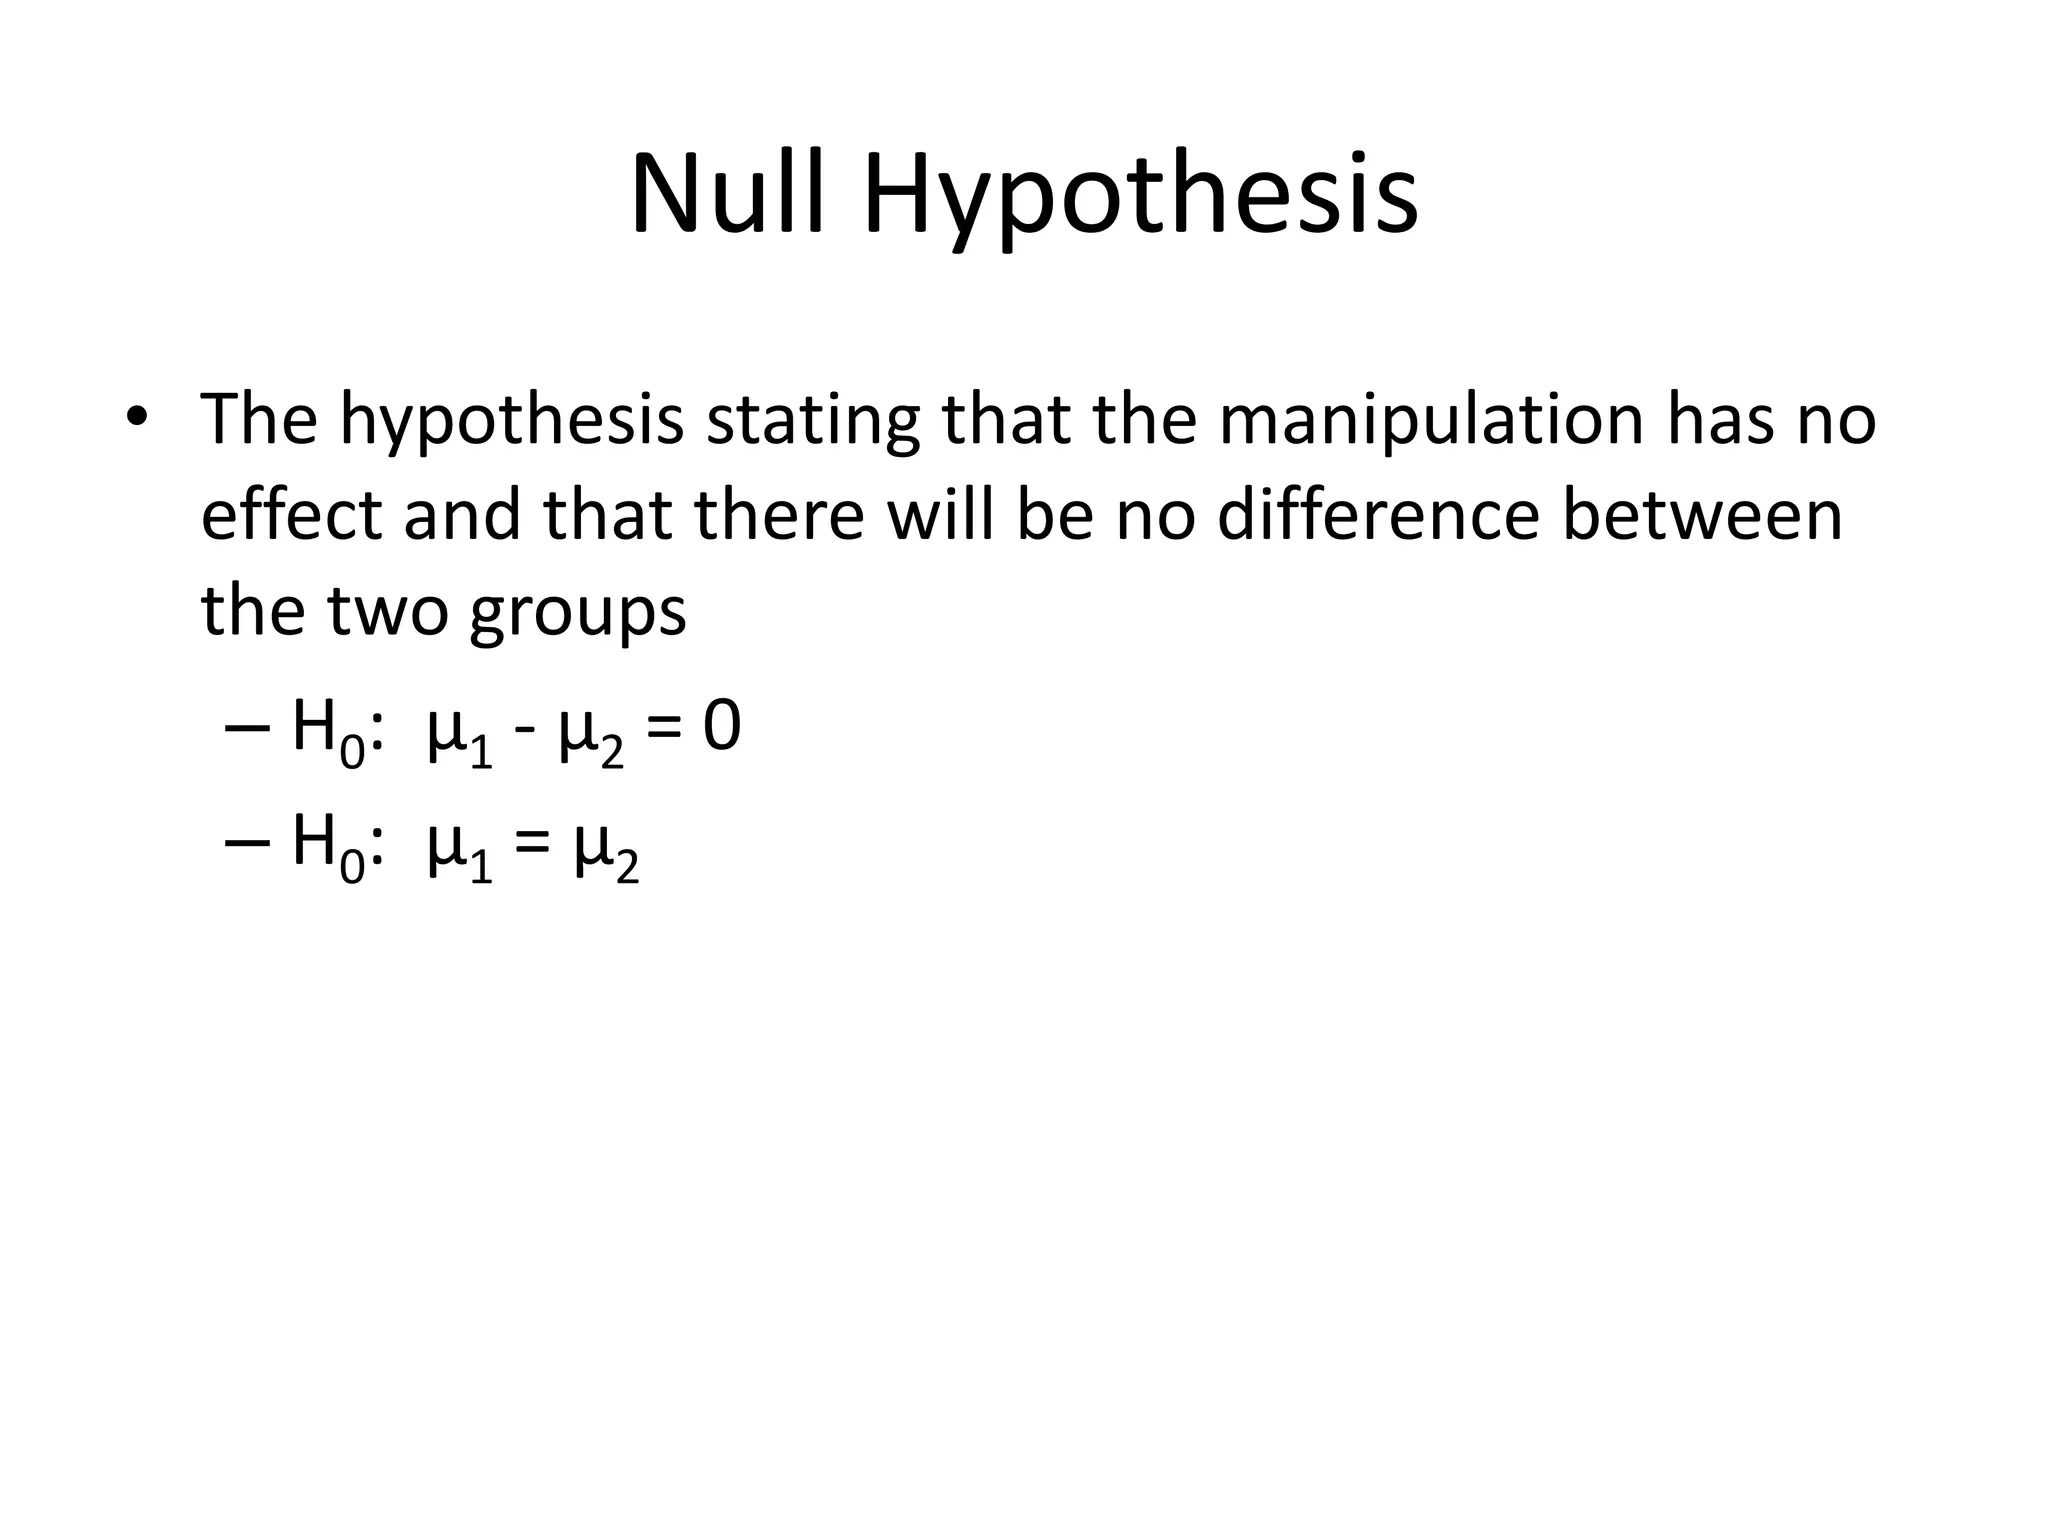
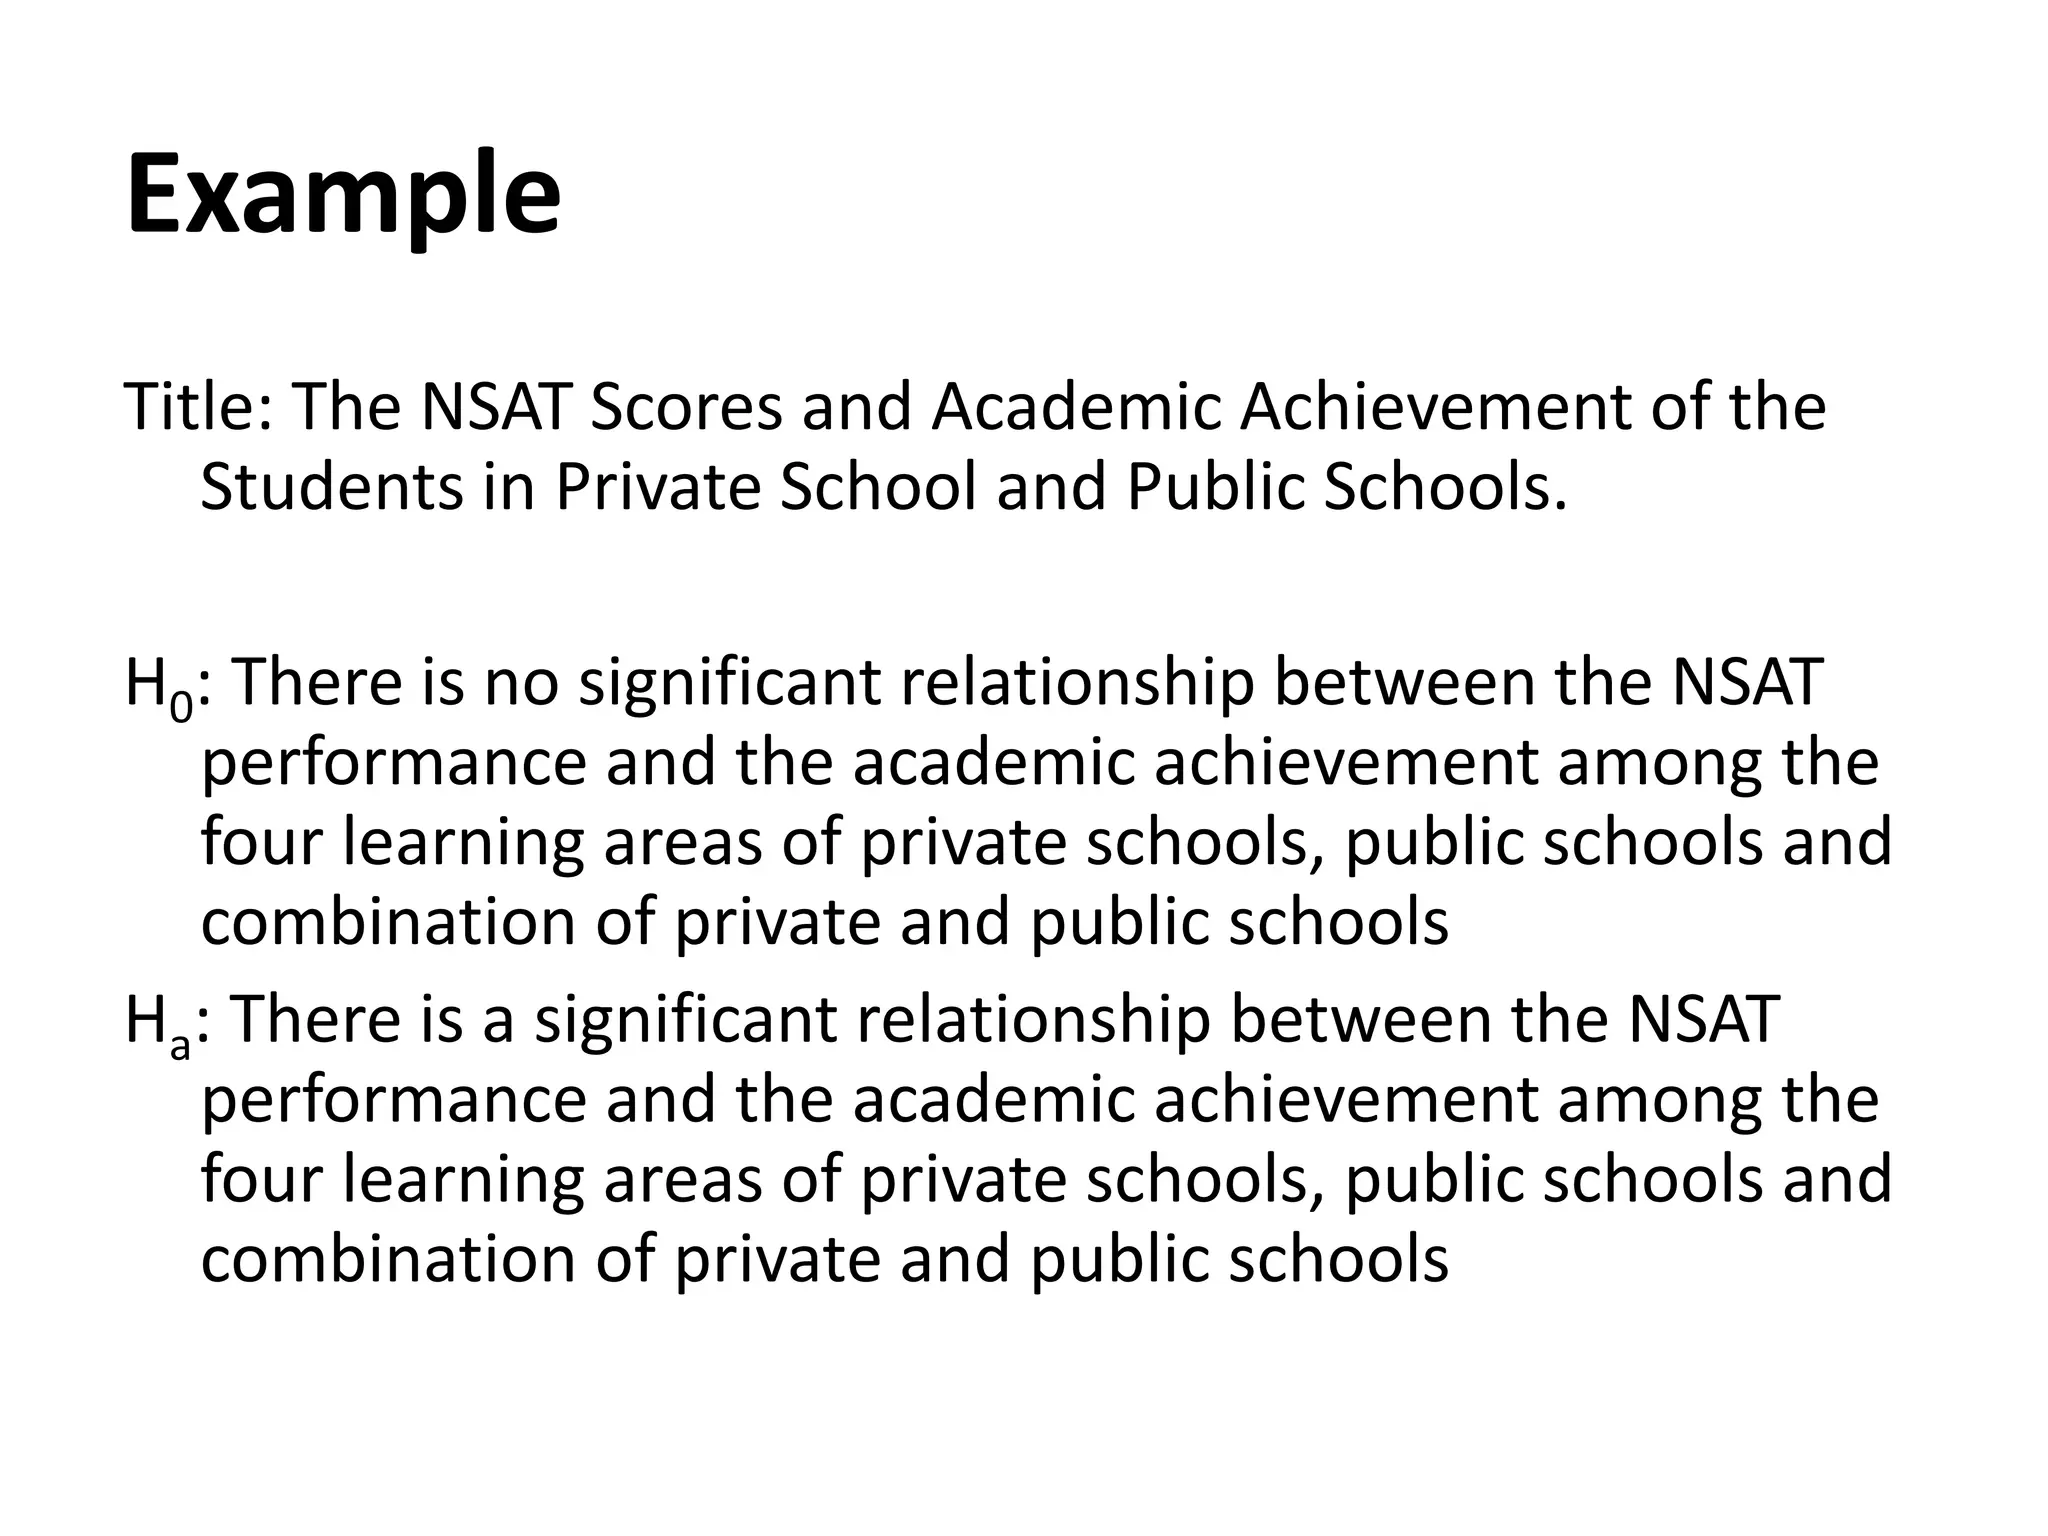
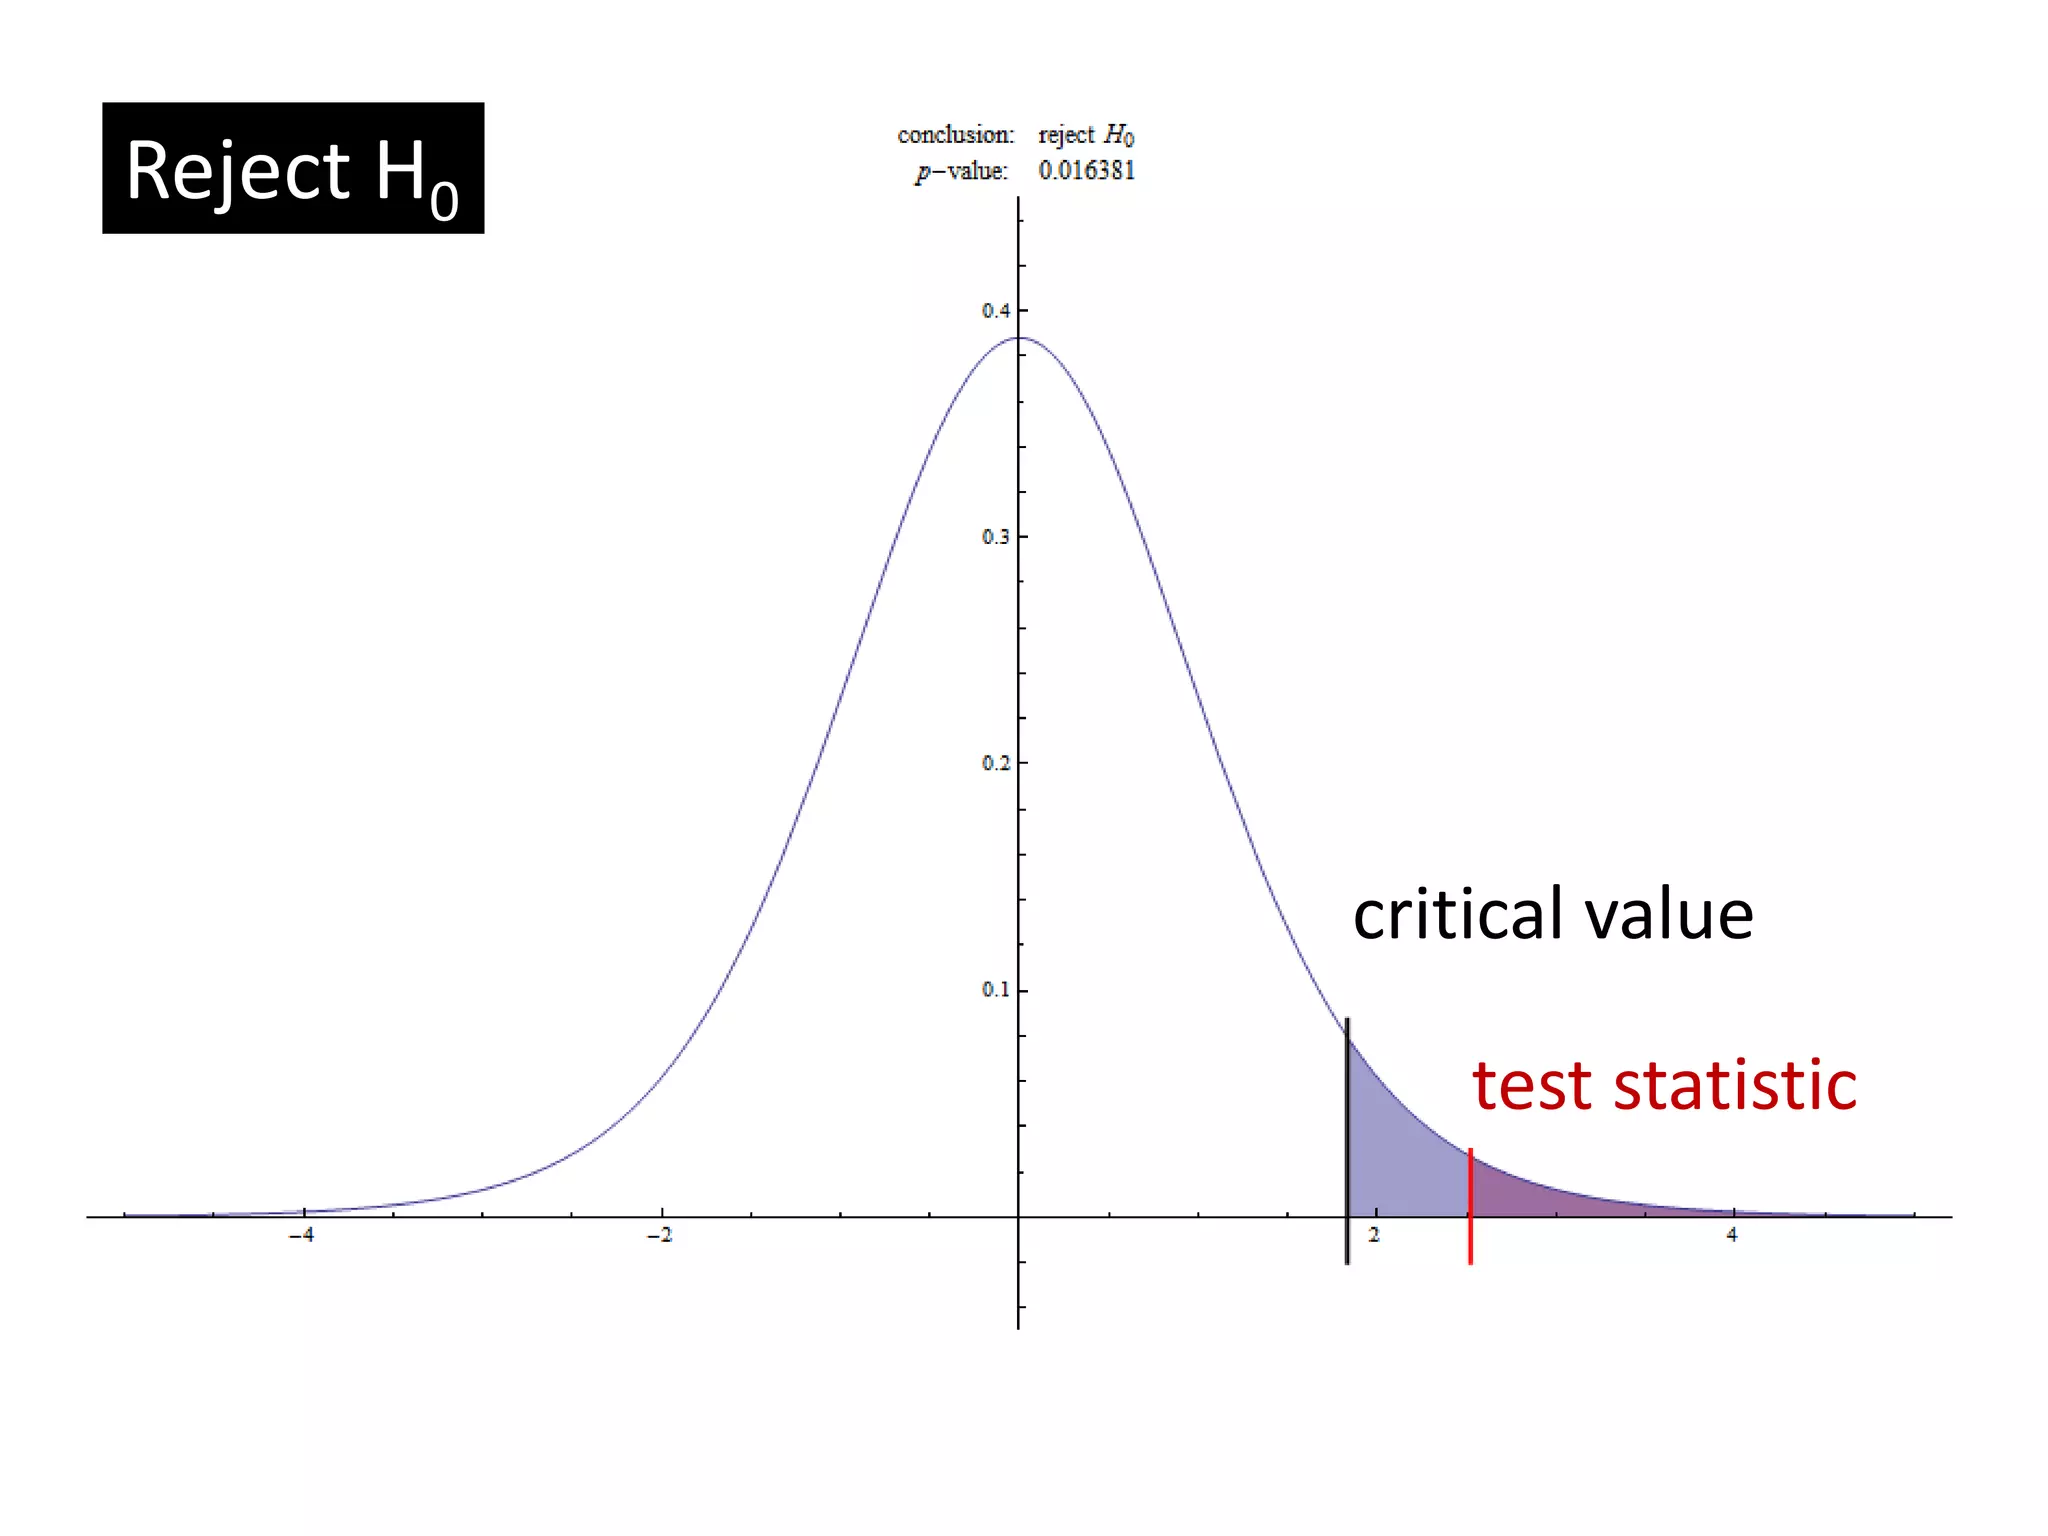
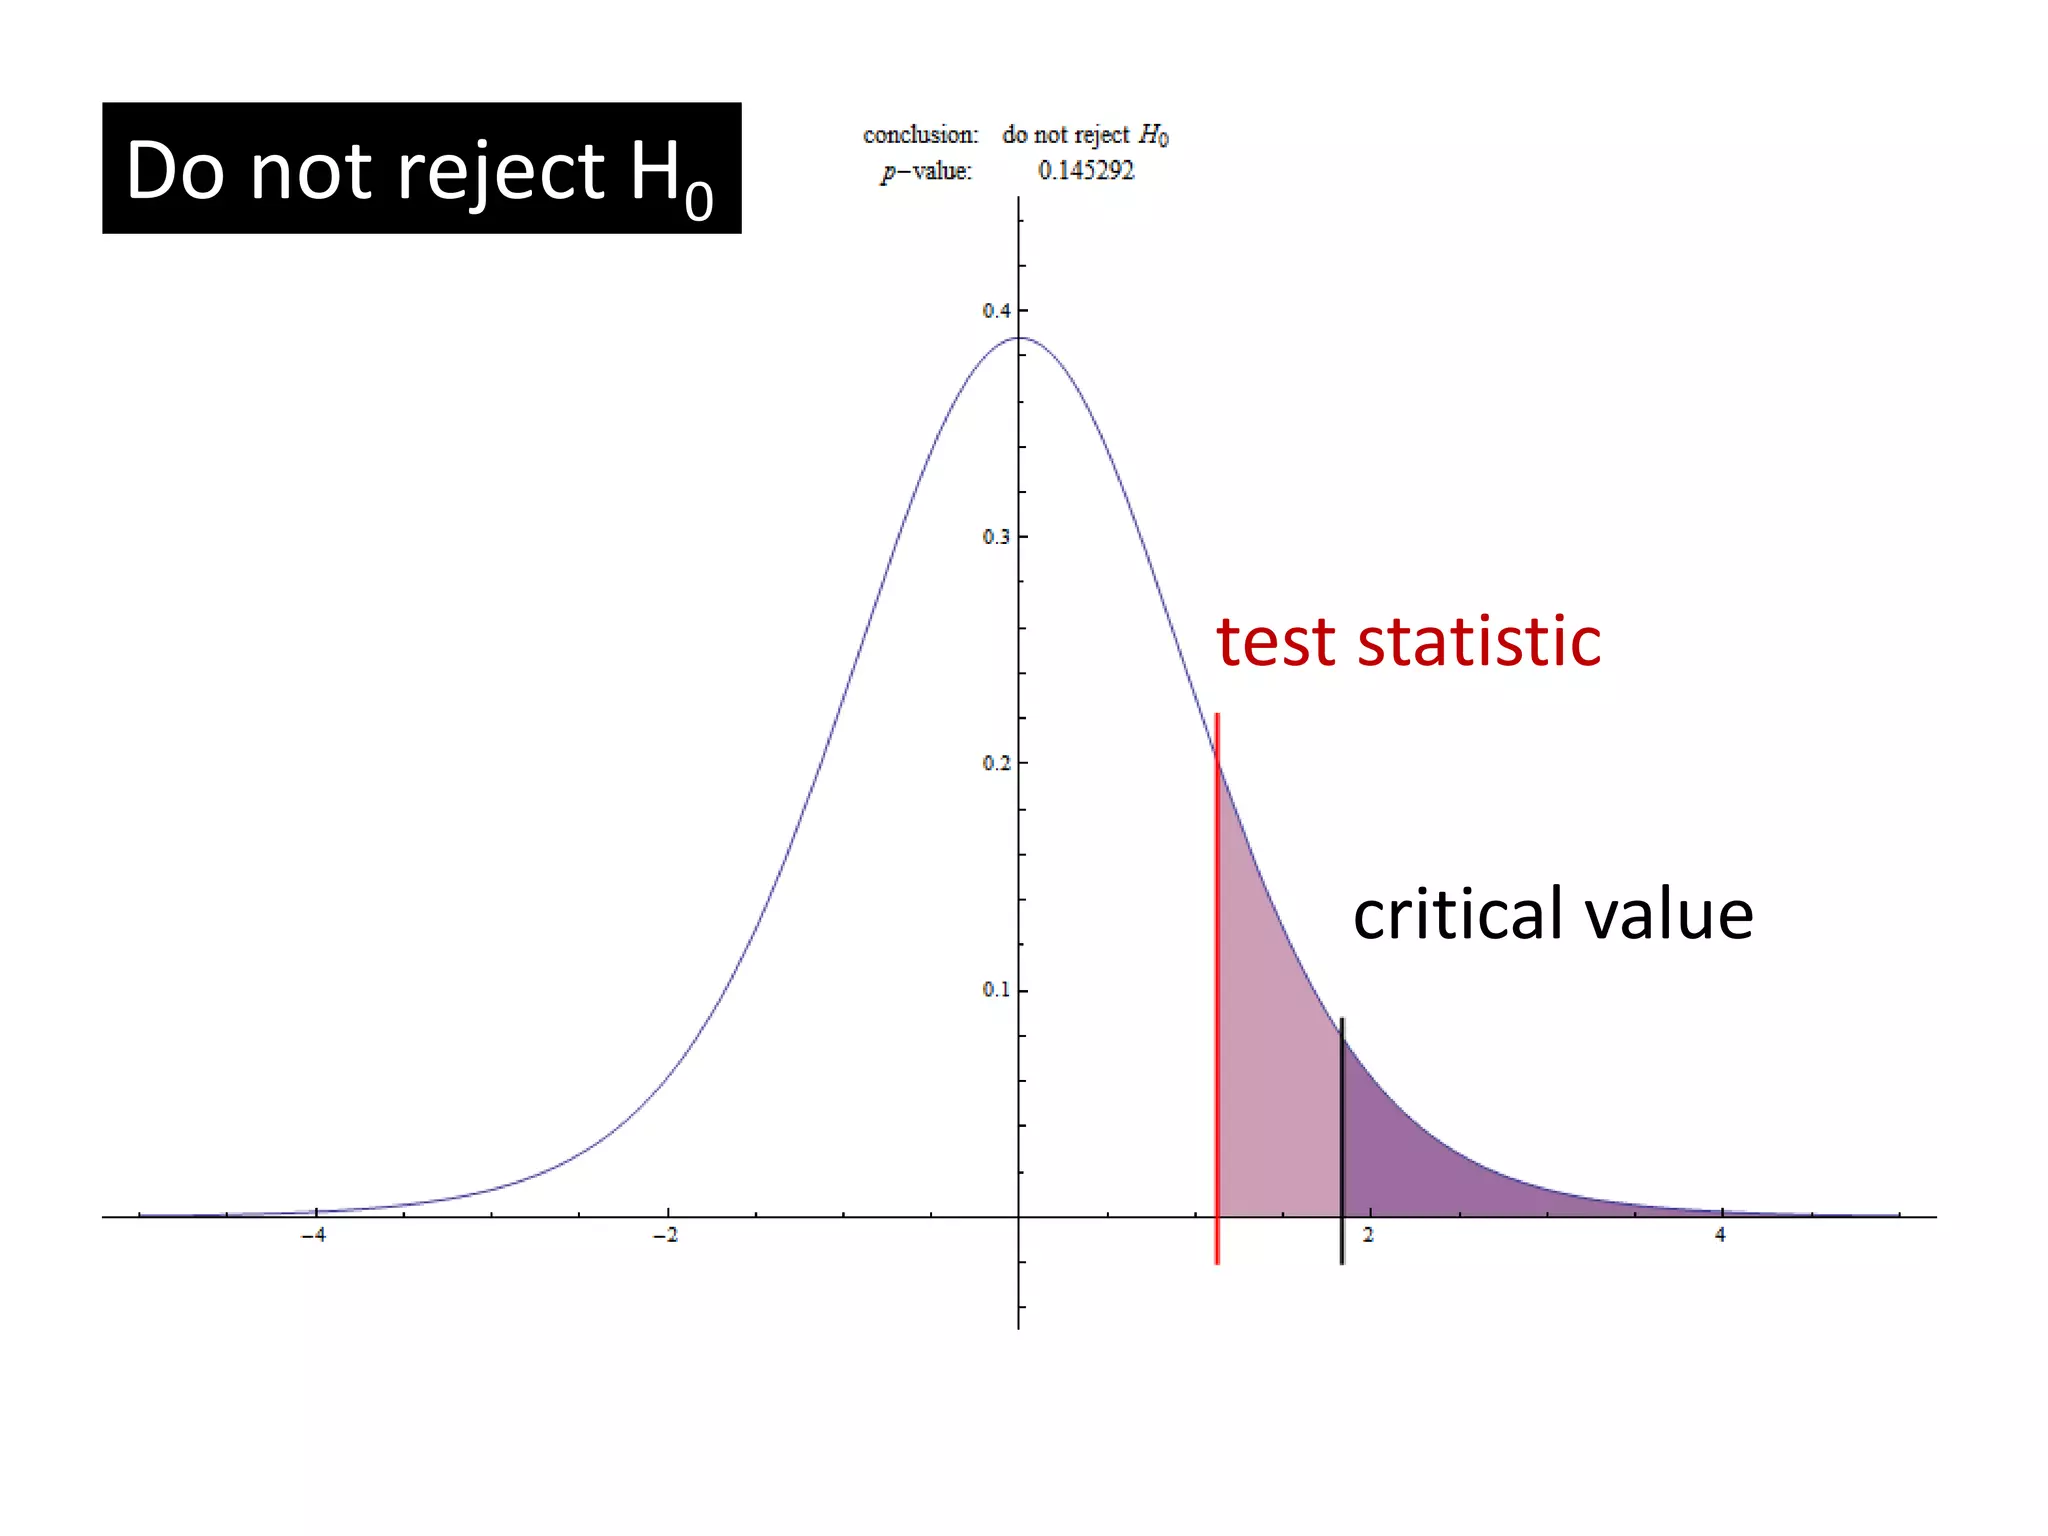
- The difference between the null and alternative hypotheses, with the null hypothesis representing the hypothesis being tested.
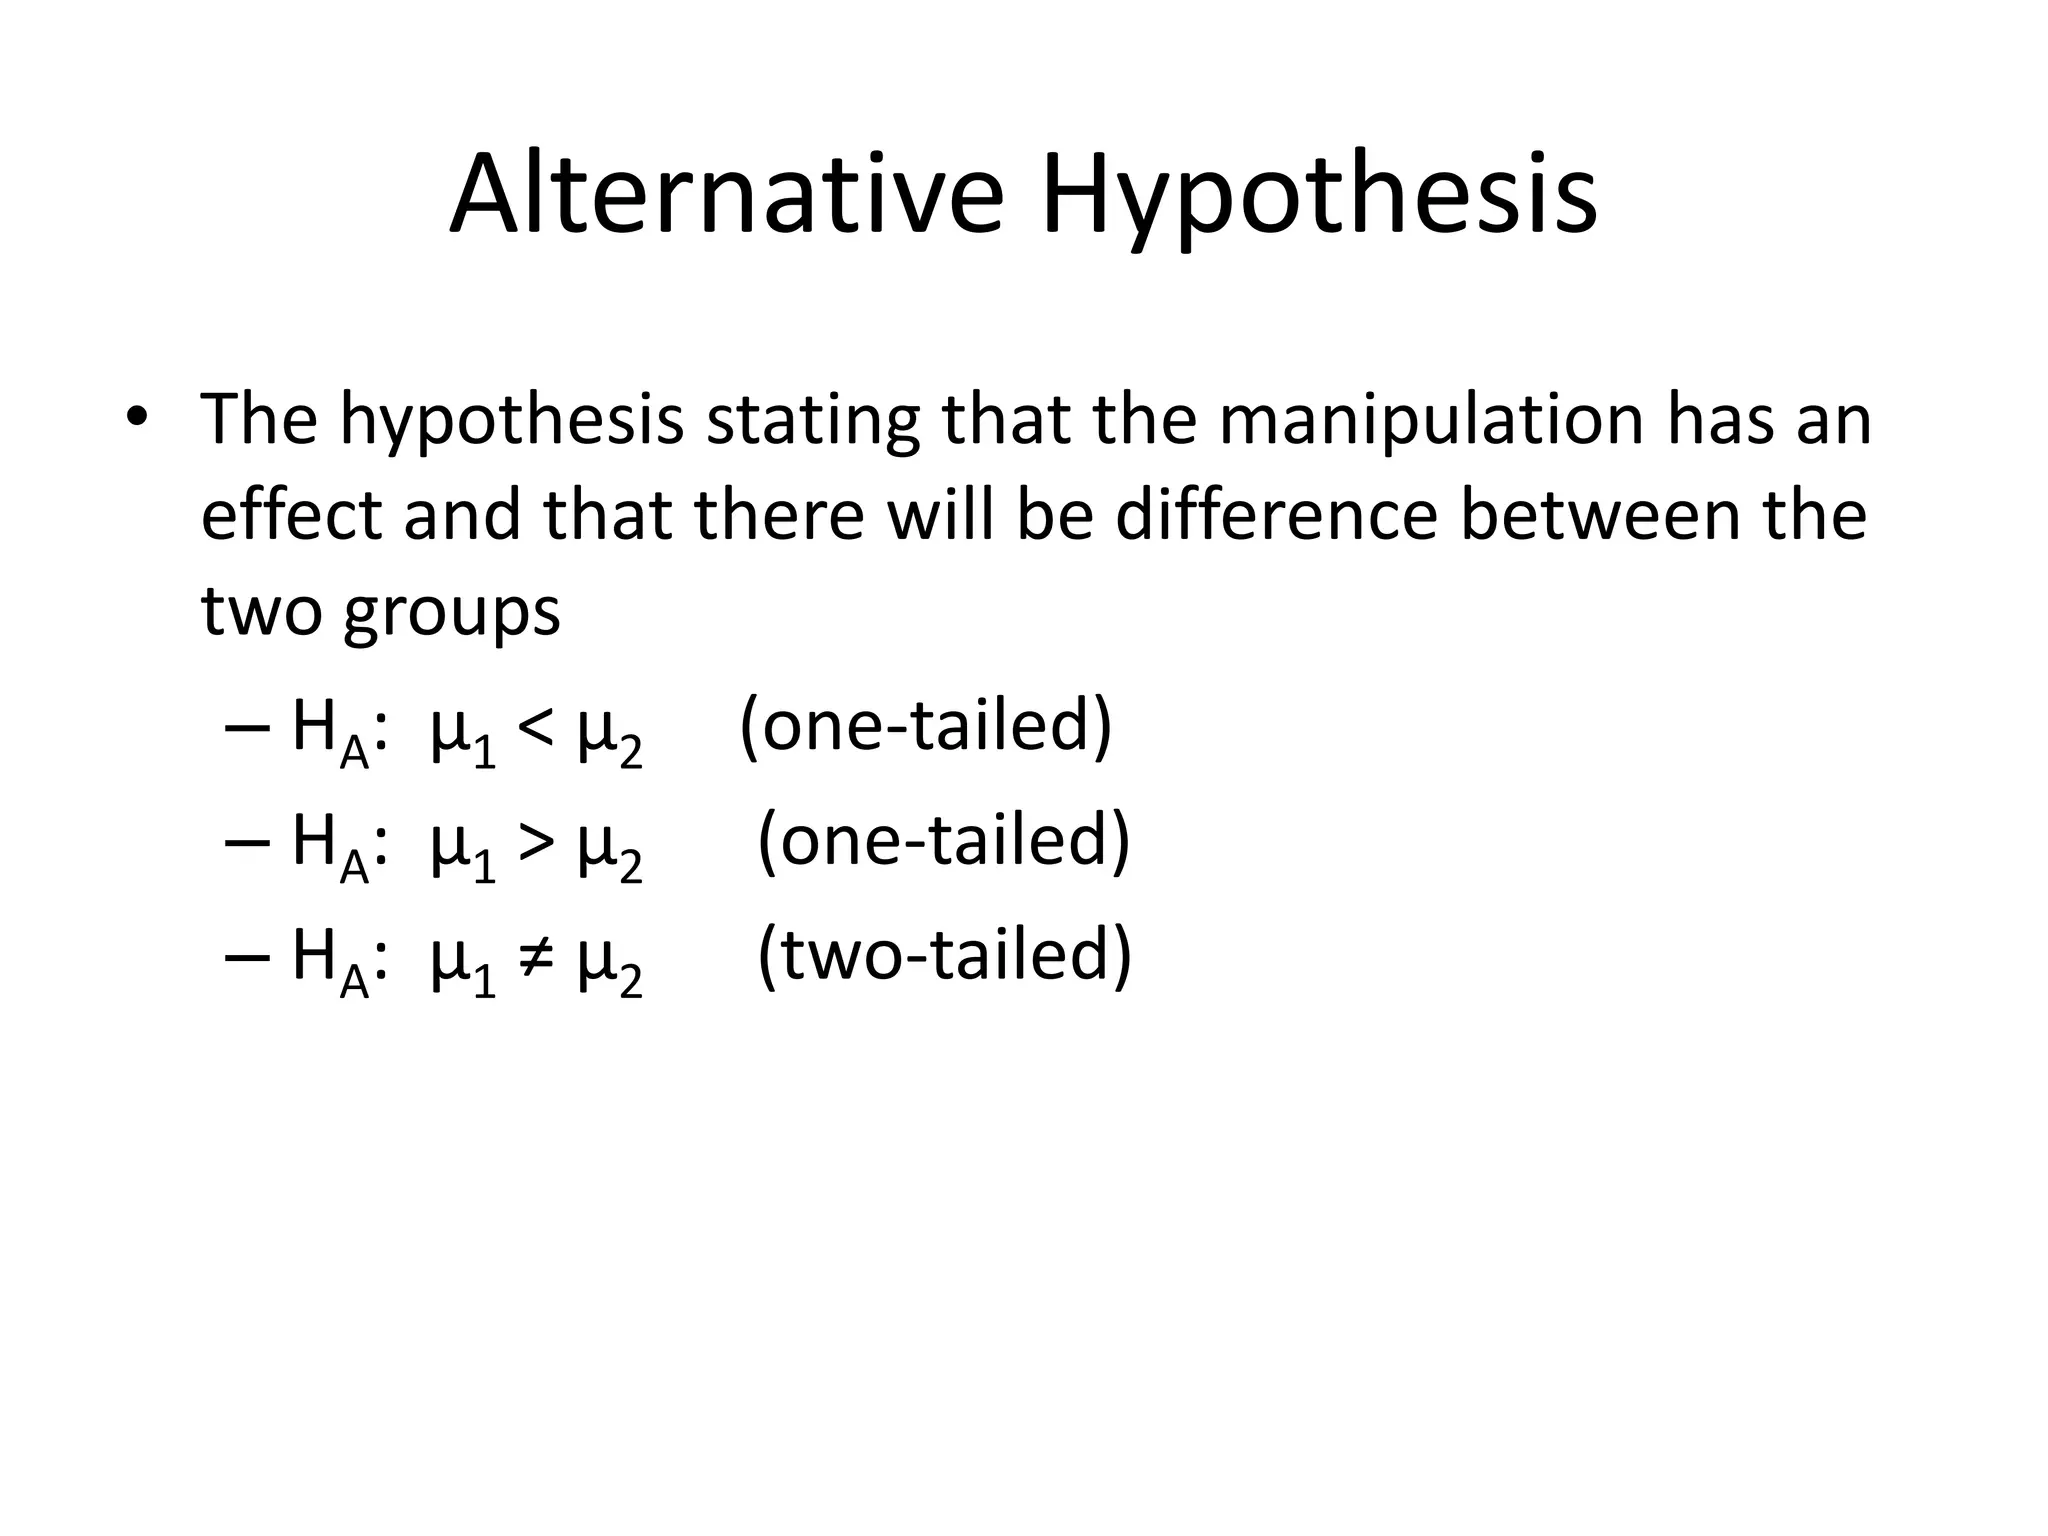
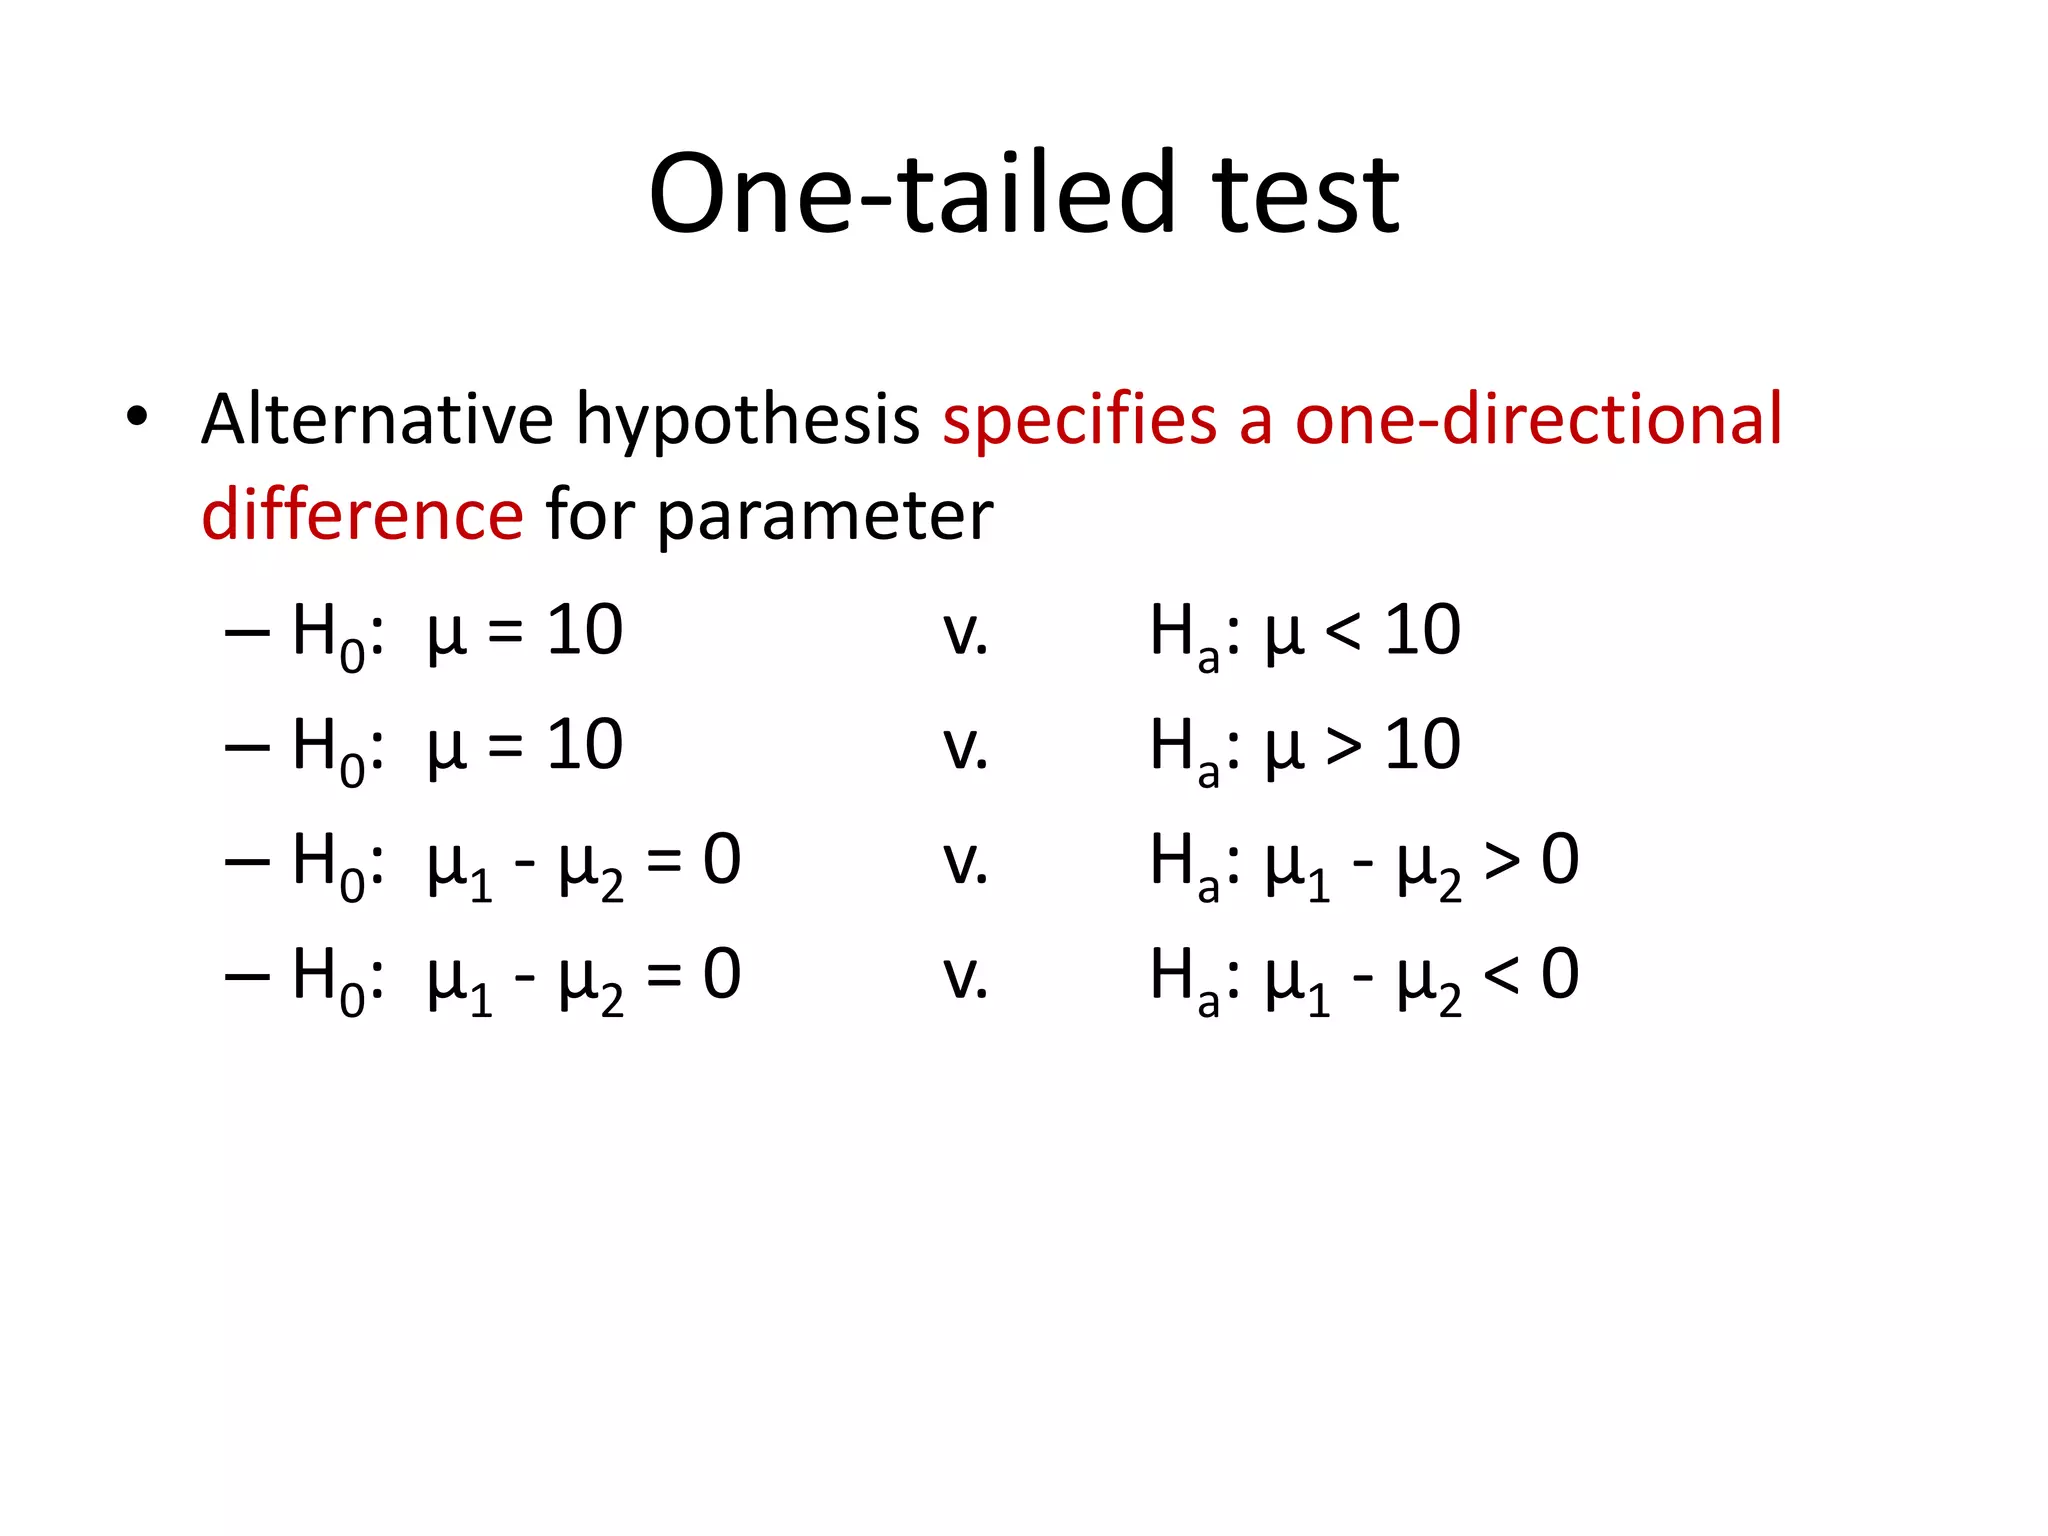
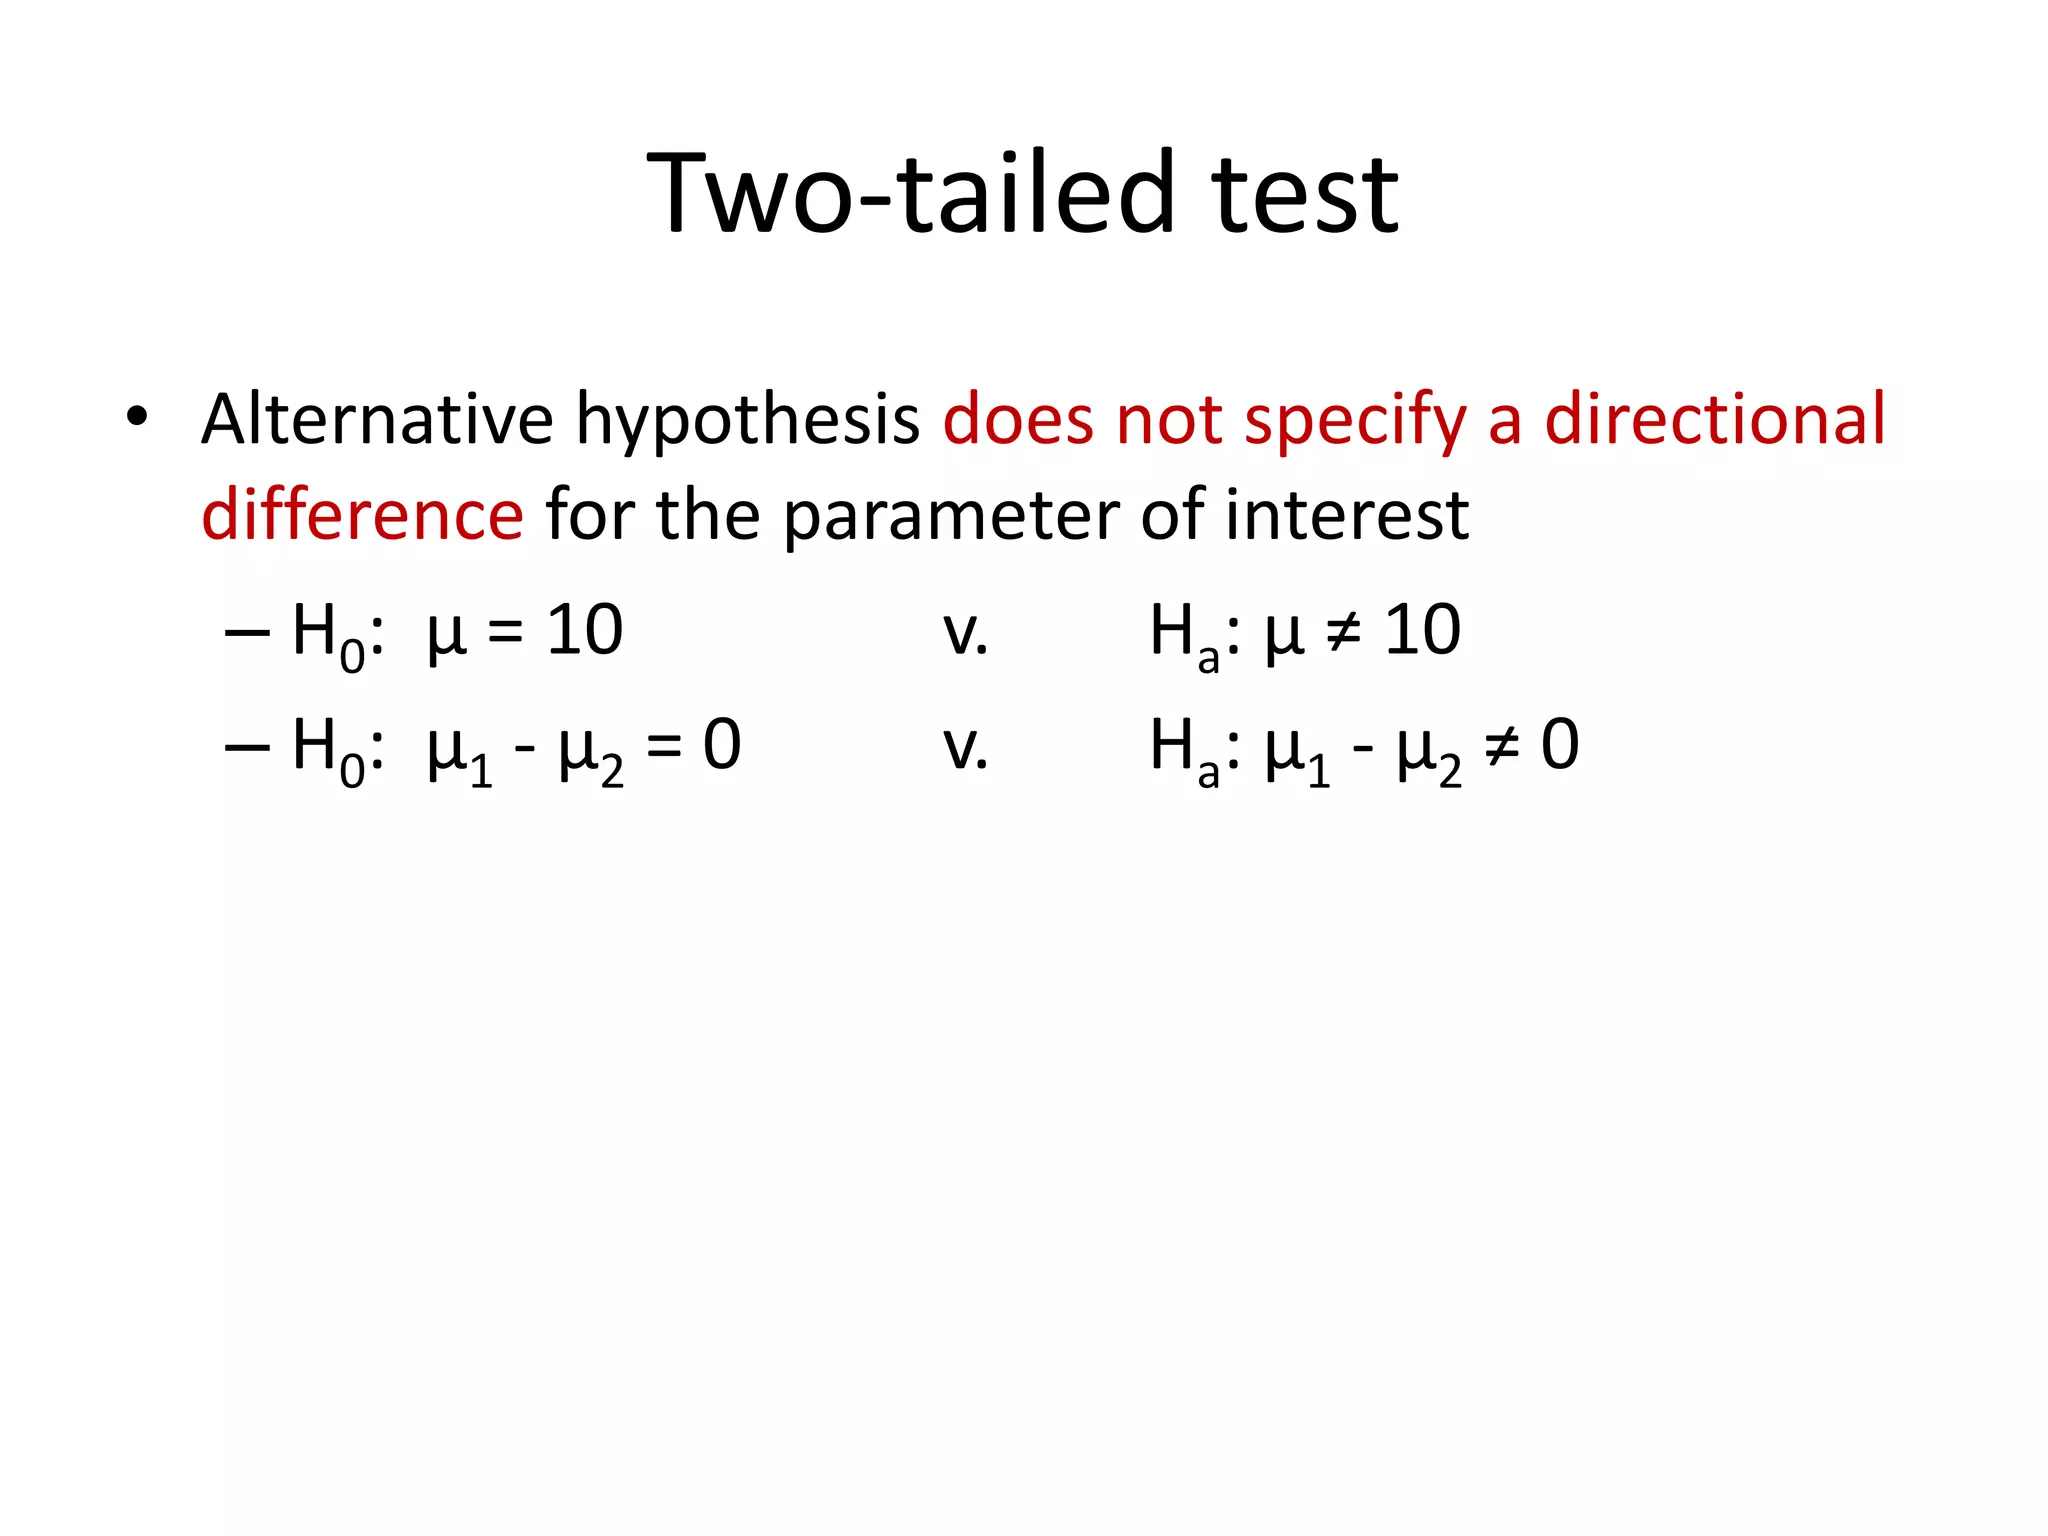
- Whether tests are one-tailed or two-tailed depending on if the alternative hypothesis specifies a directional difference.
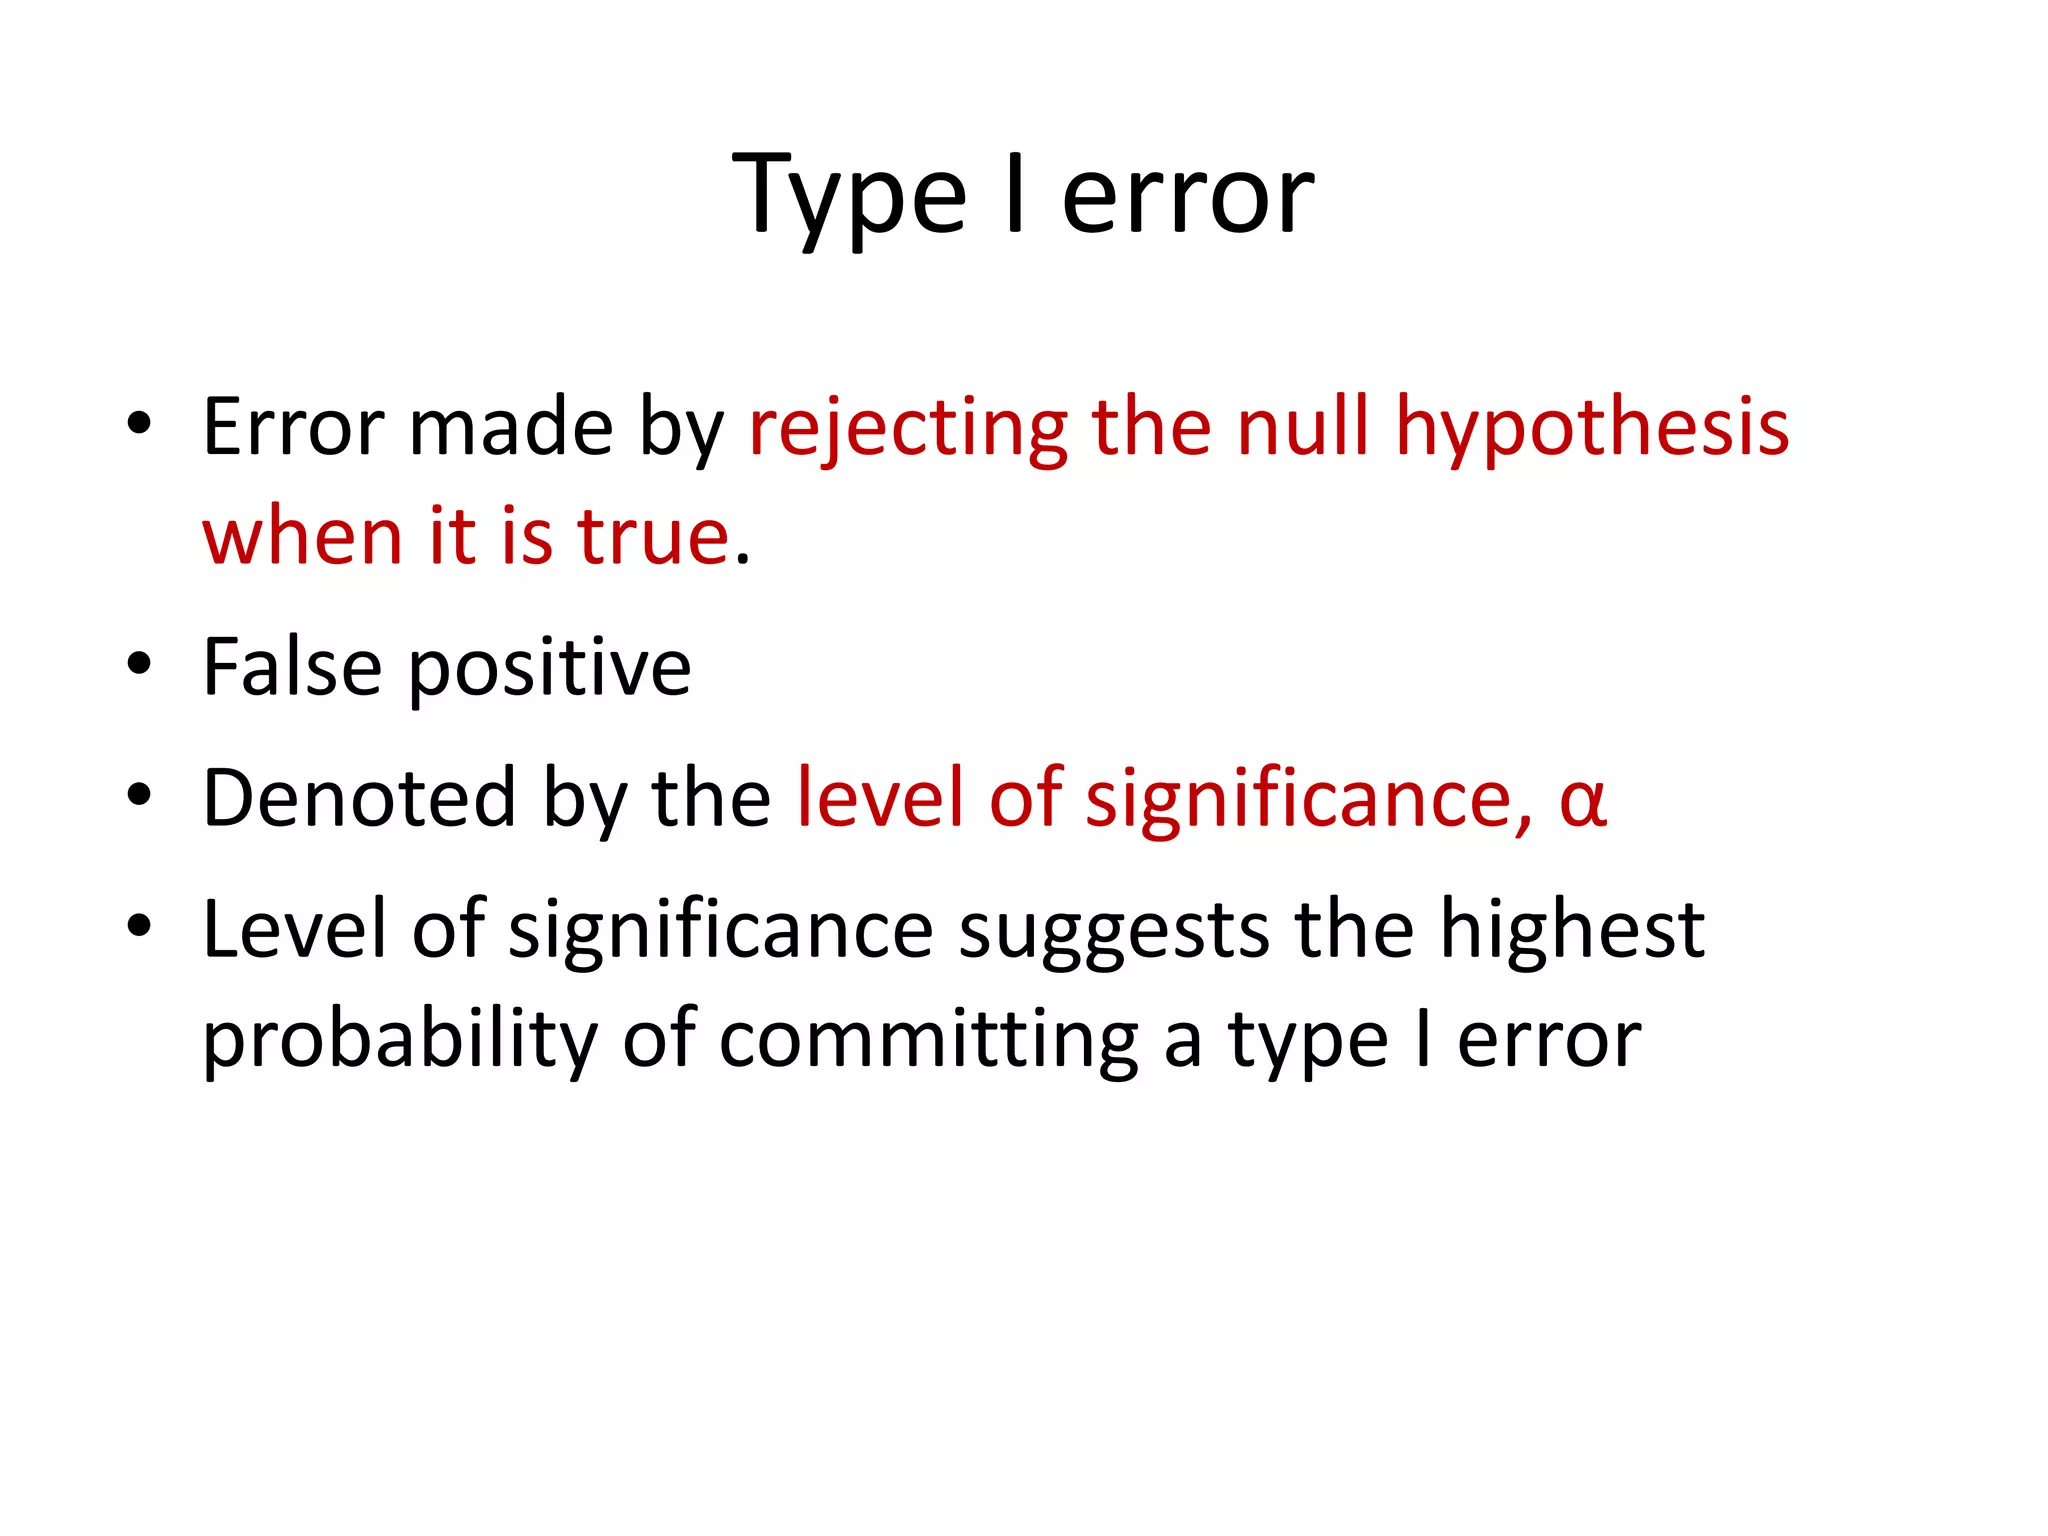
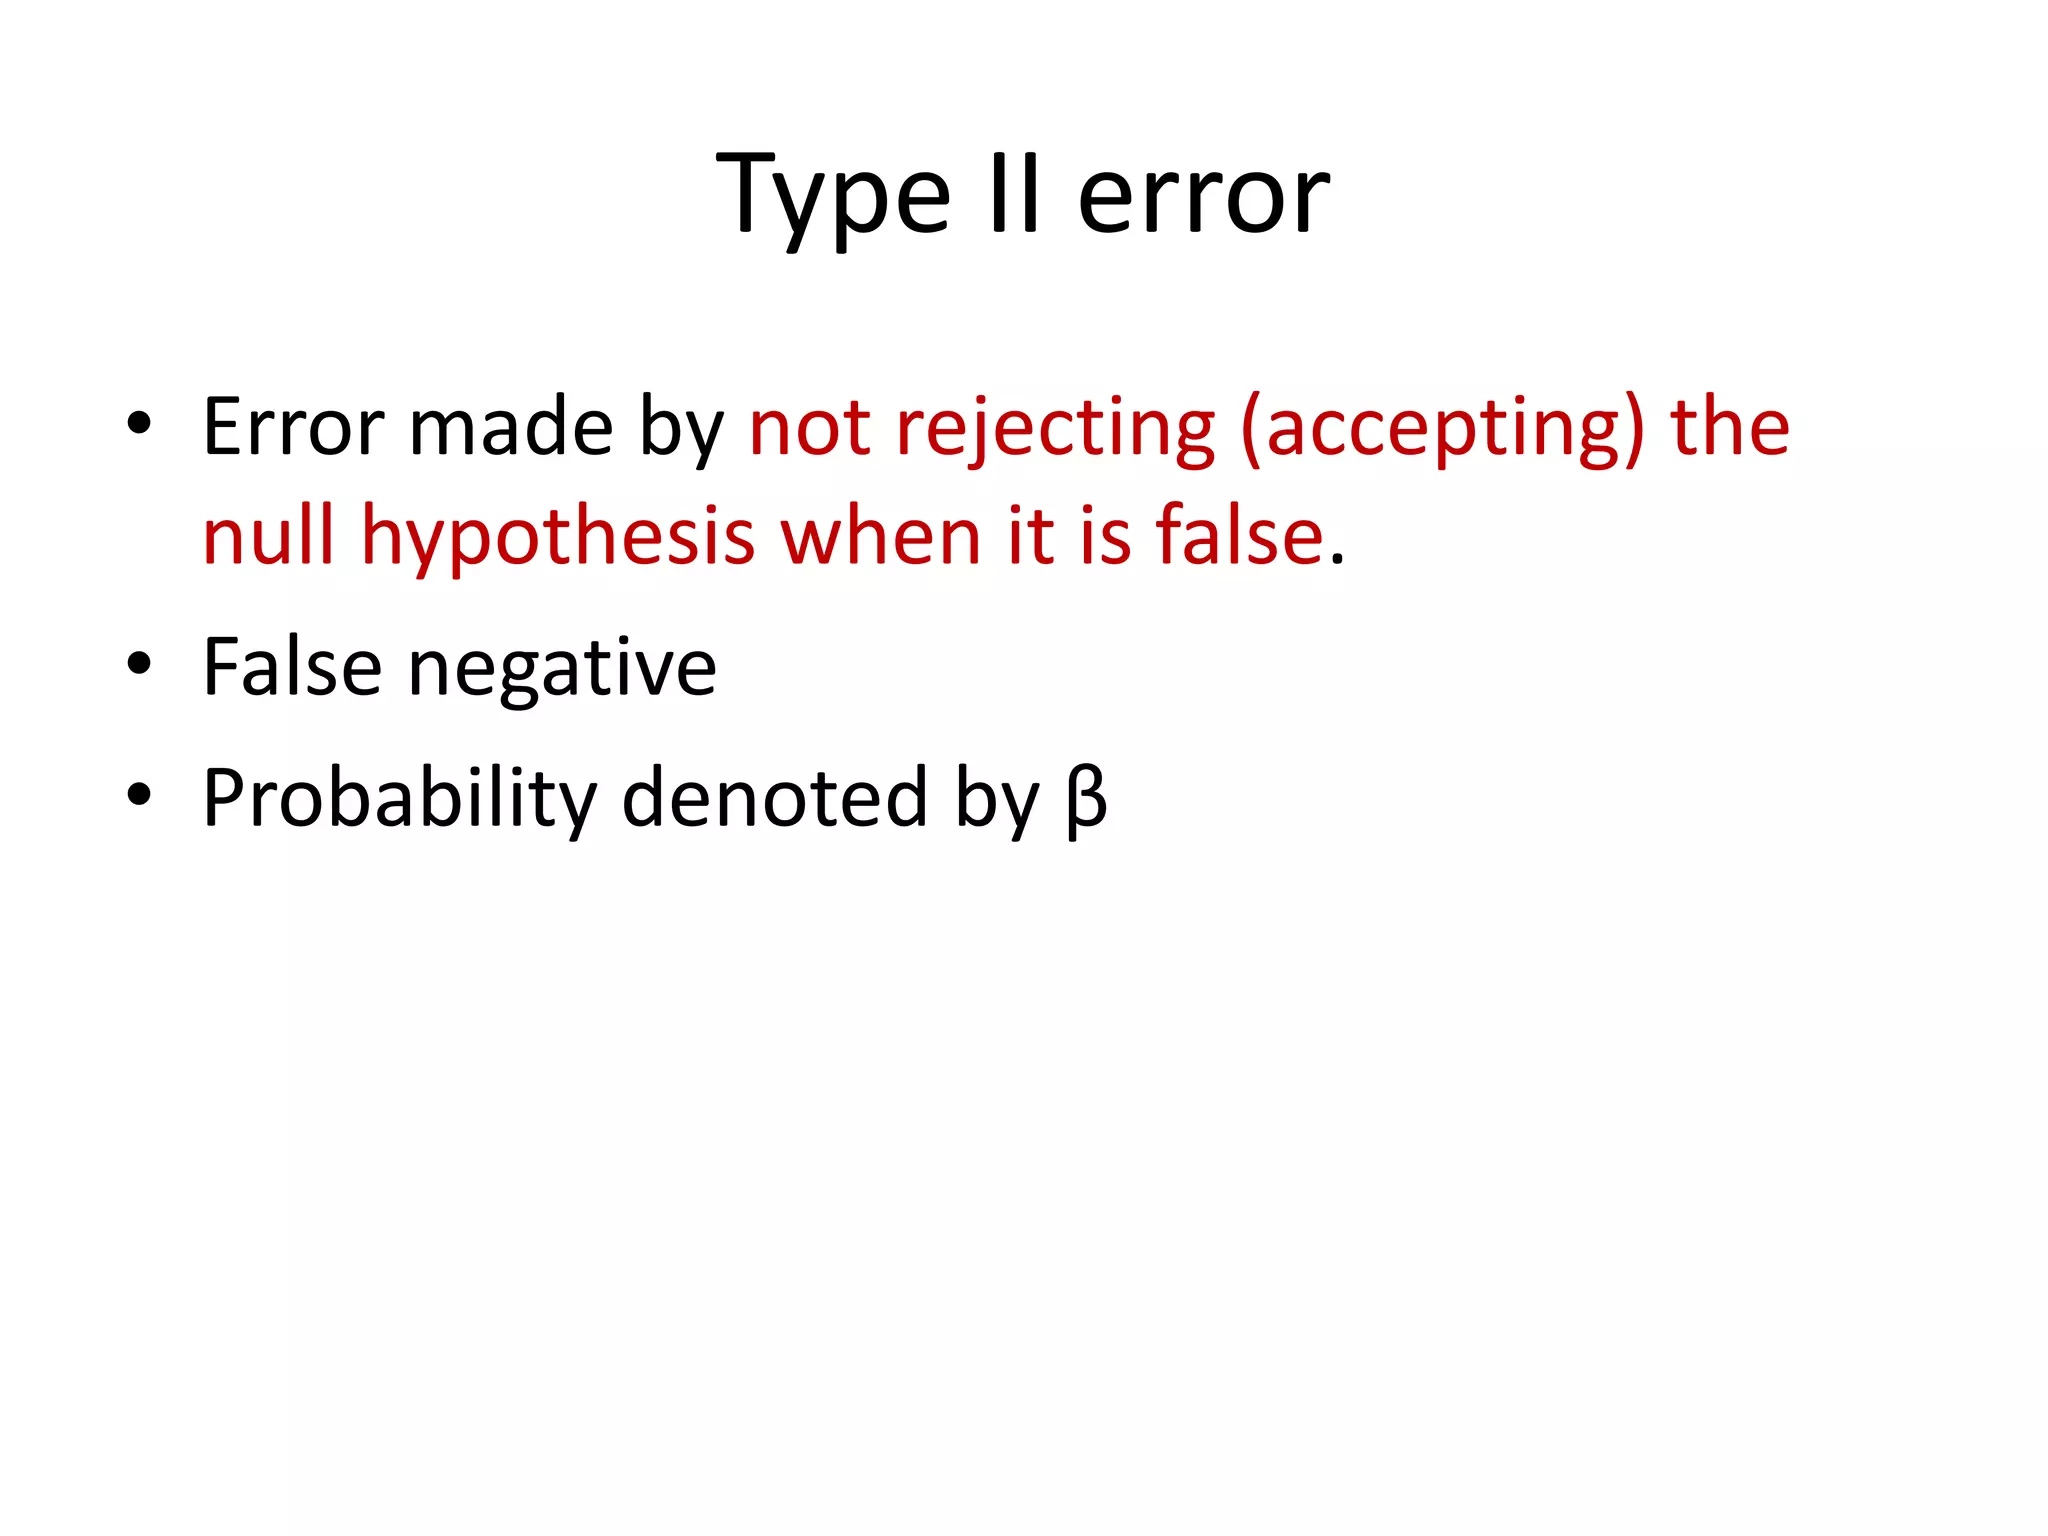
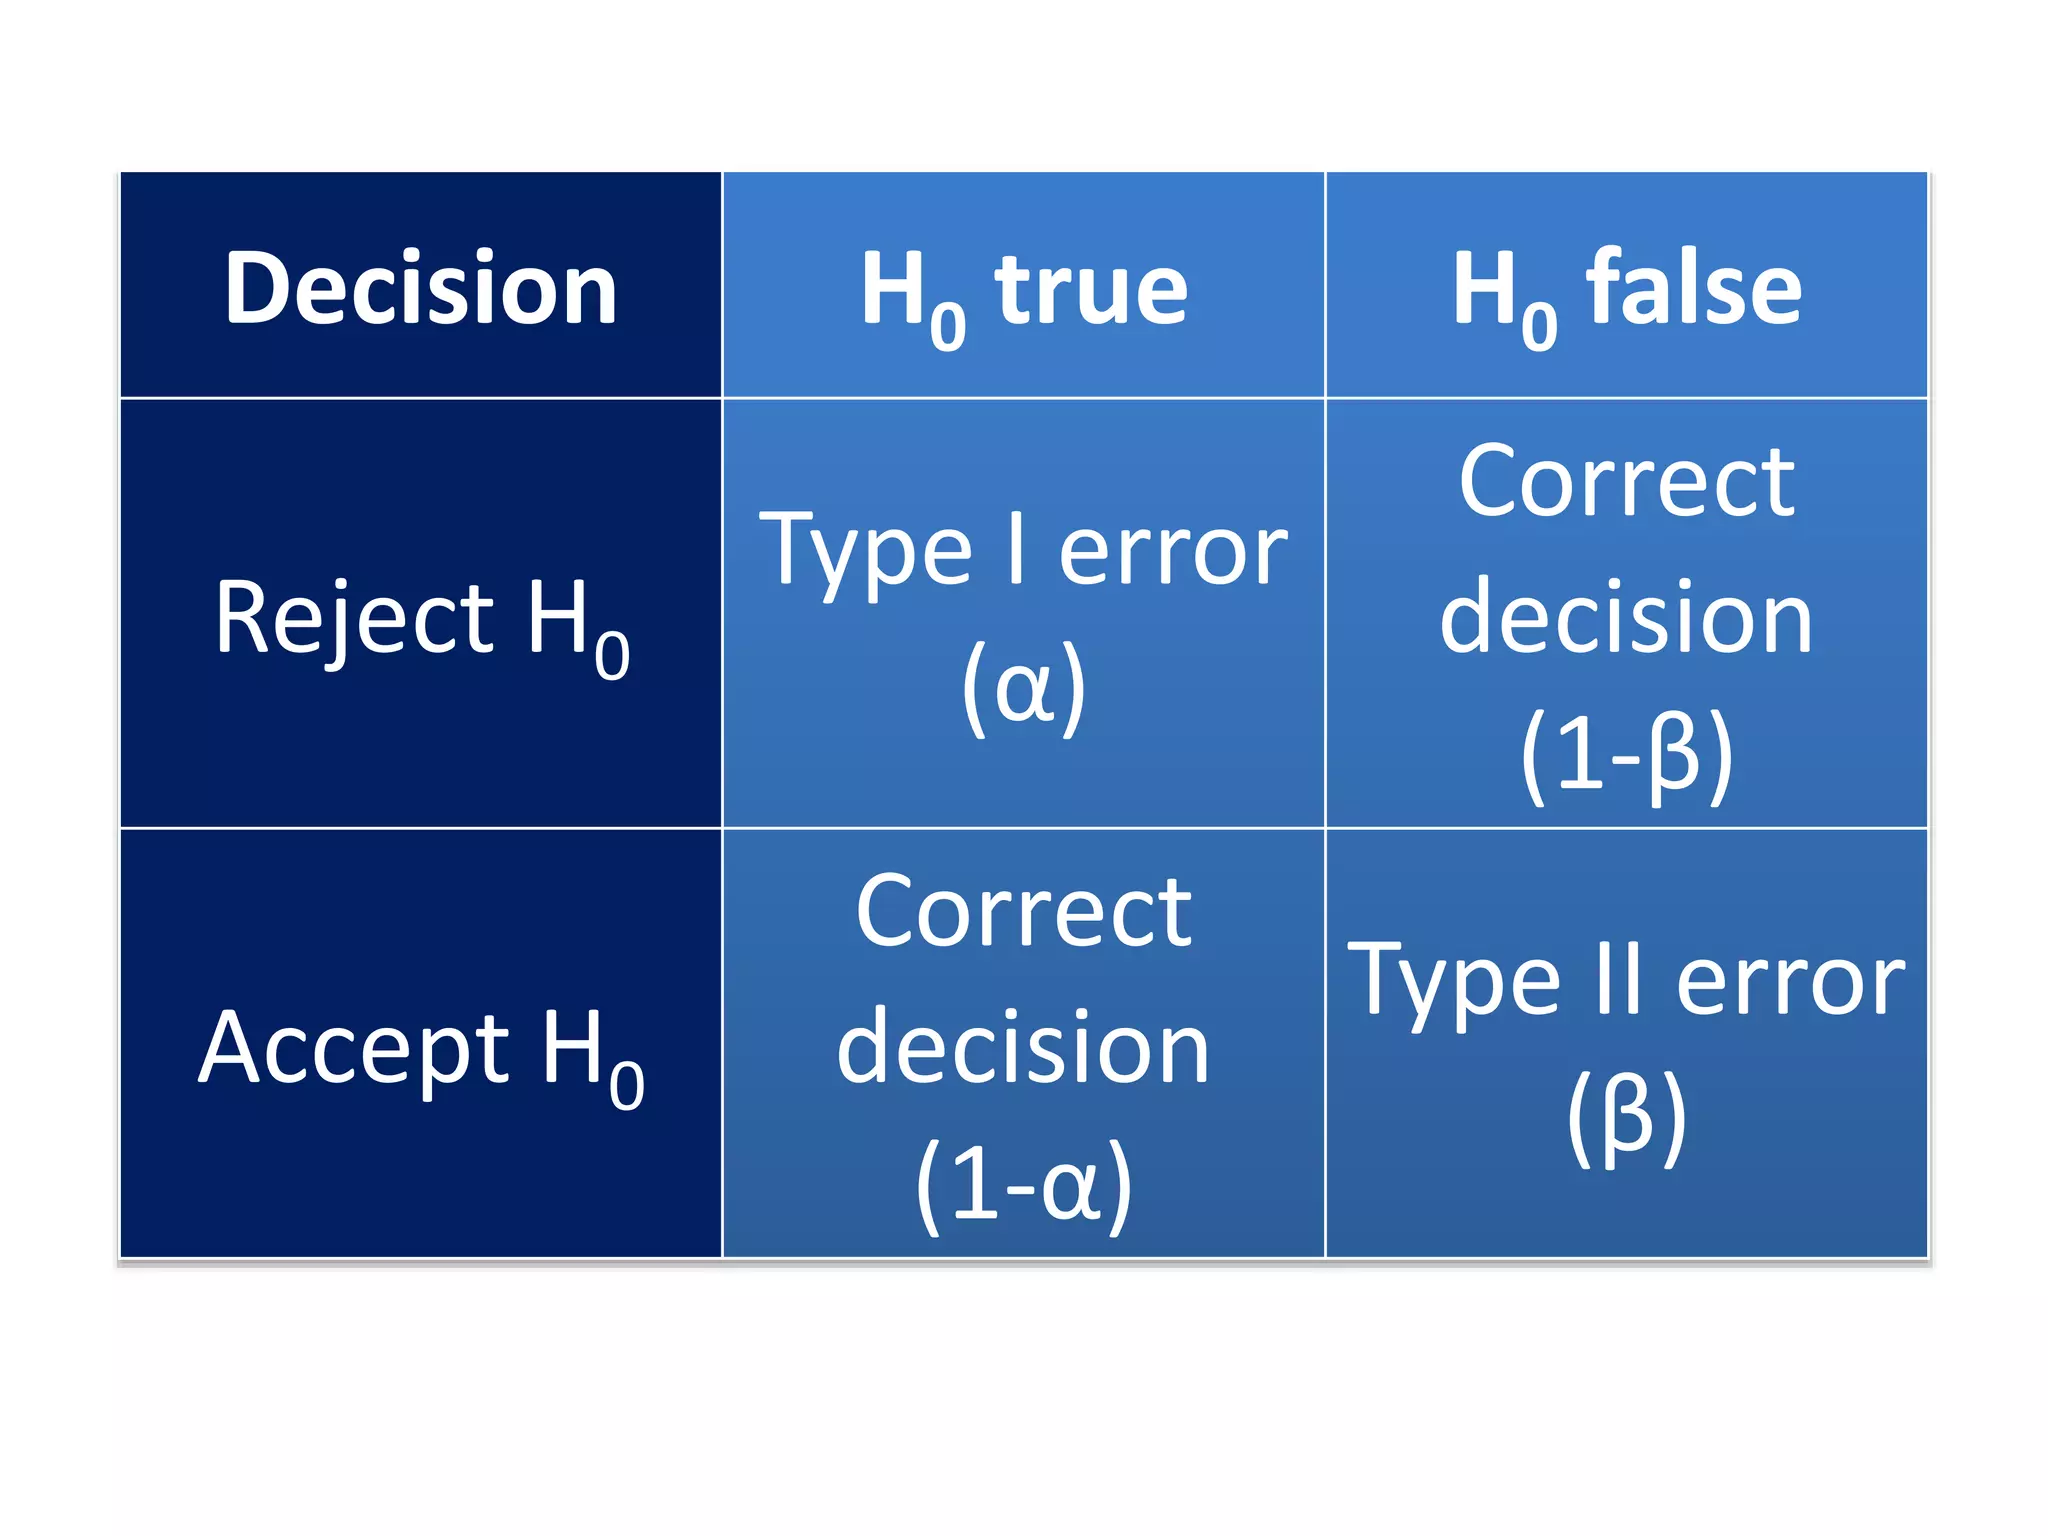
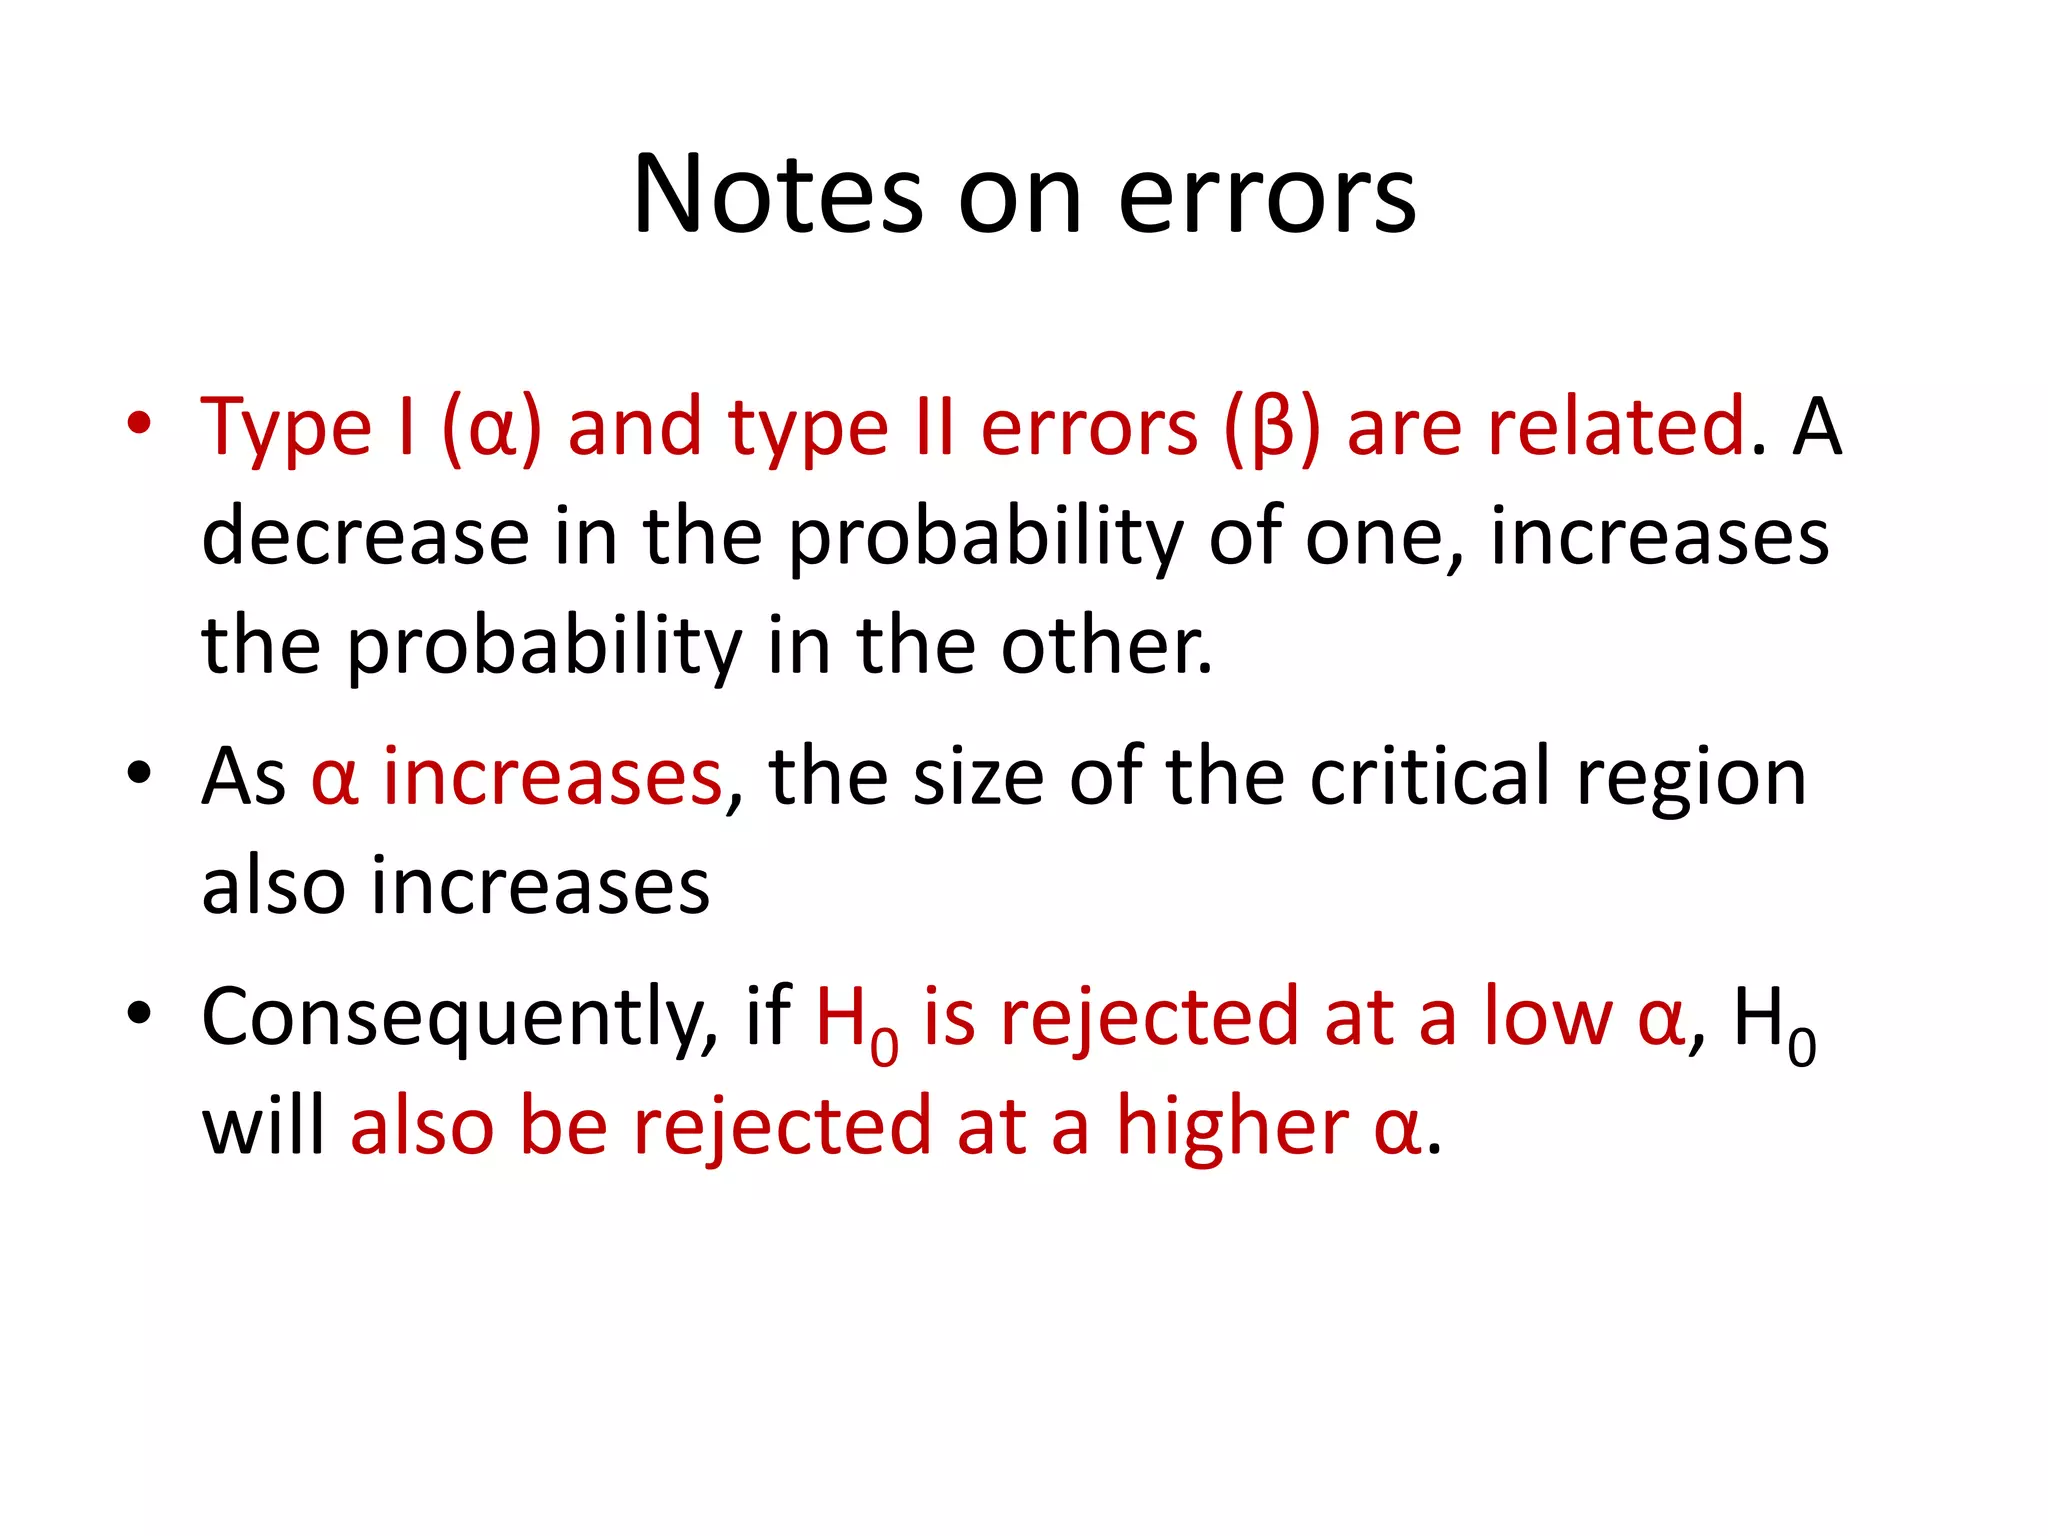
- Type I and Type II errors, with Type I errors occurring when the null hypothesis is incorrectly rejected and Type II errors occurring when it is incorrectly accepted.