Downloaded 423 times
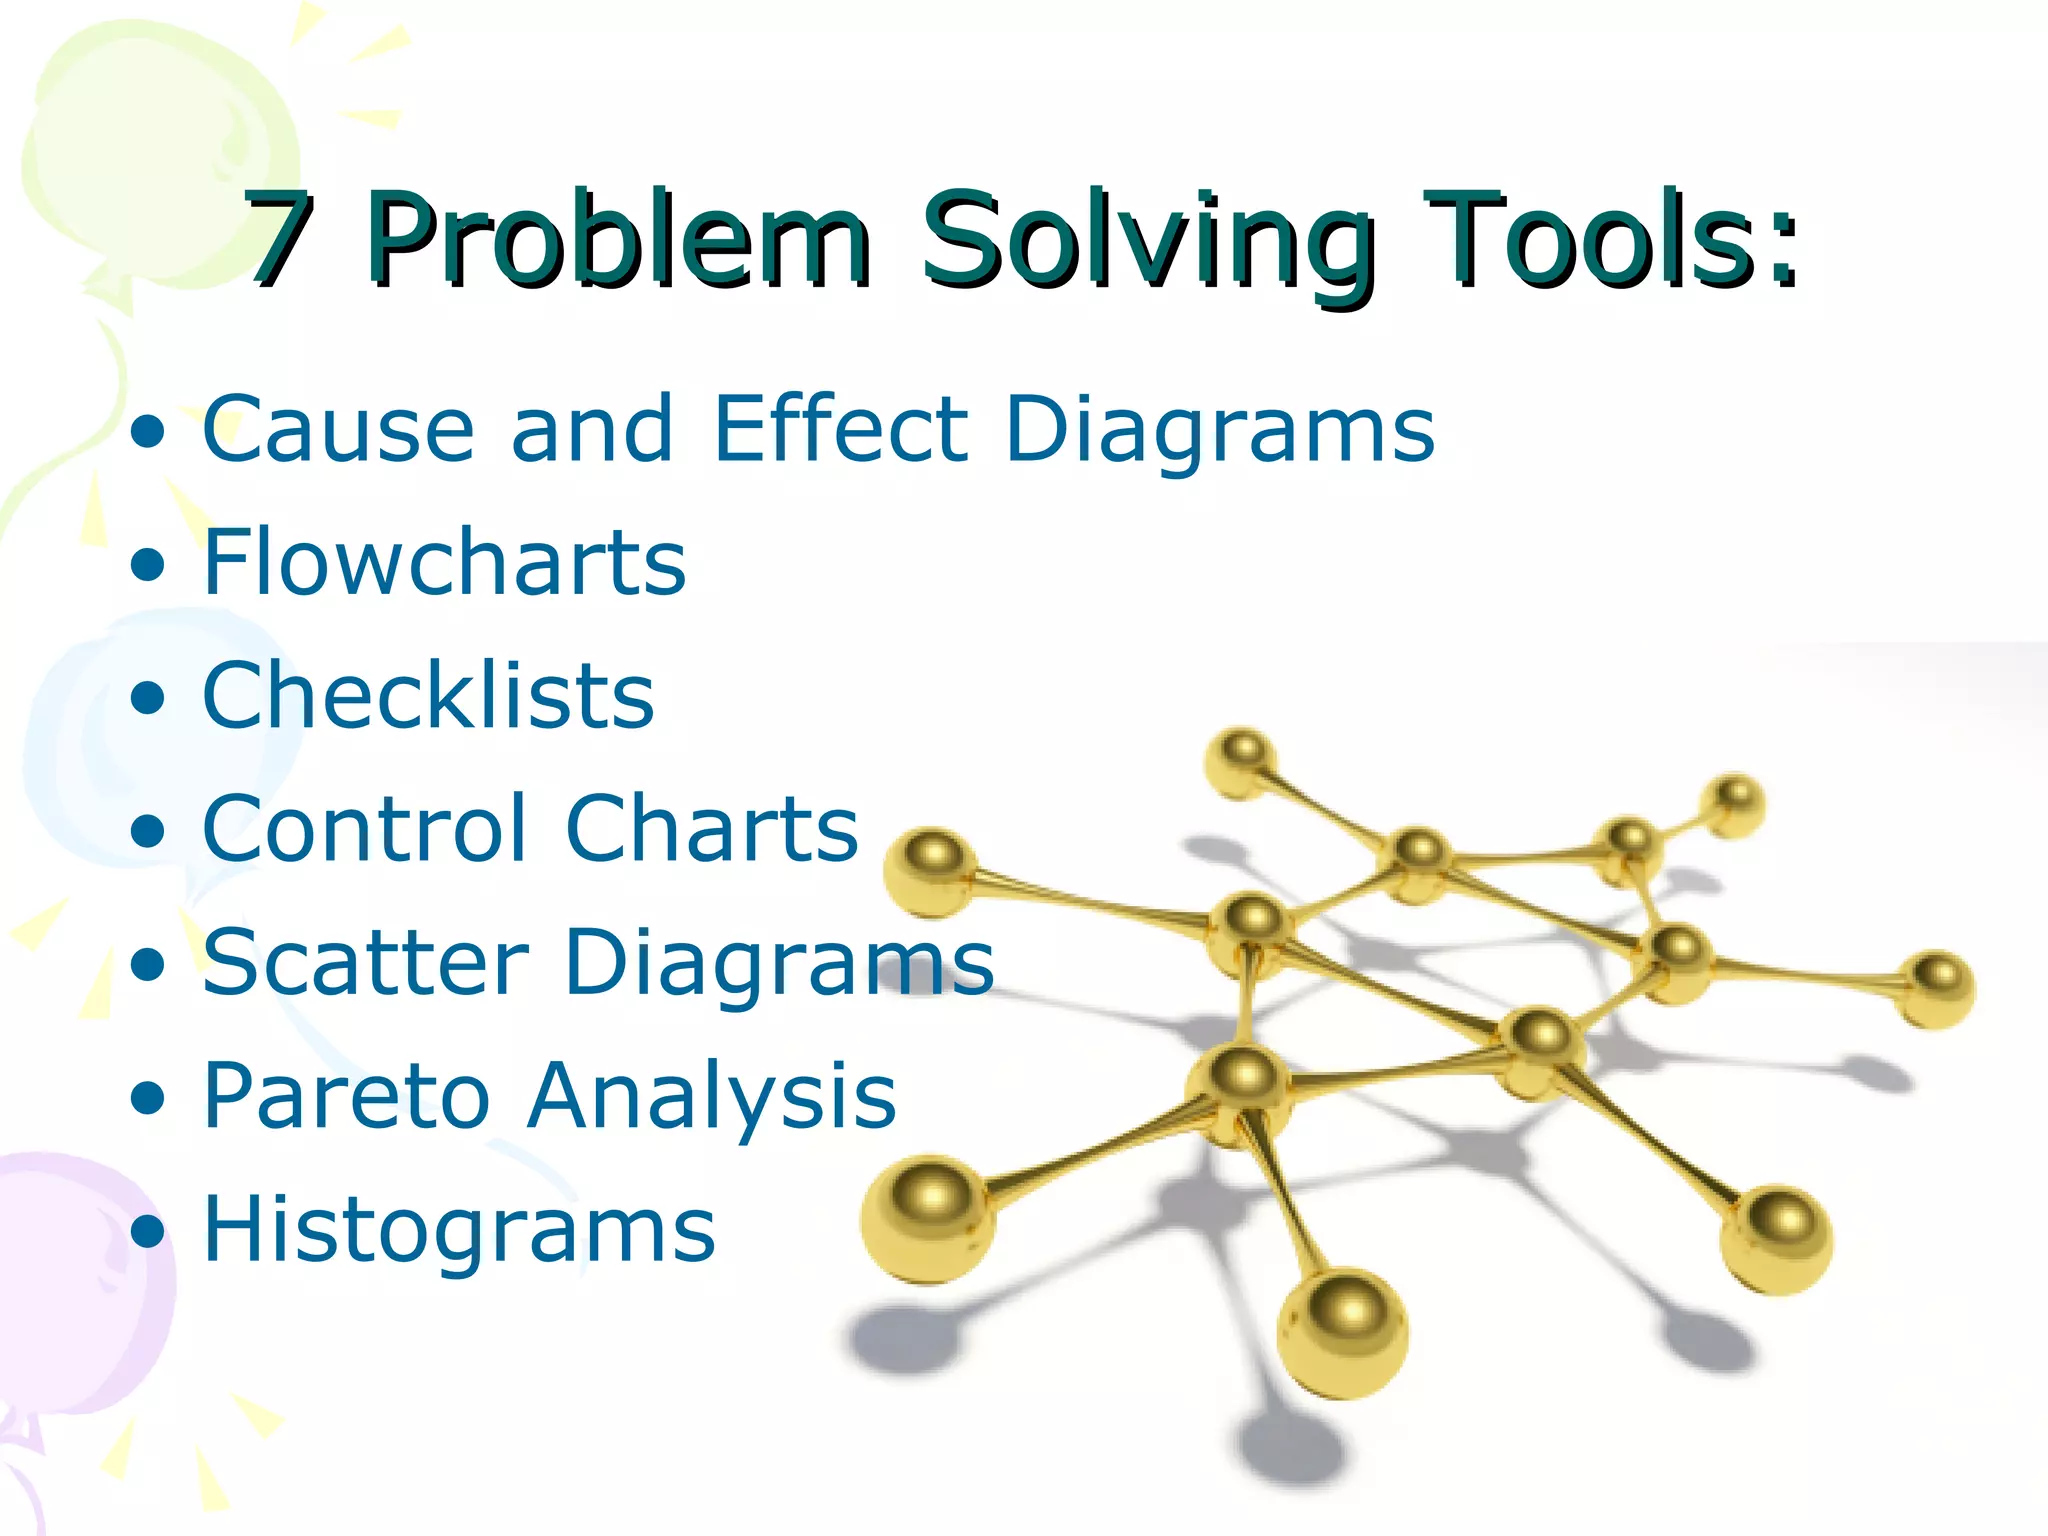
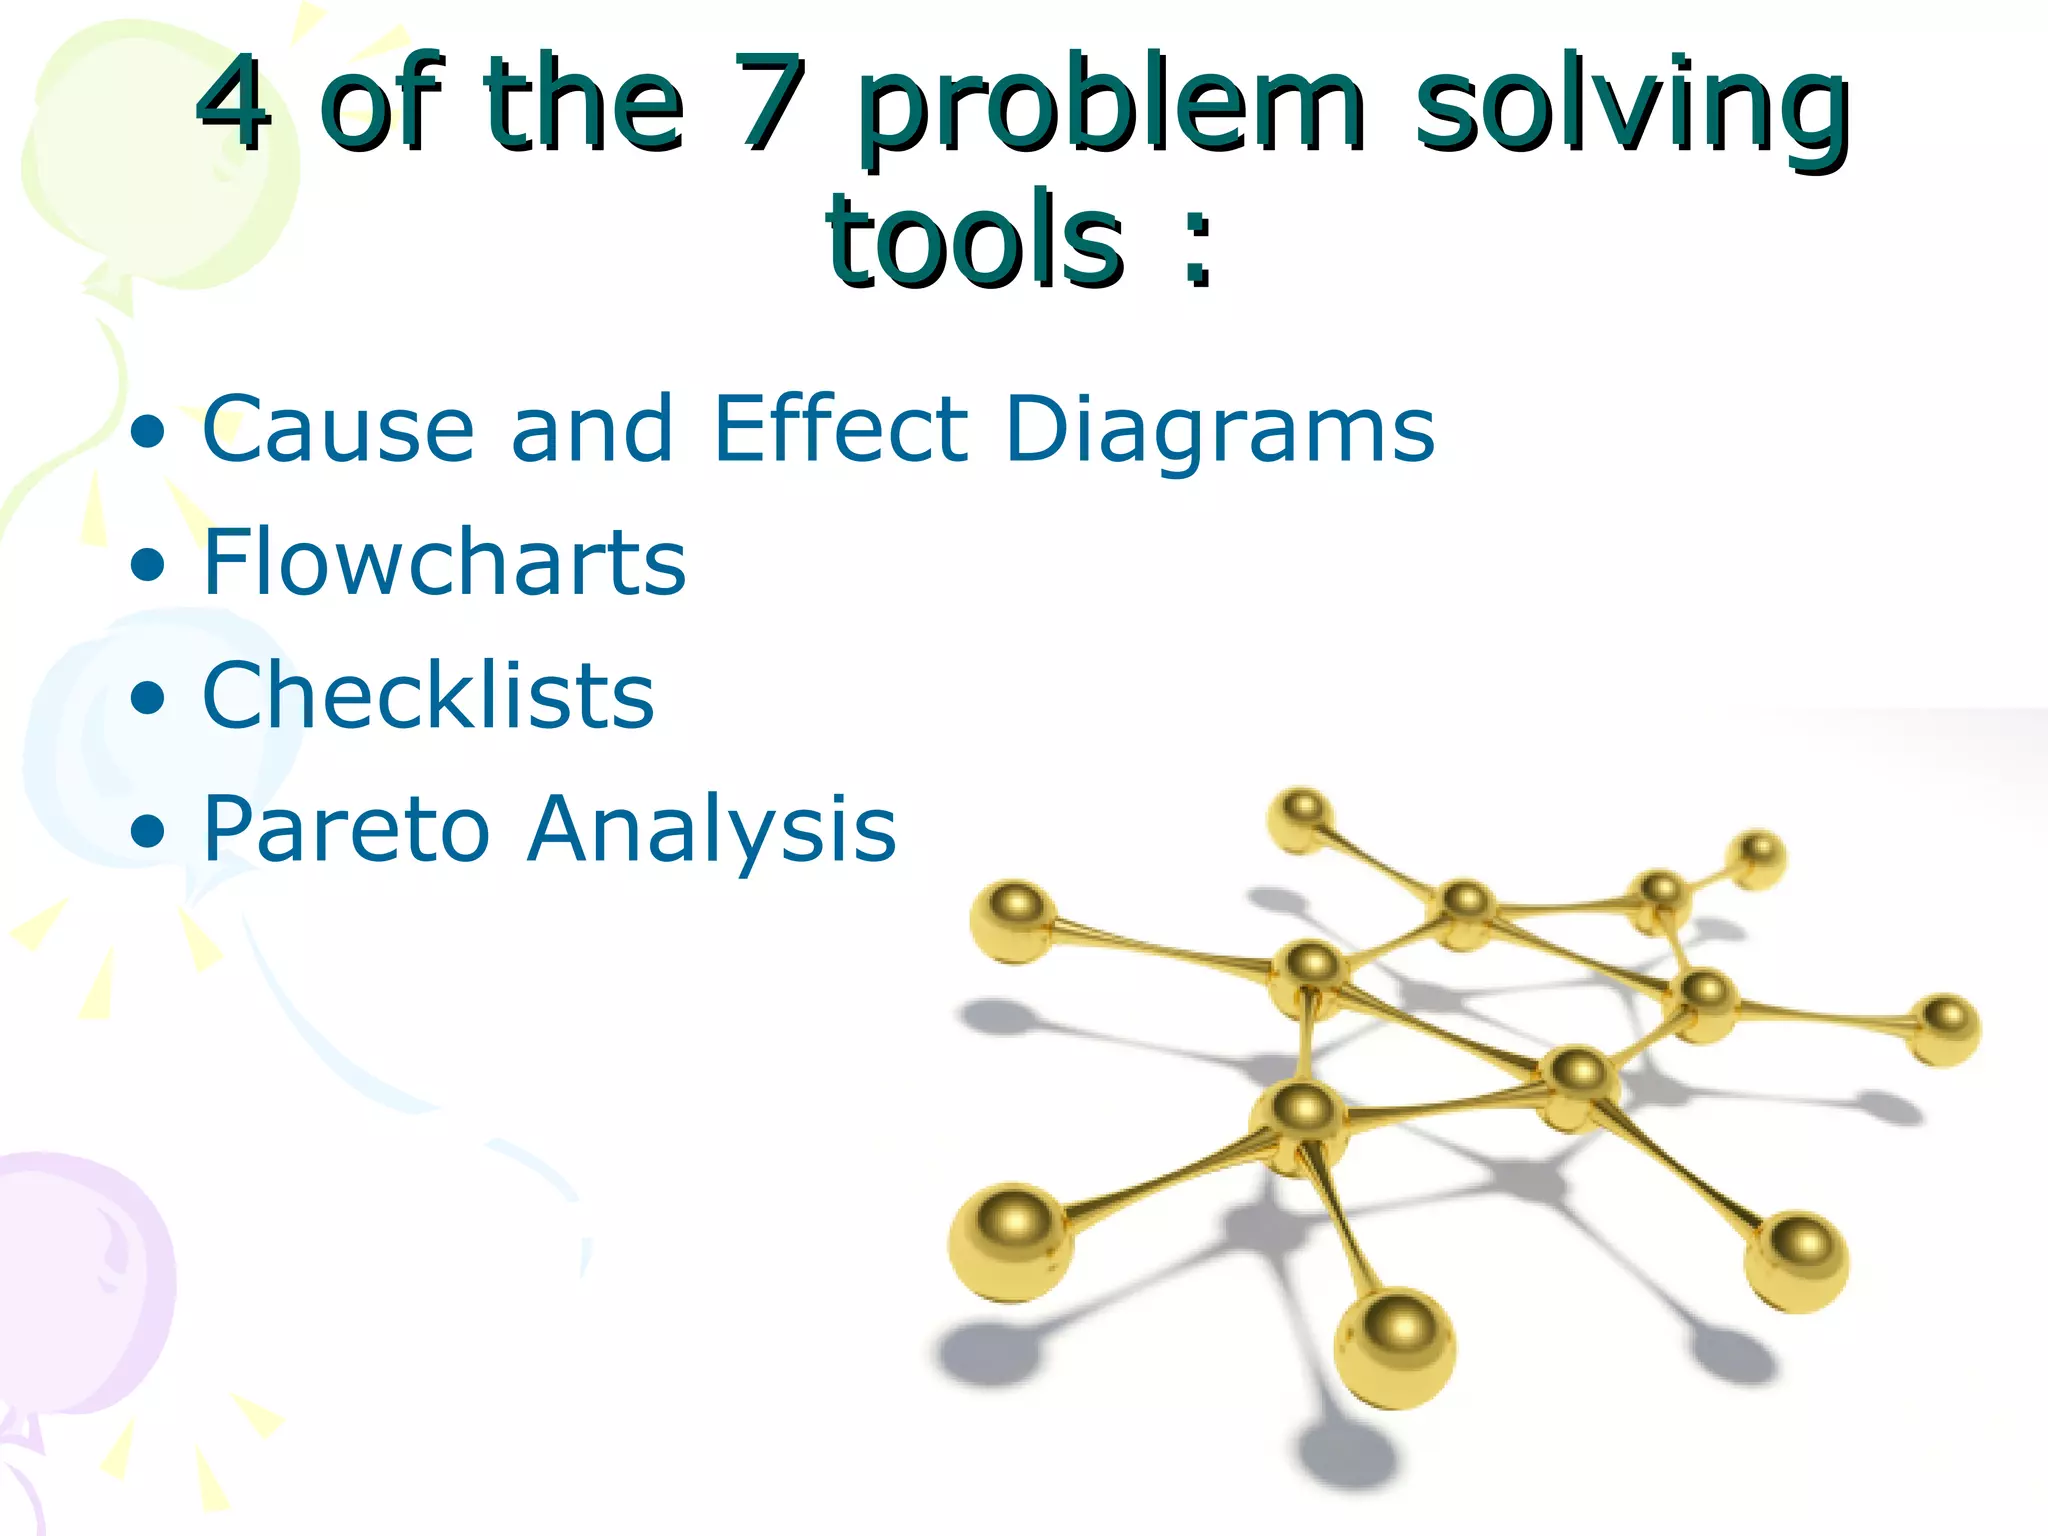
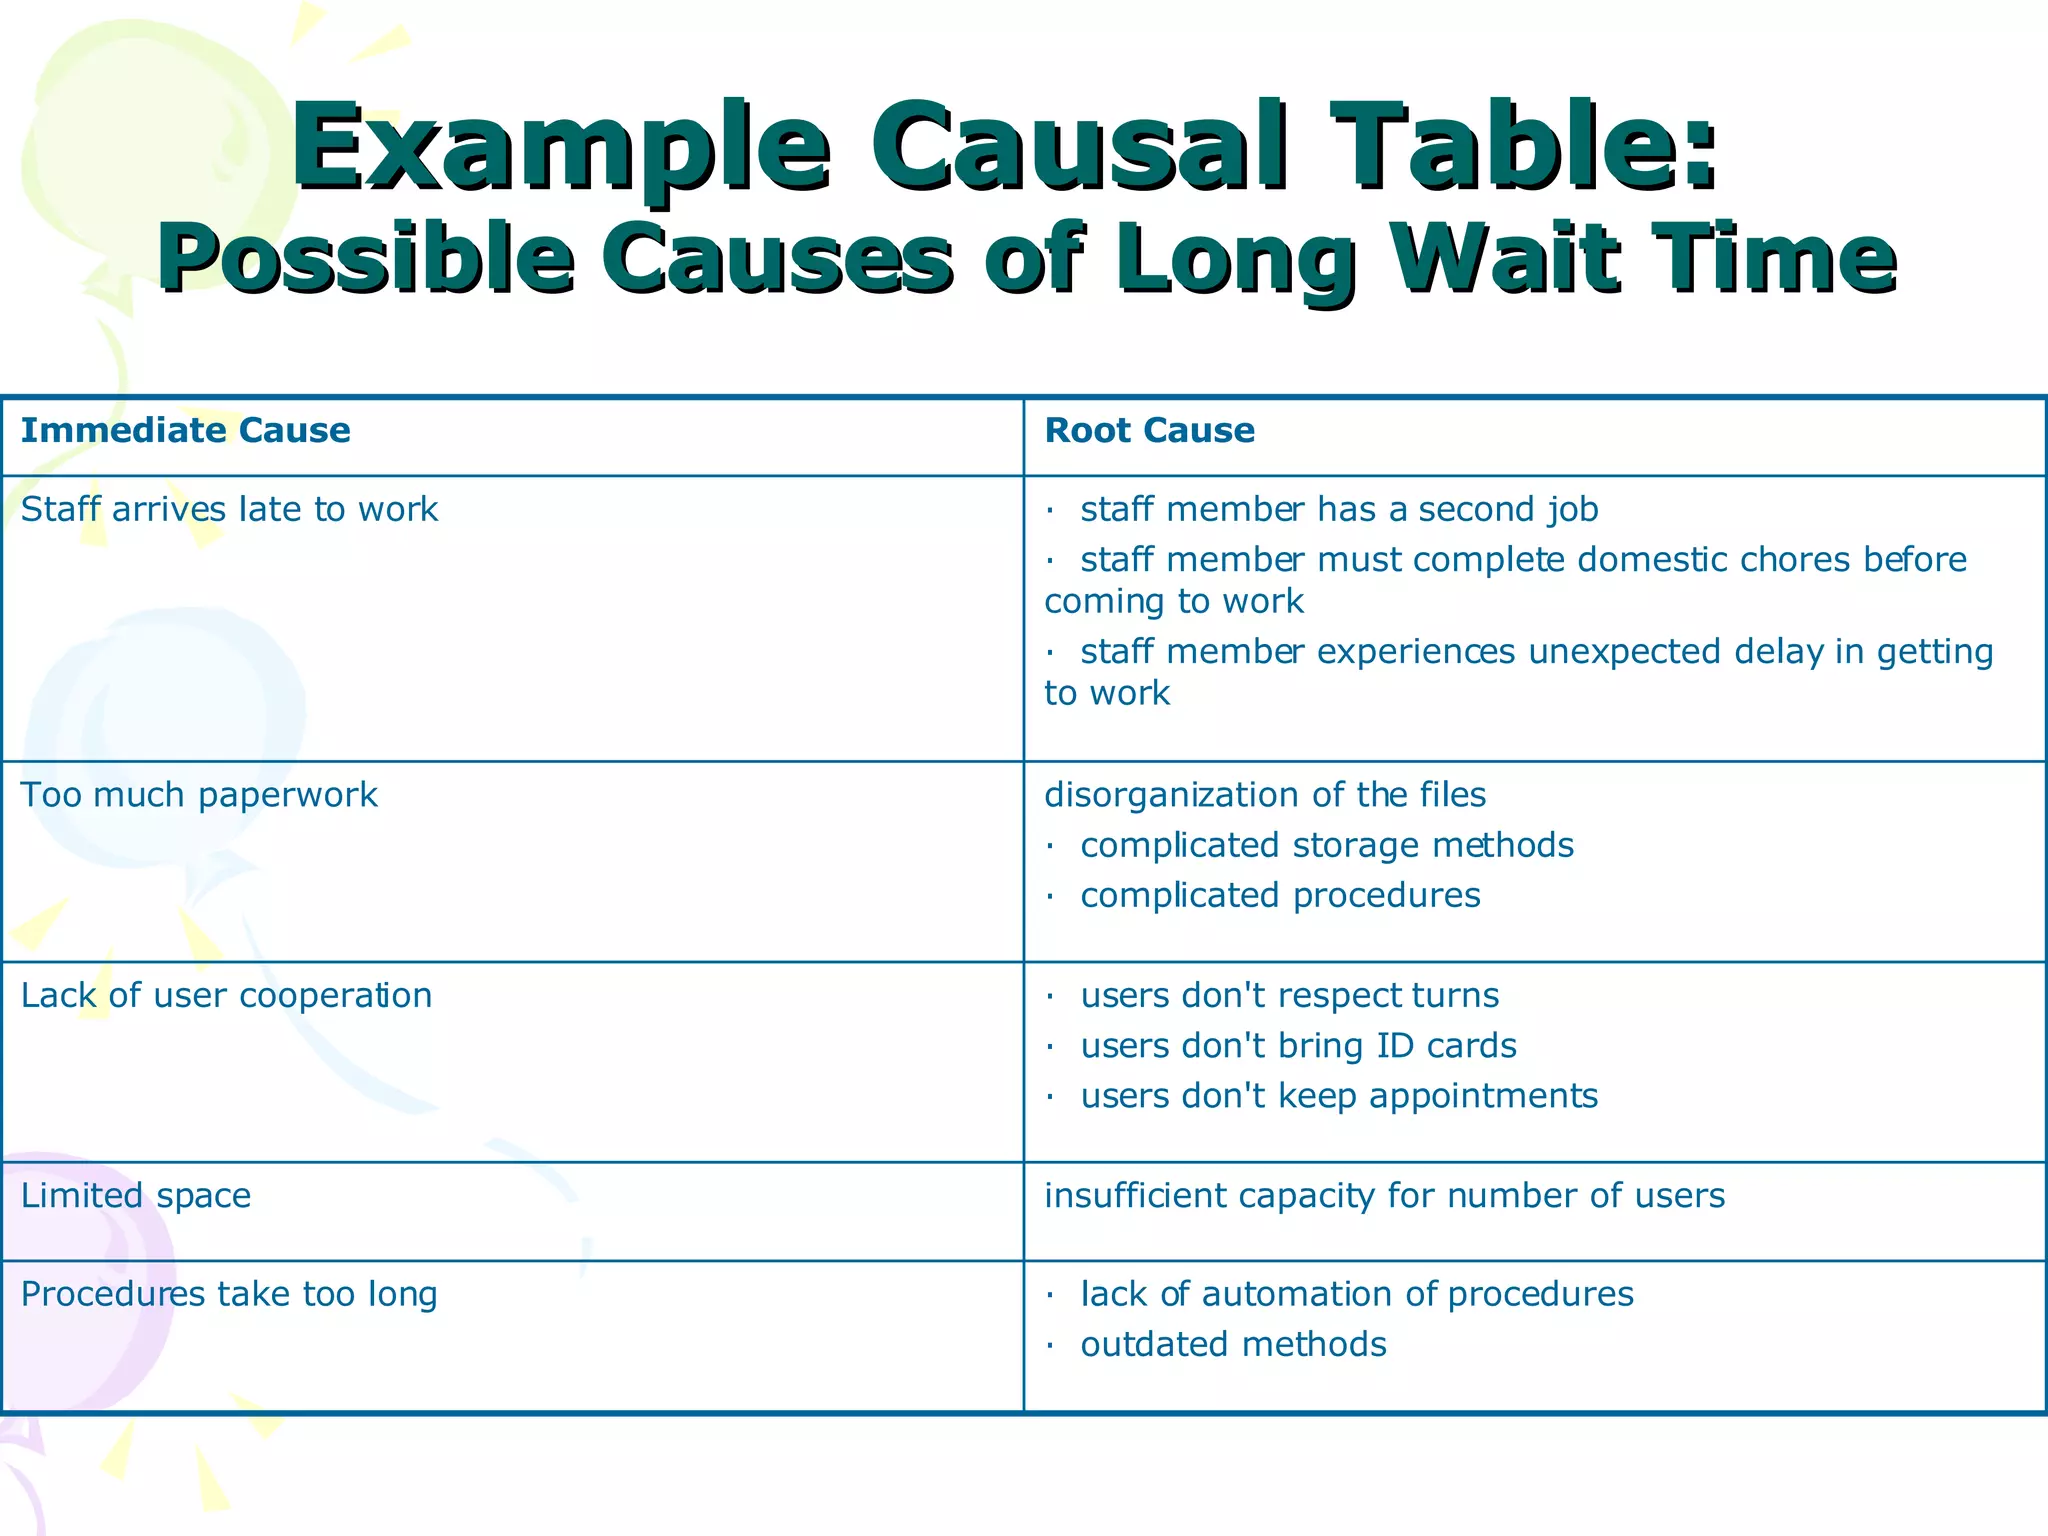
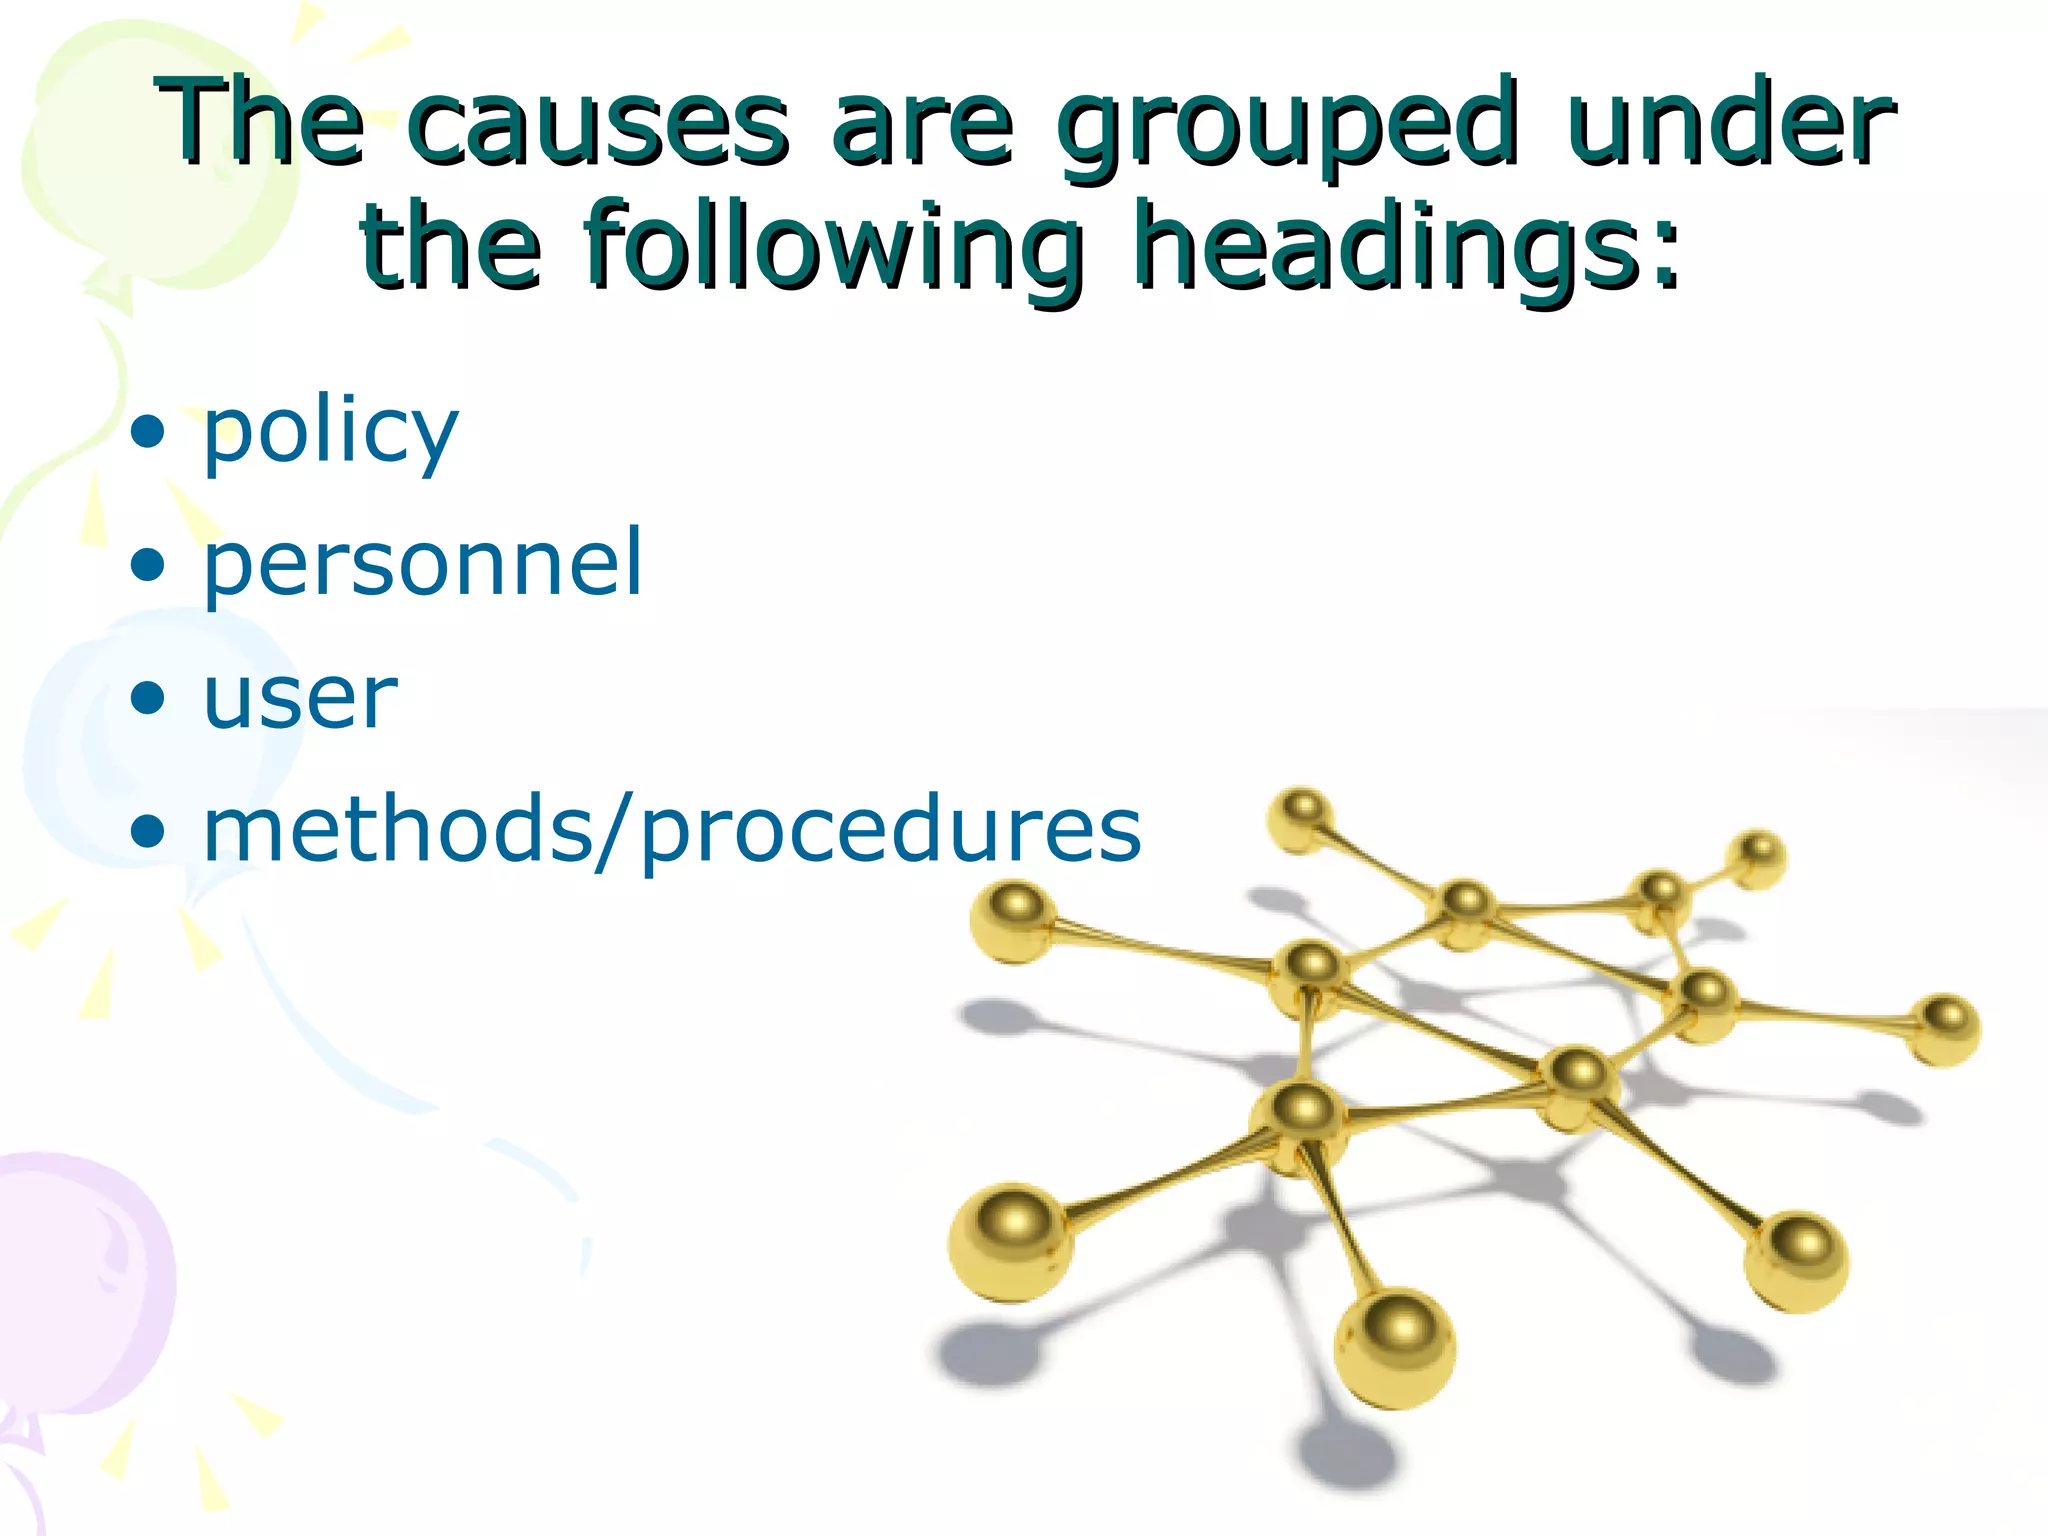
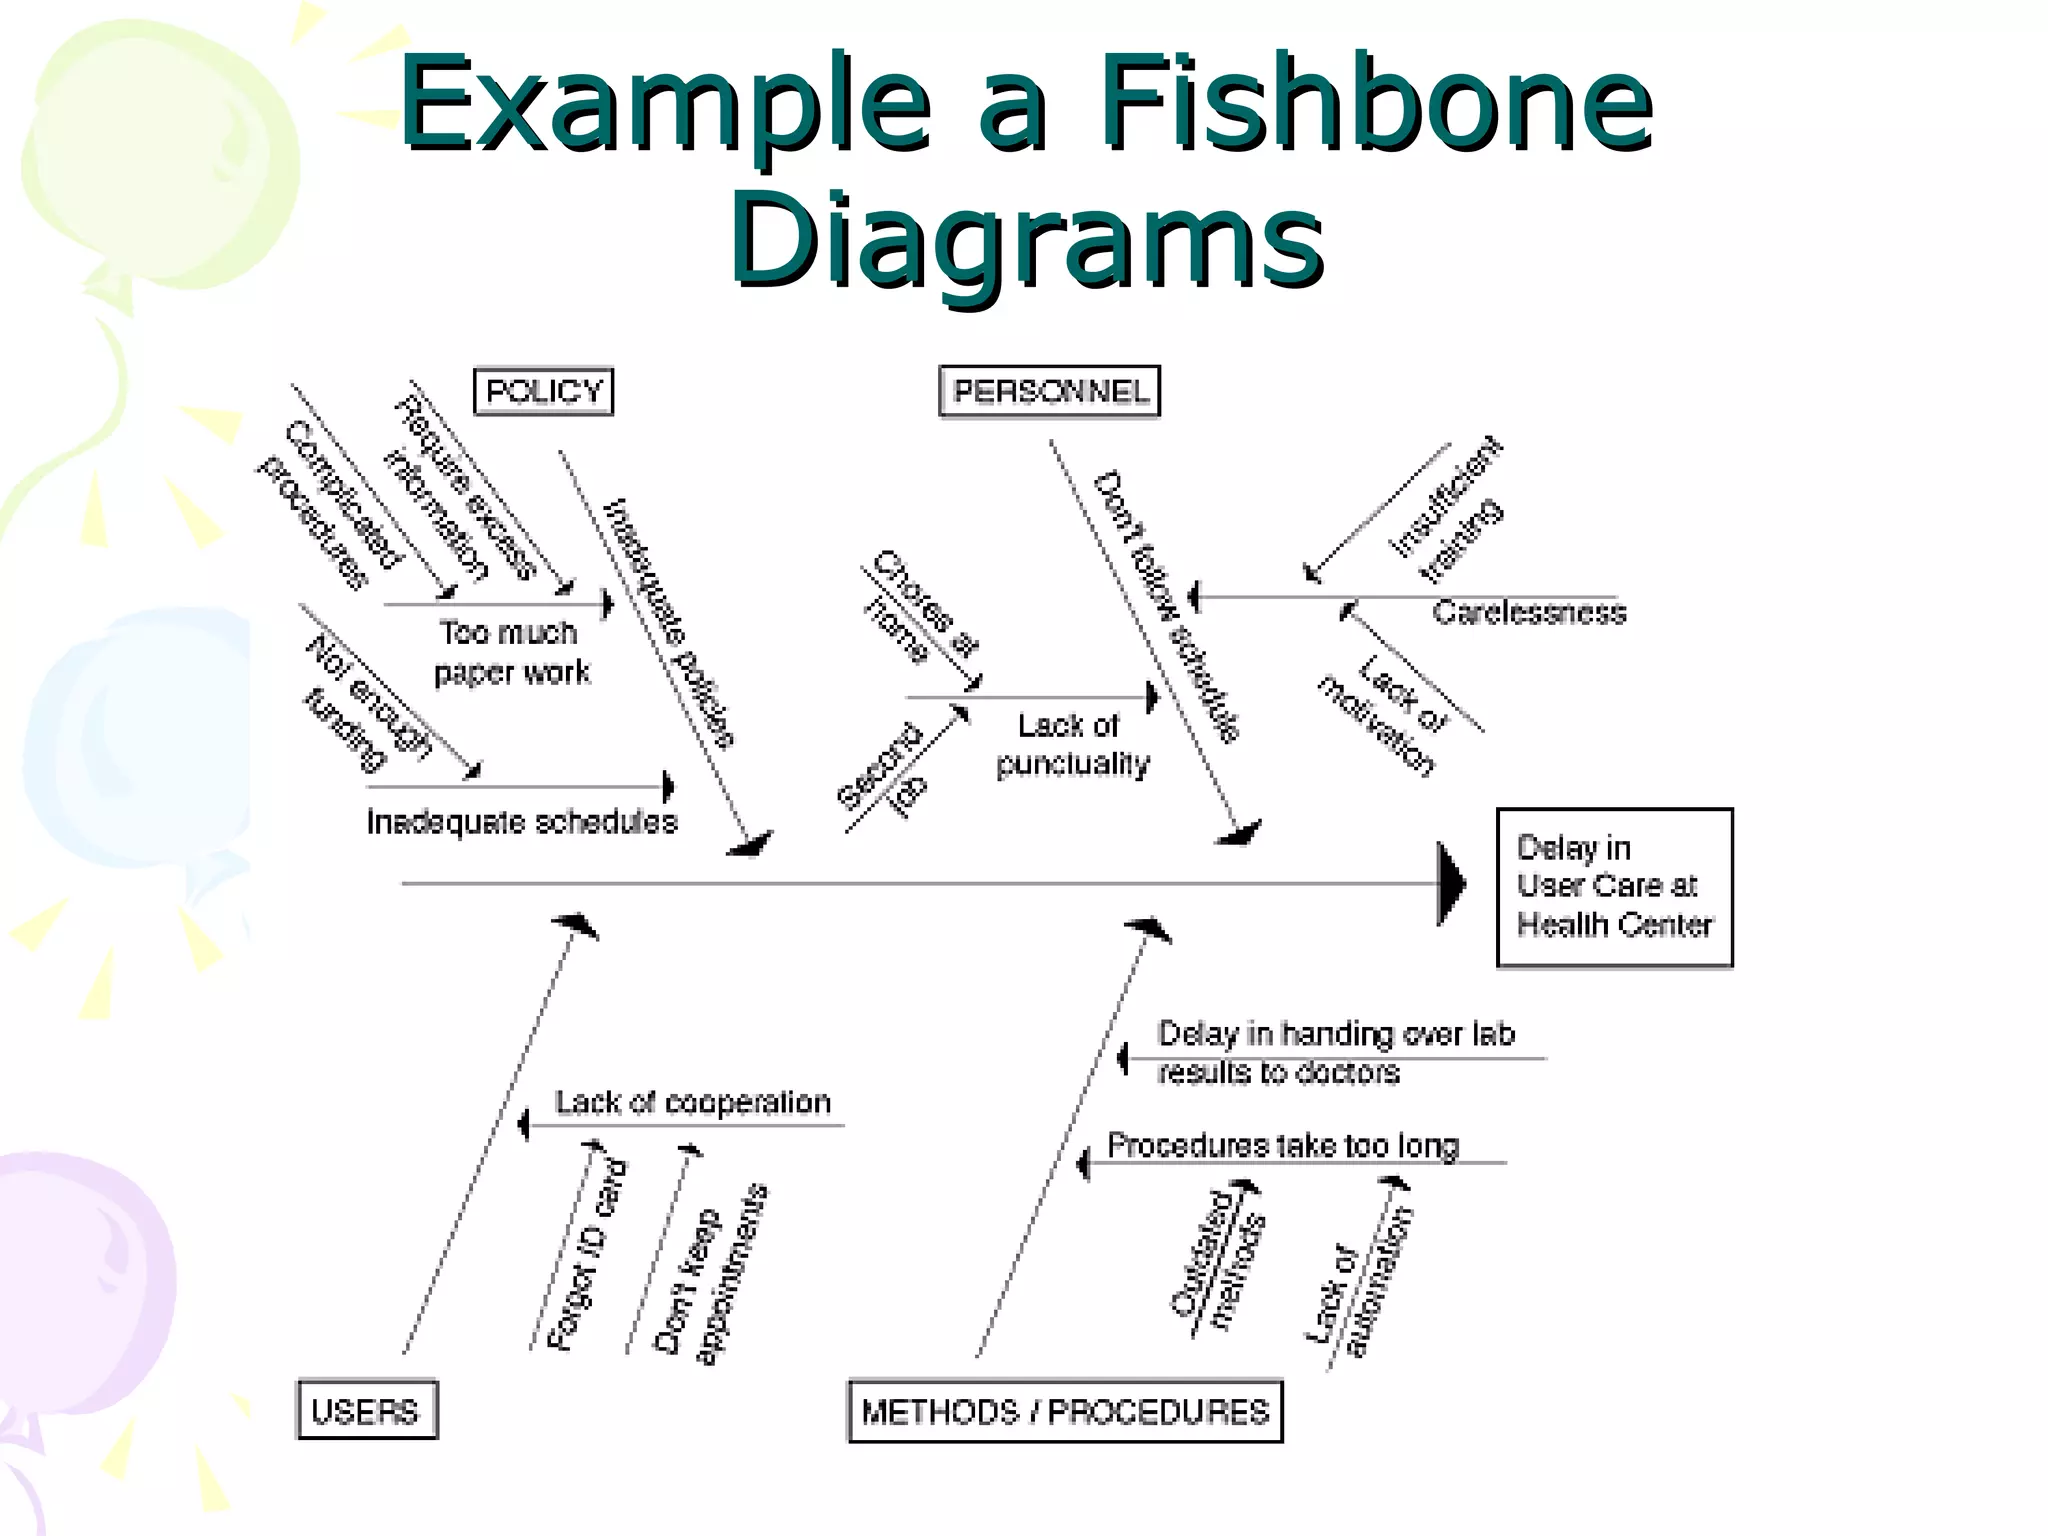
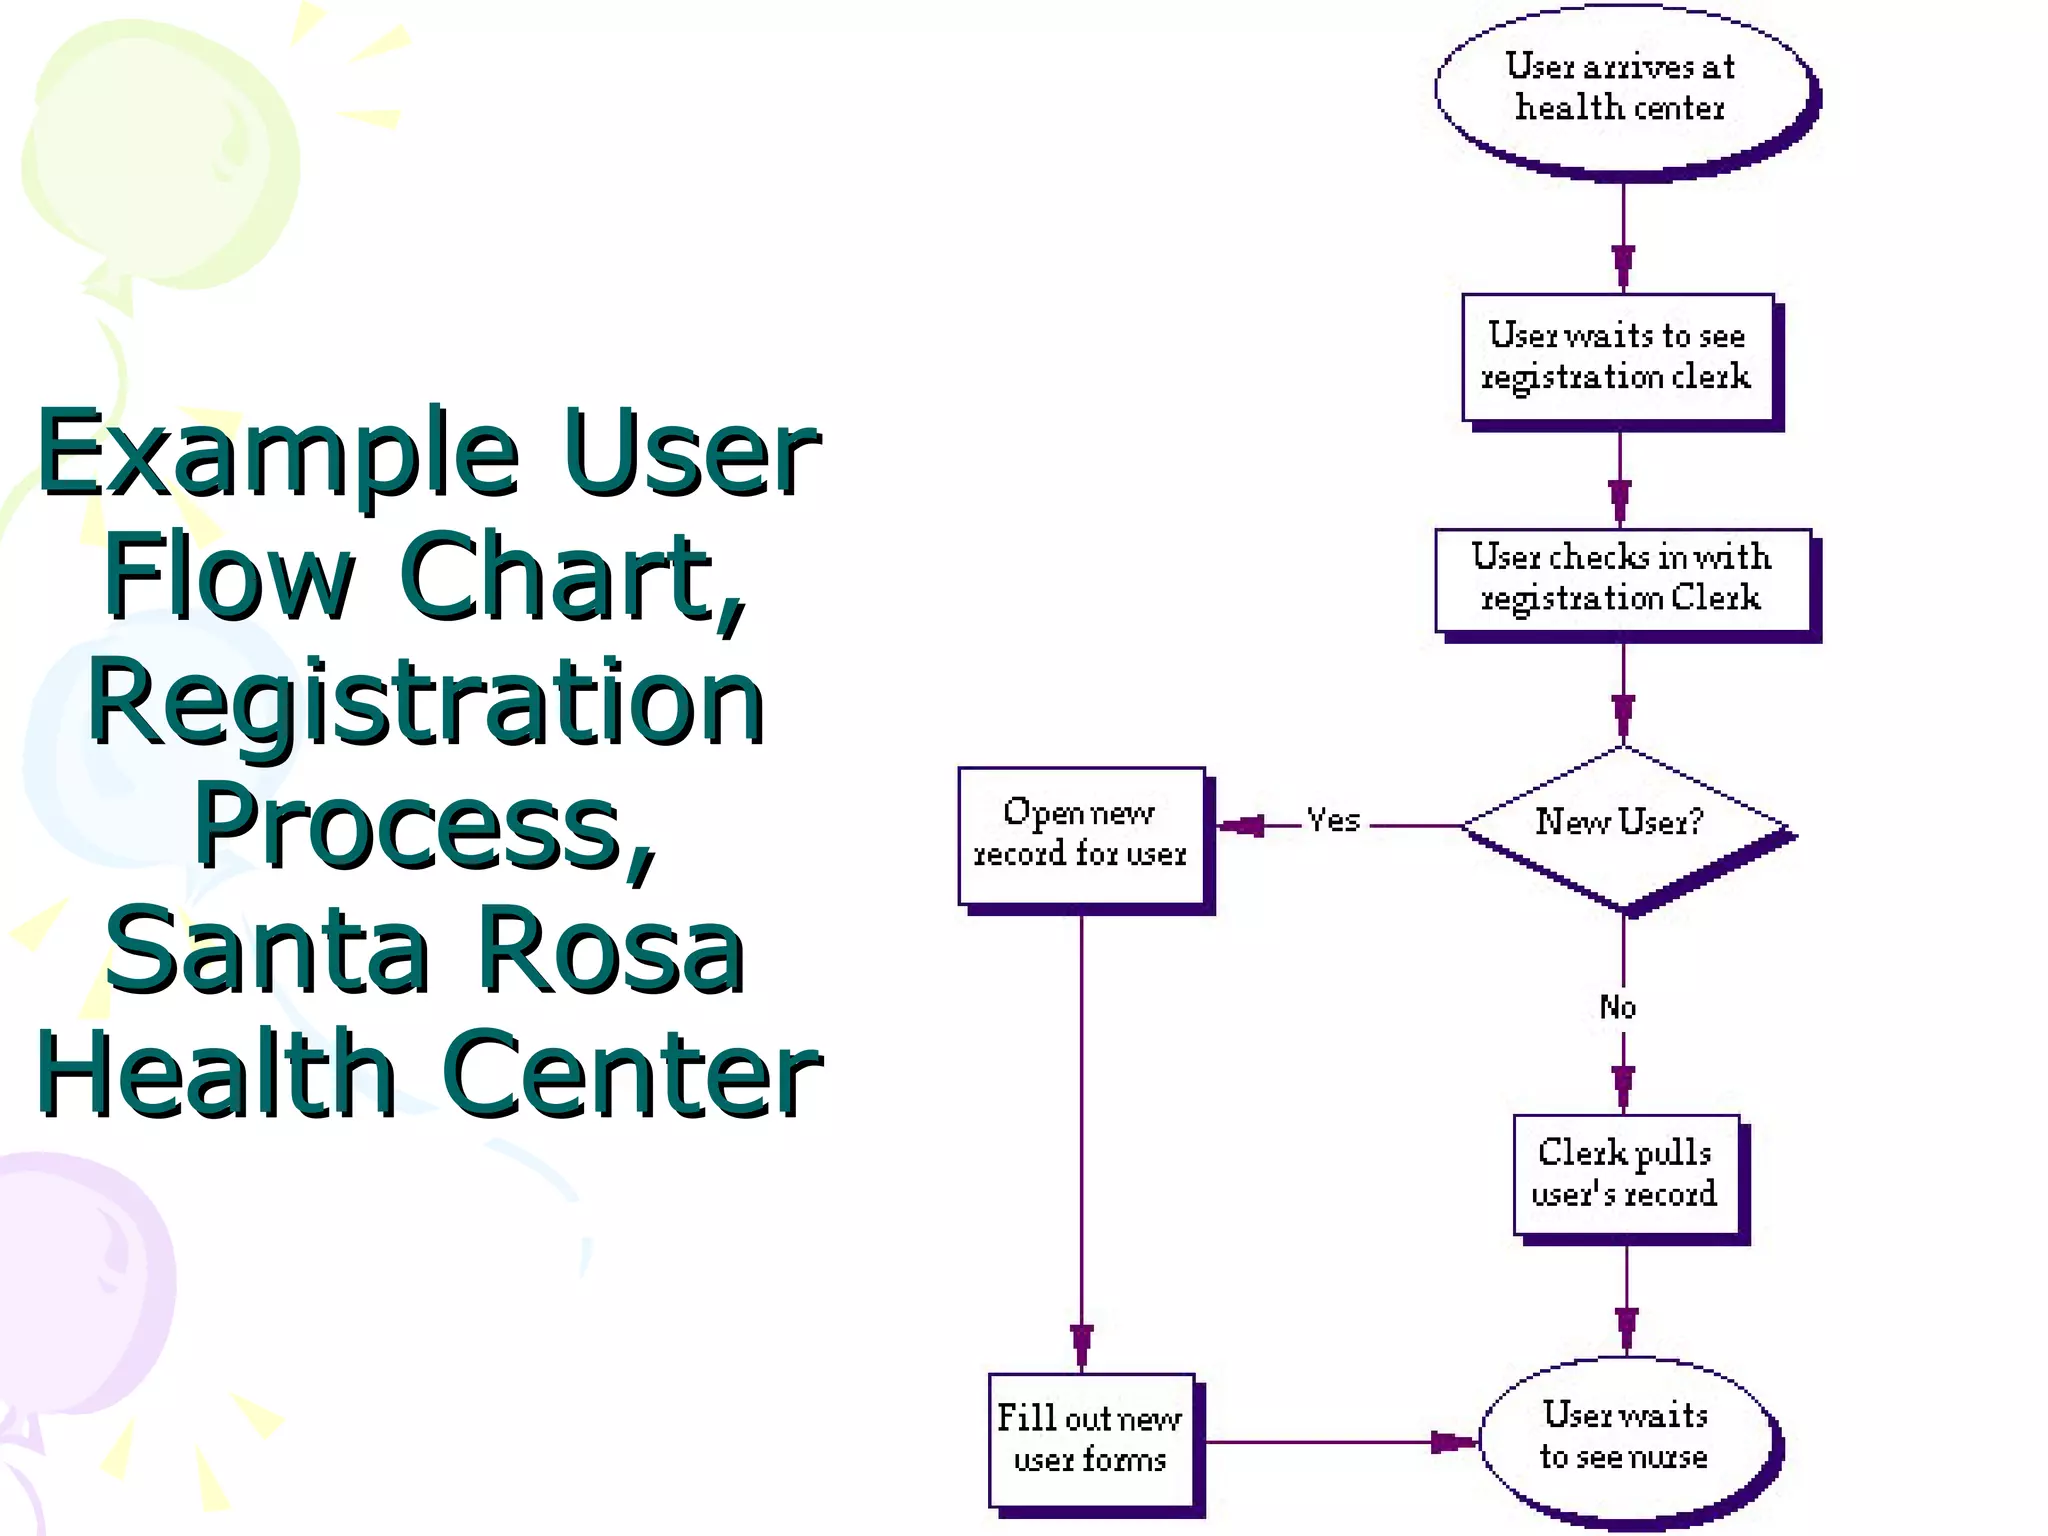
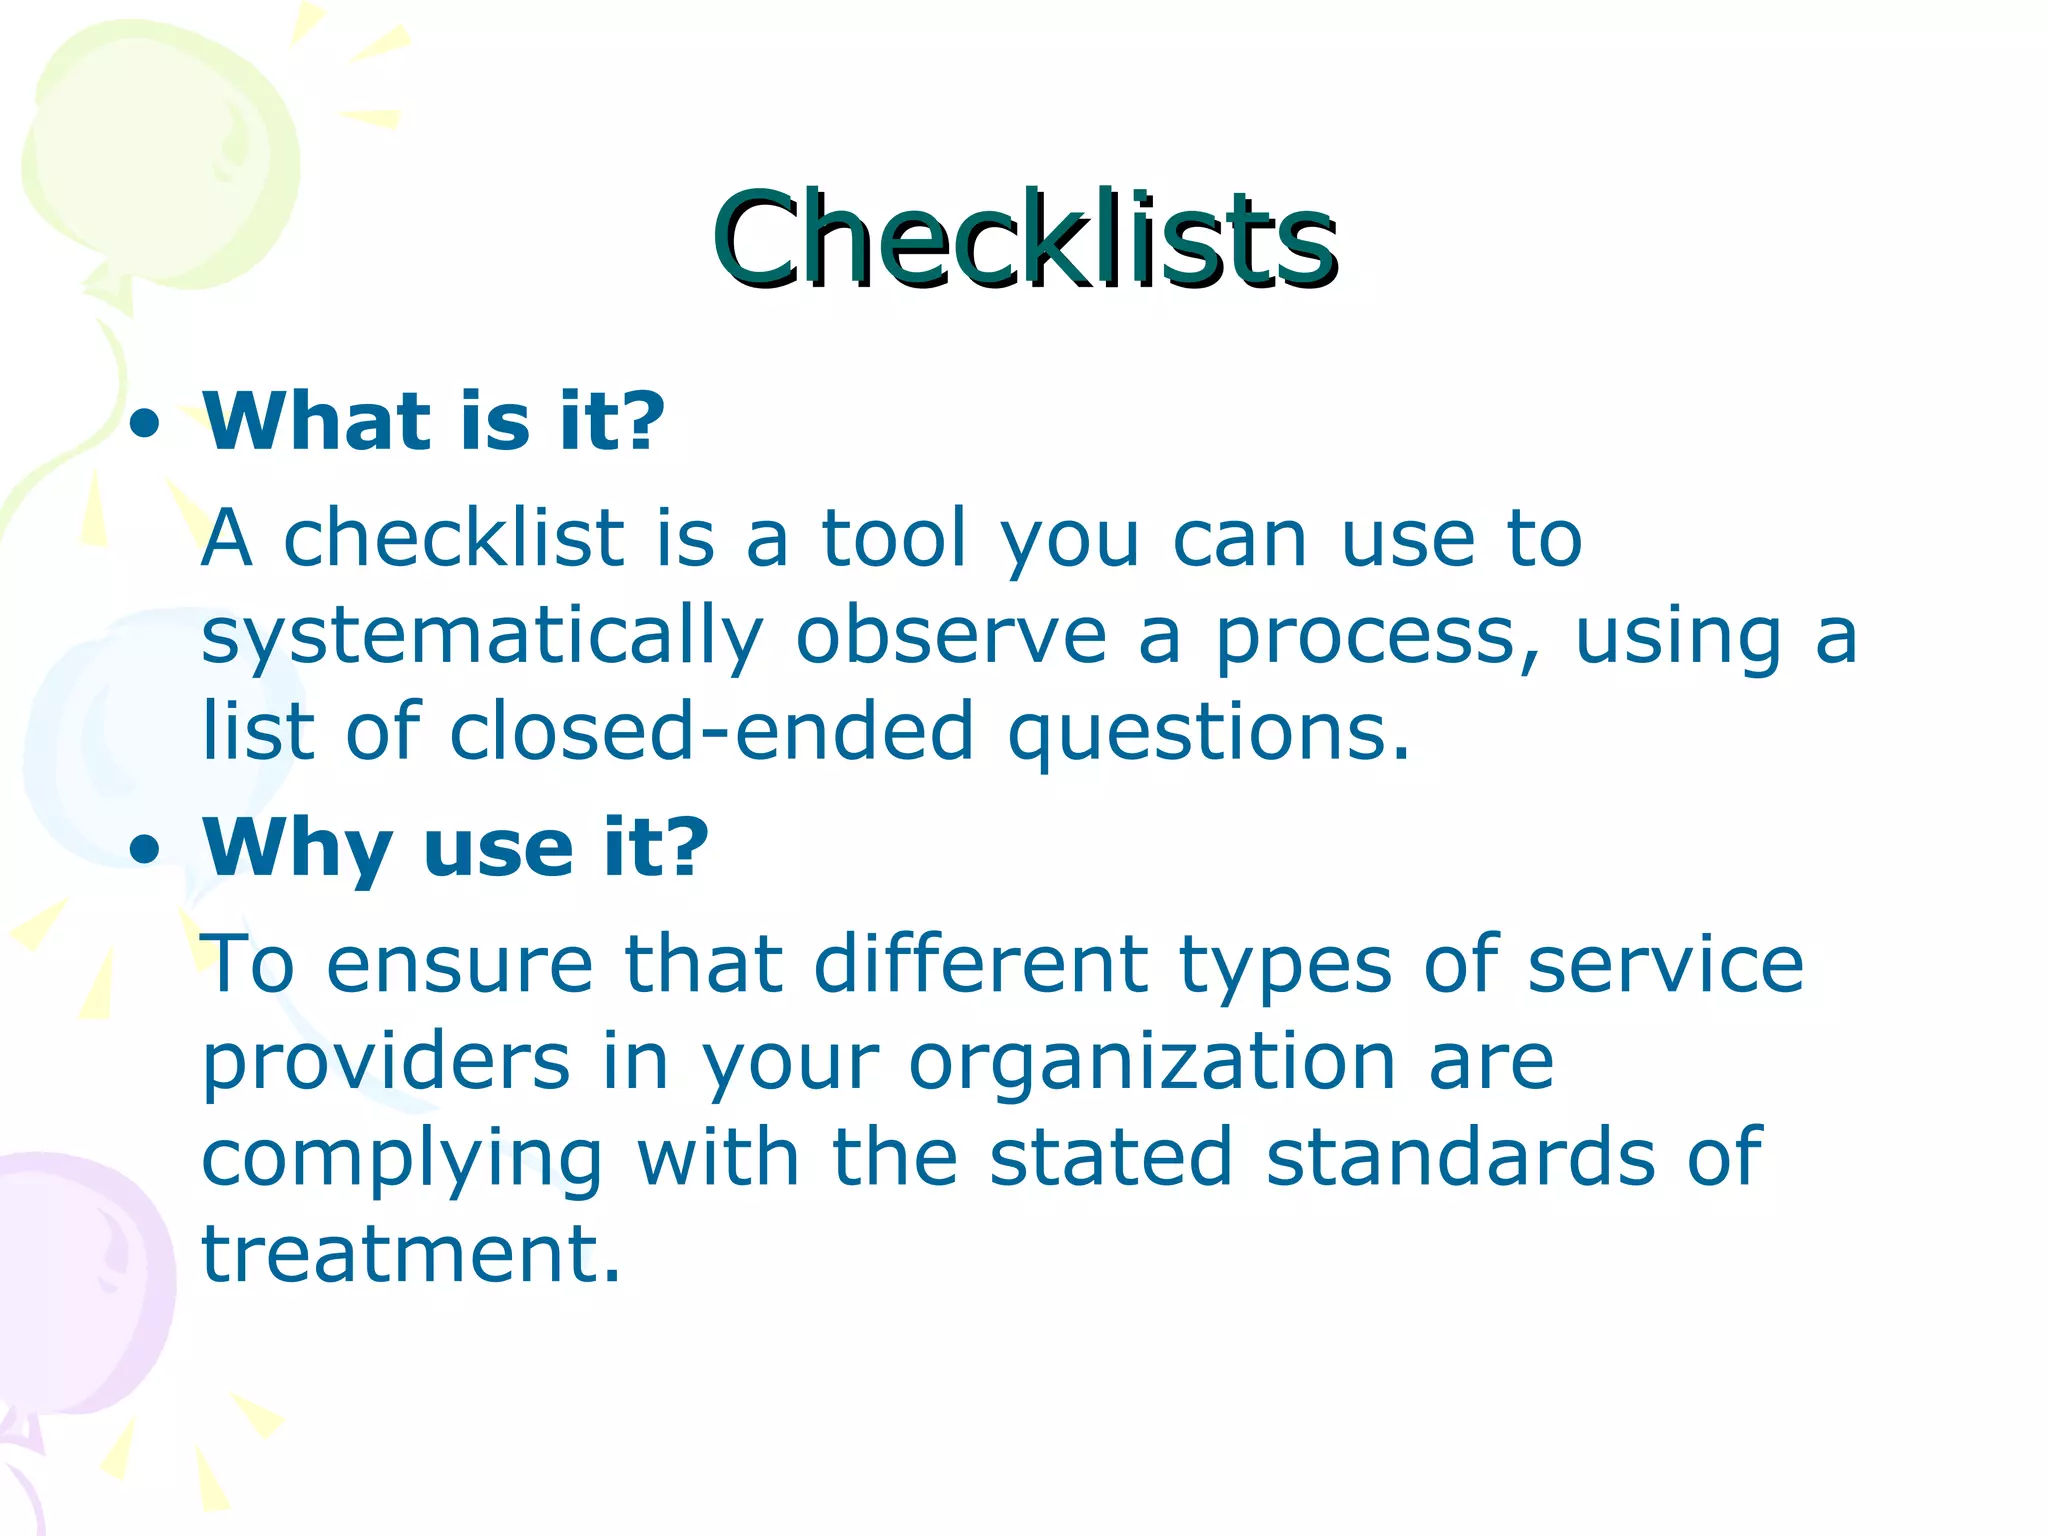
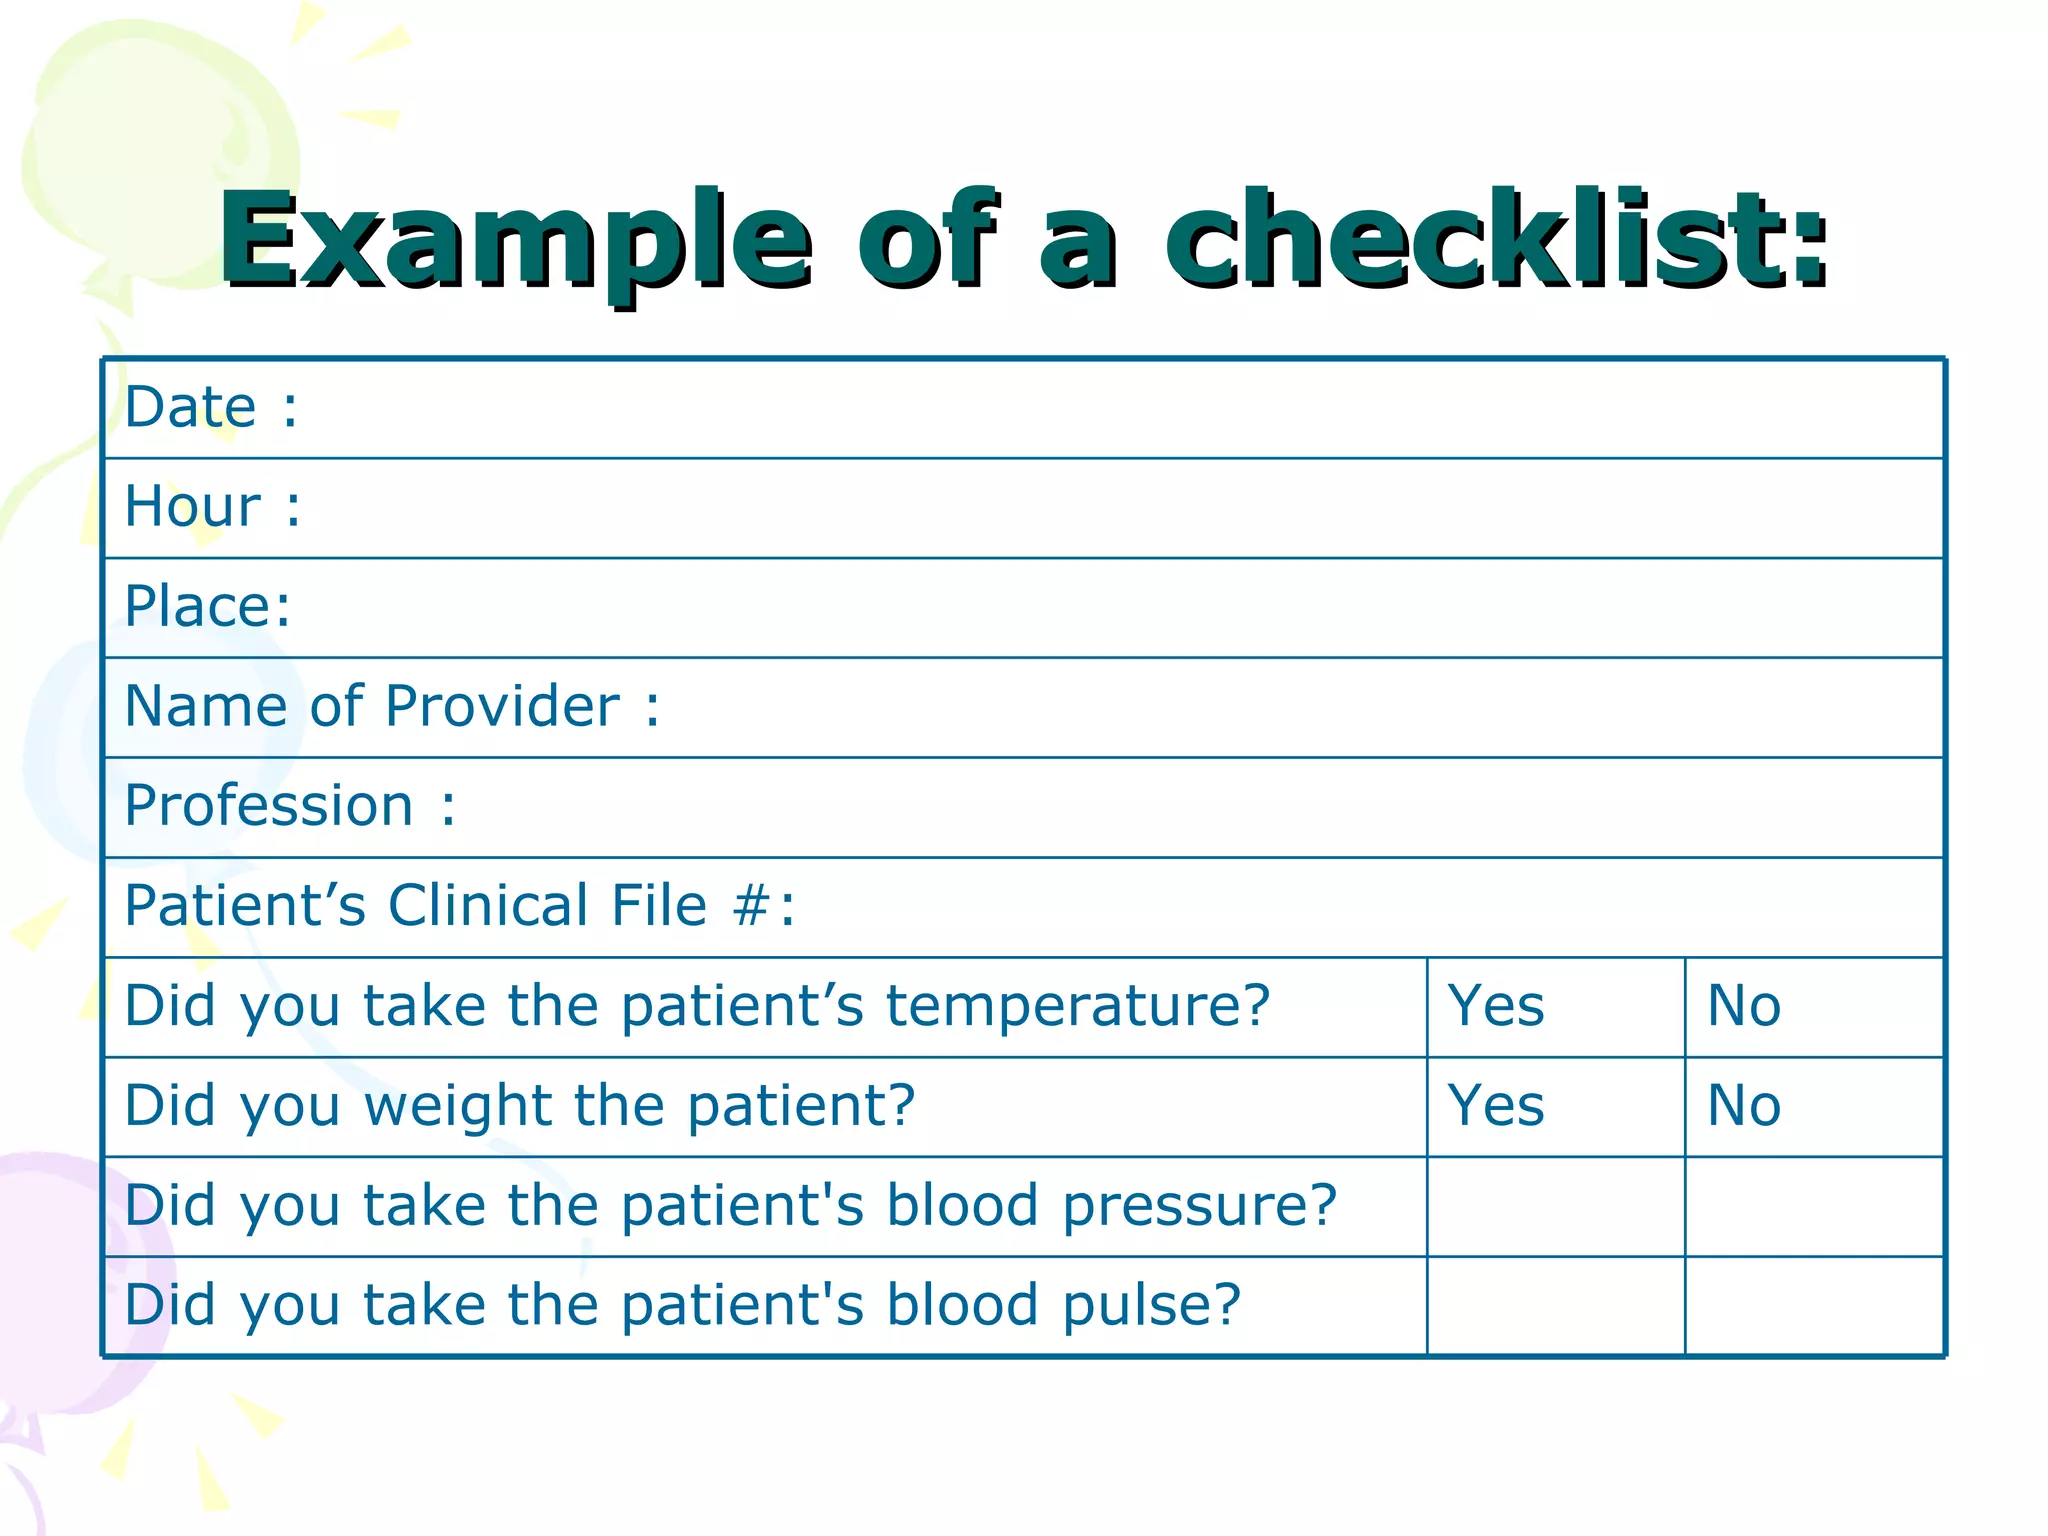
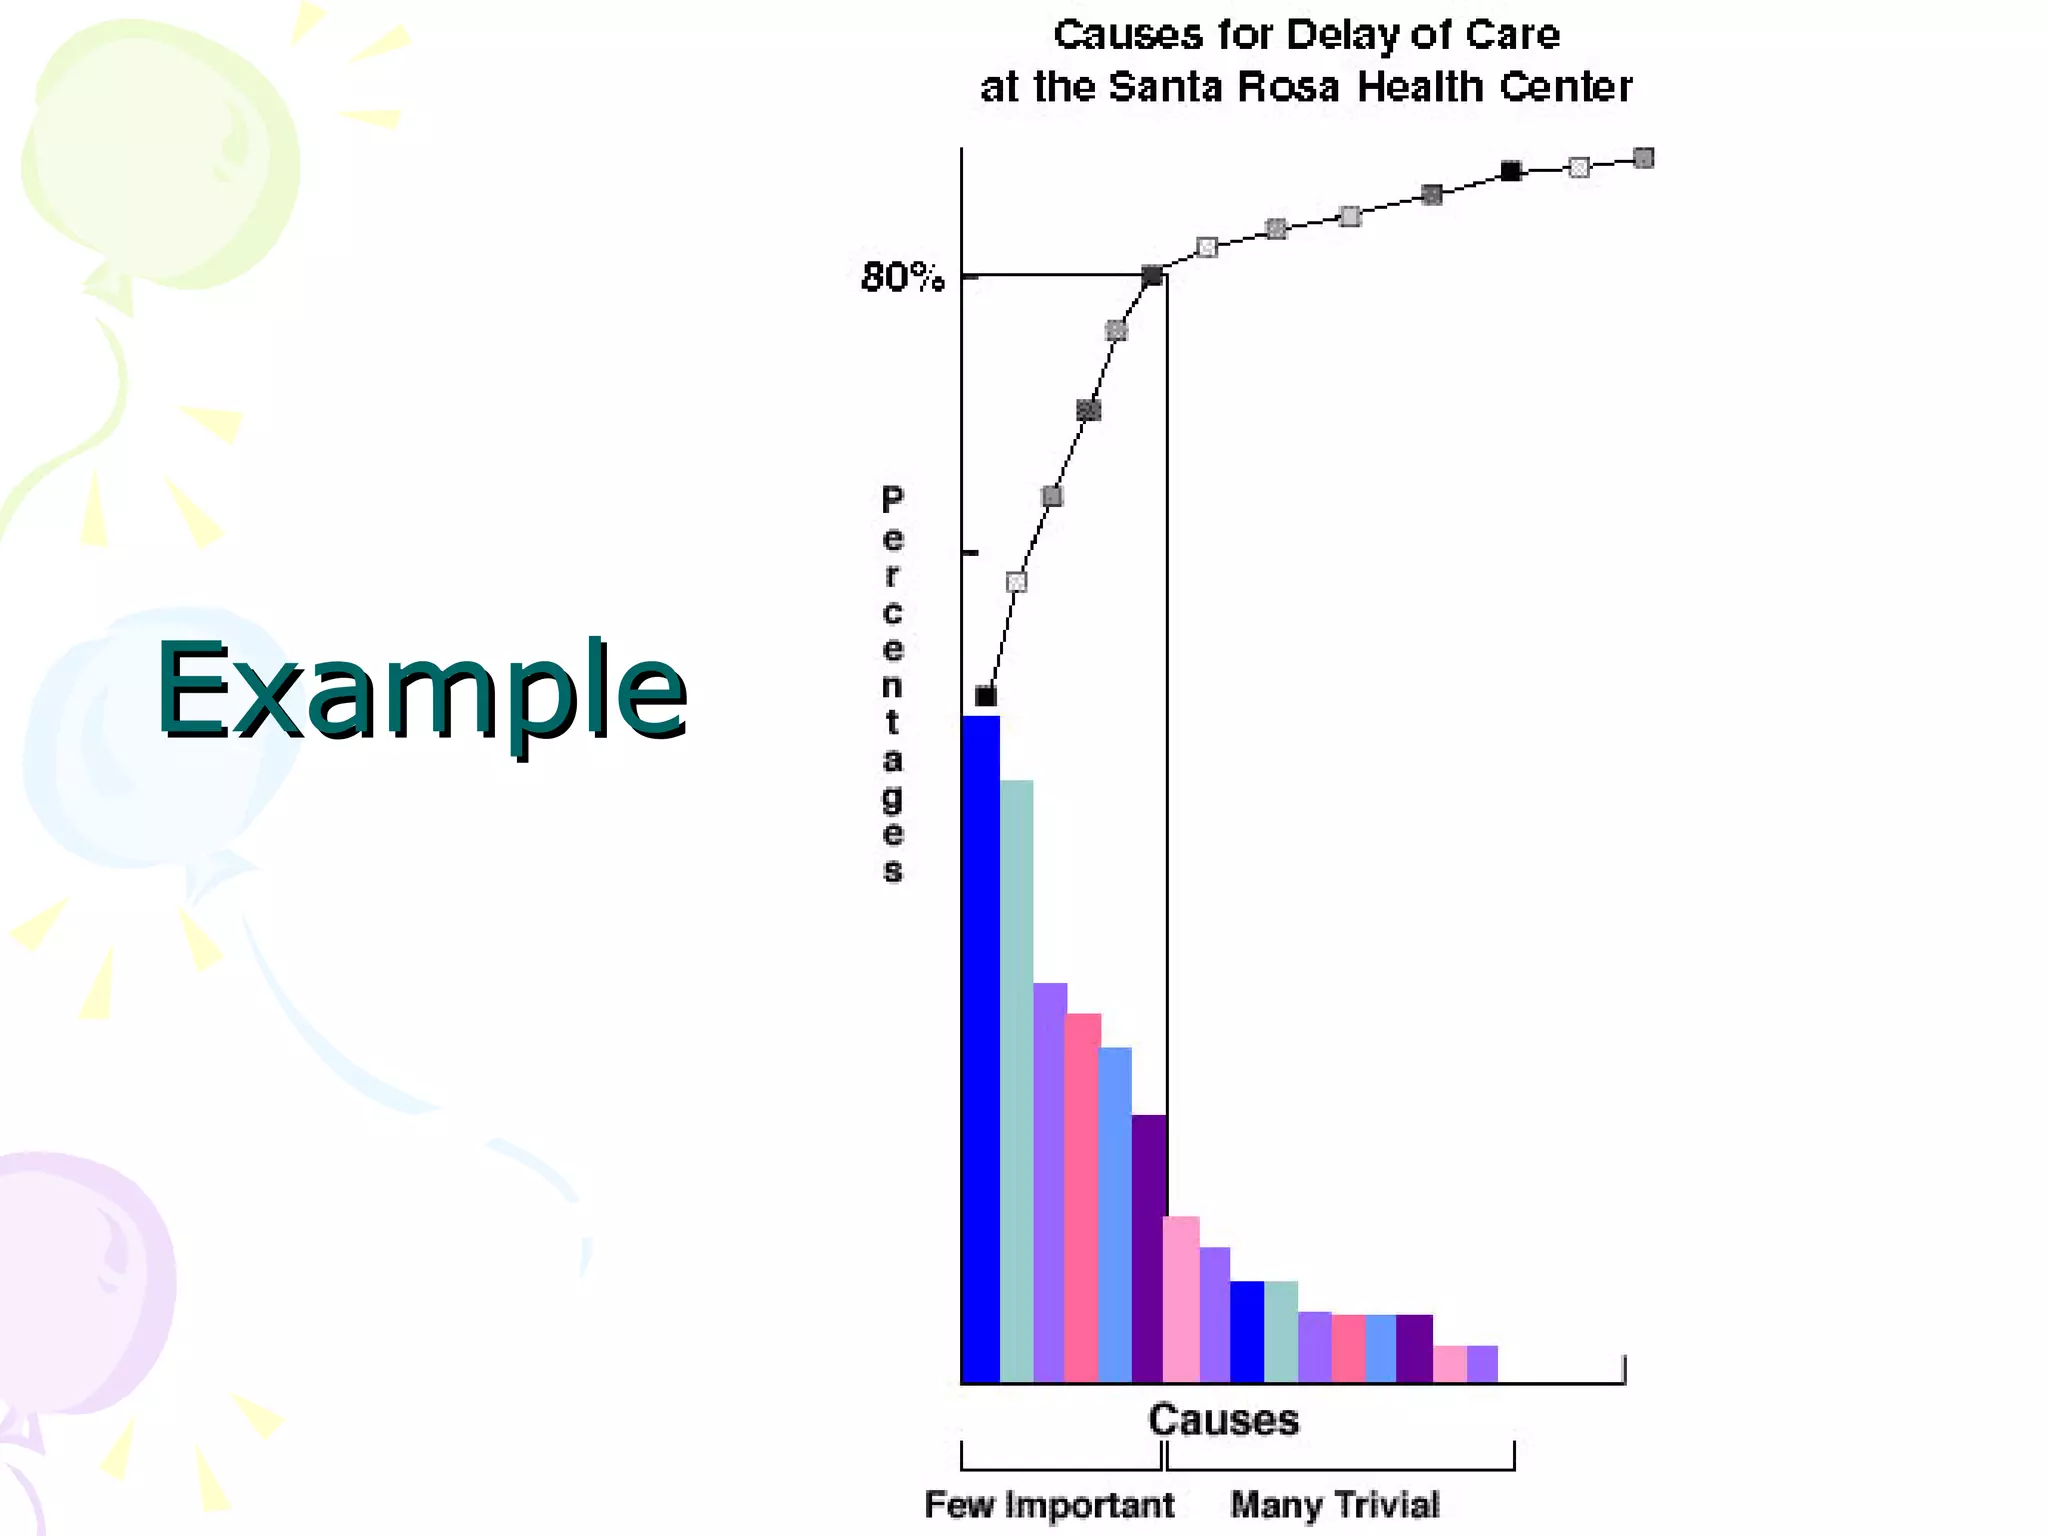

The document discusses 4 of the 7 problem solving tools: Cause and Effect Diagrams, Flowcharts, Checklists, and Pareto Analysis. It provides descriptions of what each tool is, why it is used, and an example for each. Cause and Effect Diagrams help identify primary and secondary causes of a problem. Flowcharts visualize processes to detect bottlenecks. Checklists ensure standards are followed. Pareto Analysis identifies the "vital few" key causes that produce most problems.


