The document discusses various case studies on population dynamics and migration patterns across different countries, including Namibia, Niger, Nigeria, Australia, China, and others, highlighting factors influencing sparse and dense populations, overpopulation, and underpopulation. It details specific regions' challenges such as housing shortages, internal and forced migration, urbanization impacts, and responses to natural disasters like earthquakes and floods. Additionally, it covers economic and social consequences stemming from these demographic trends, including the strain on public services and environmental concerns.
Case Studies v2
GEOGRAPHYCIE IGCSE
By Theo Dick
Aided by Alex Haji and Nick Gwynne
Edited by Ethan Sarif-Kattan
2.
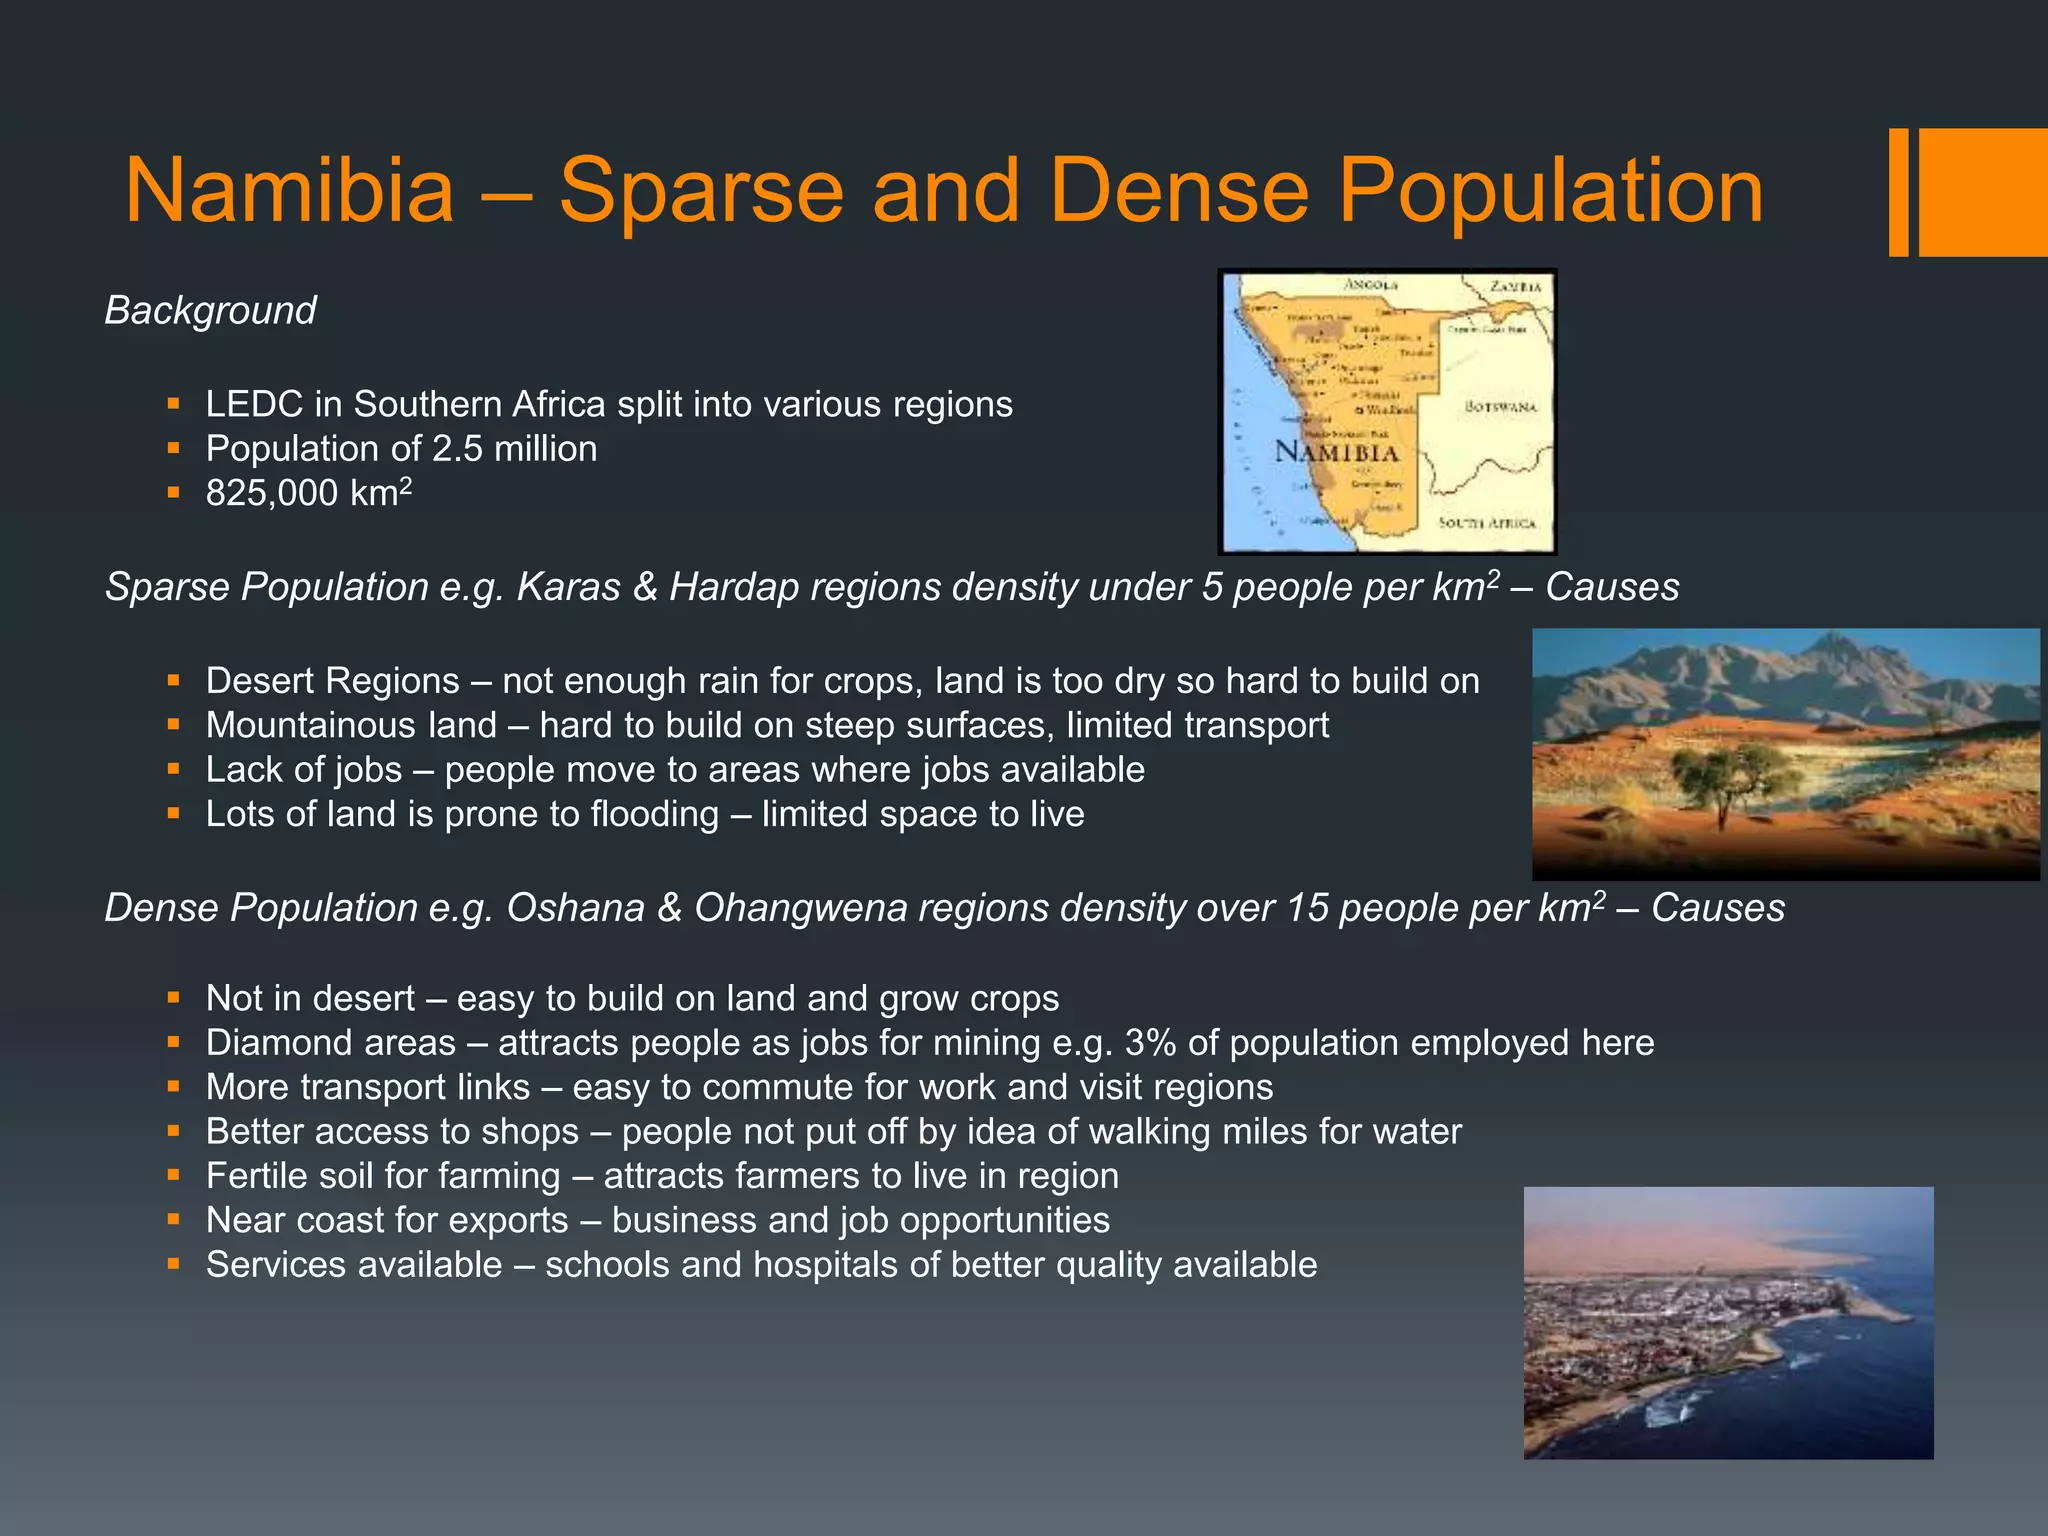
Namibia – Sparseand Dense Population
Background
LEDC in Southern Africa split into various regions
Population of 2.5 million
825,000 km2
Sparse Population e.g. Karas & Hardap regions density under 5 people per km2 – Causes
Desert Regions – not enough rain for crops, land is too dry so hard to build on
Mountainous land – hard to build on steep surfaces, limited transport
Lack of jobs – people move to areas where jobs available
Lots of land is prone to flooding – limited space to live
Dense Population e.g. Oshana & Ohangwena regions density over 15 people per km2 – Causes
Not in desert – easy to build on land and grow crops
Diamond areas – attracts people as jobs for mining e.g. 3% of population employed here
More transport links – easy to commute for work and visit regions
Better access to shops – people not put off by idea of walking miles for water
Fertile soil for farming – attracts farmers to live in region
Near coast for exports – business and job opportunities
Services available – schools and hospitals of better quality available
3.
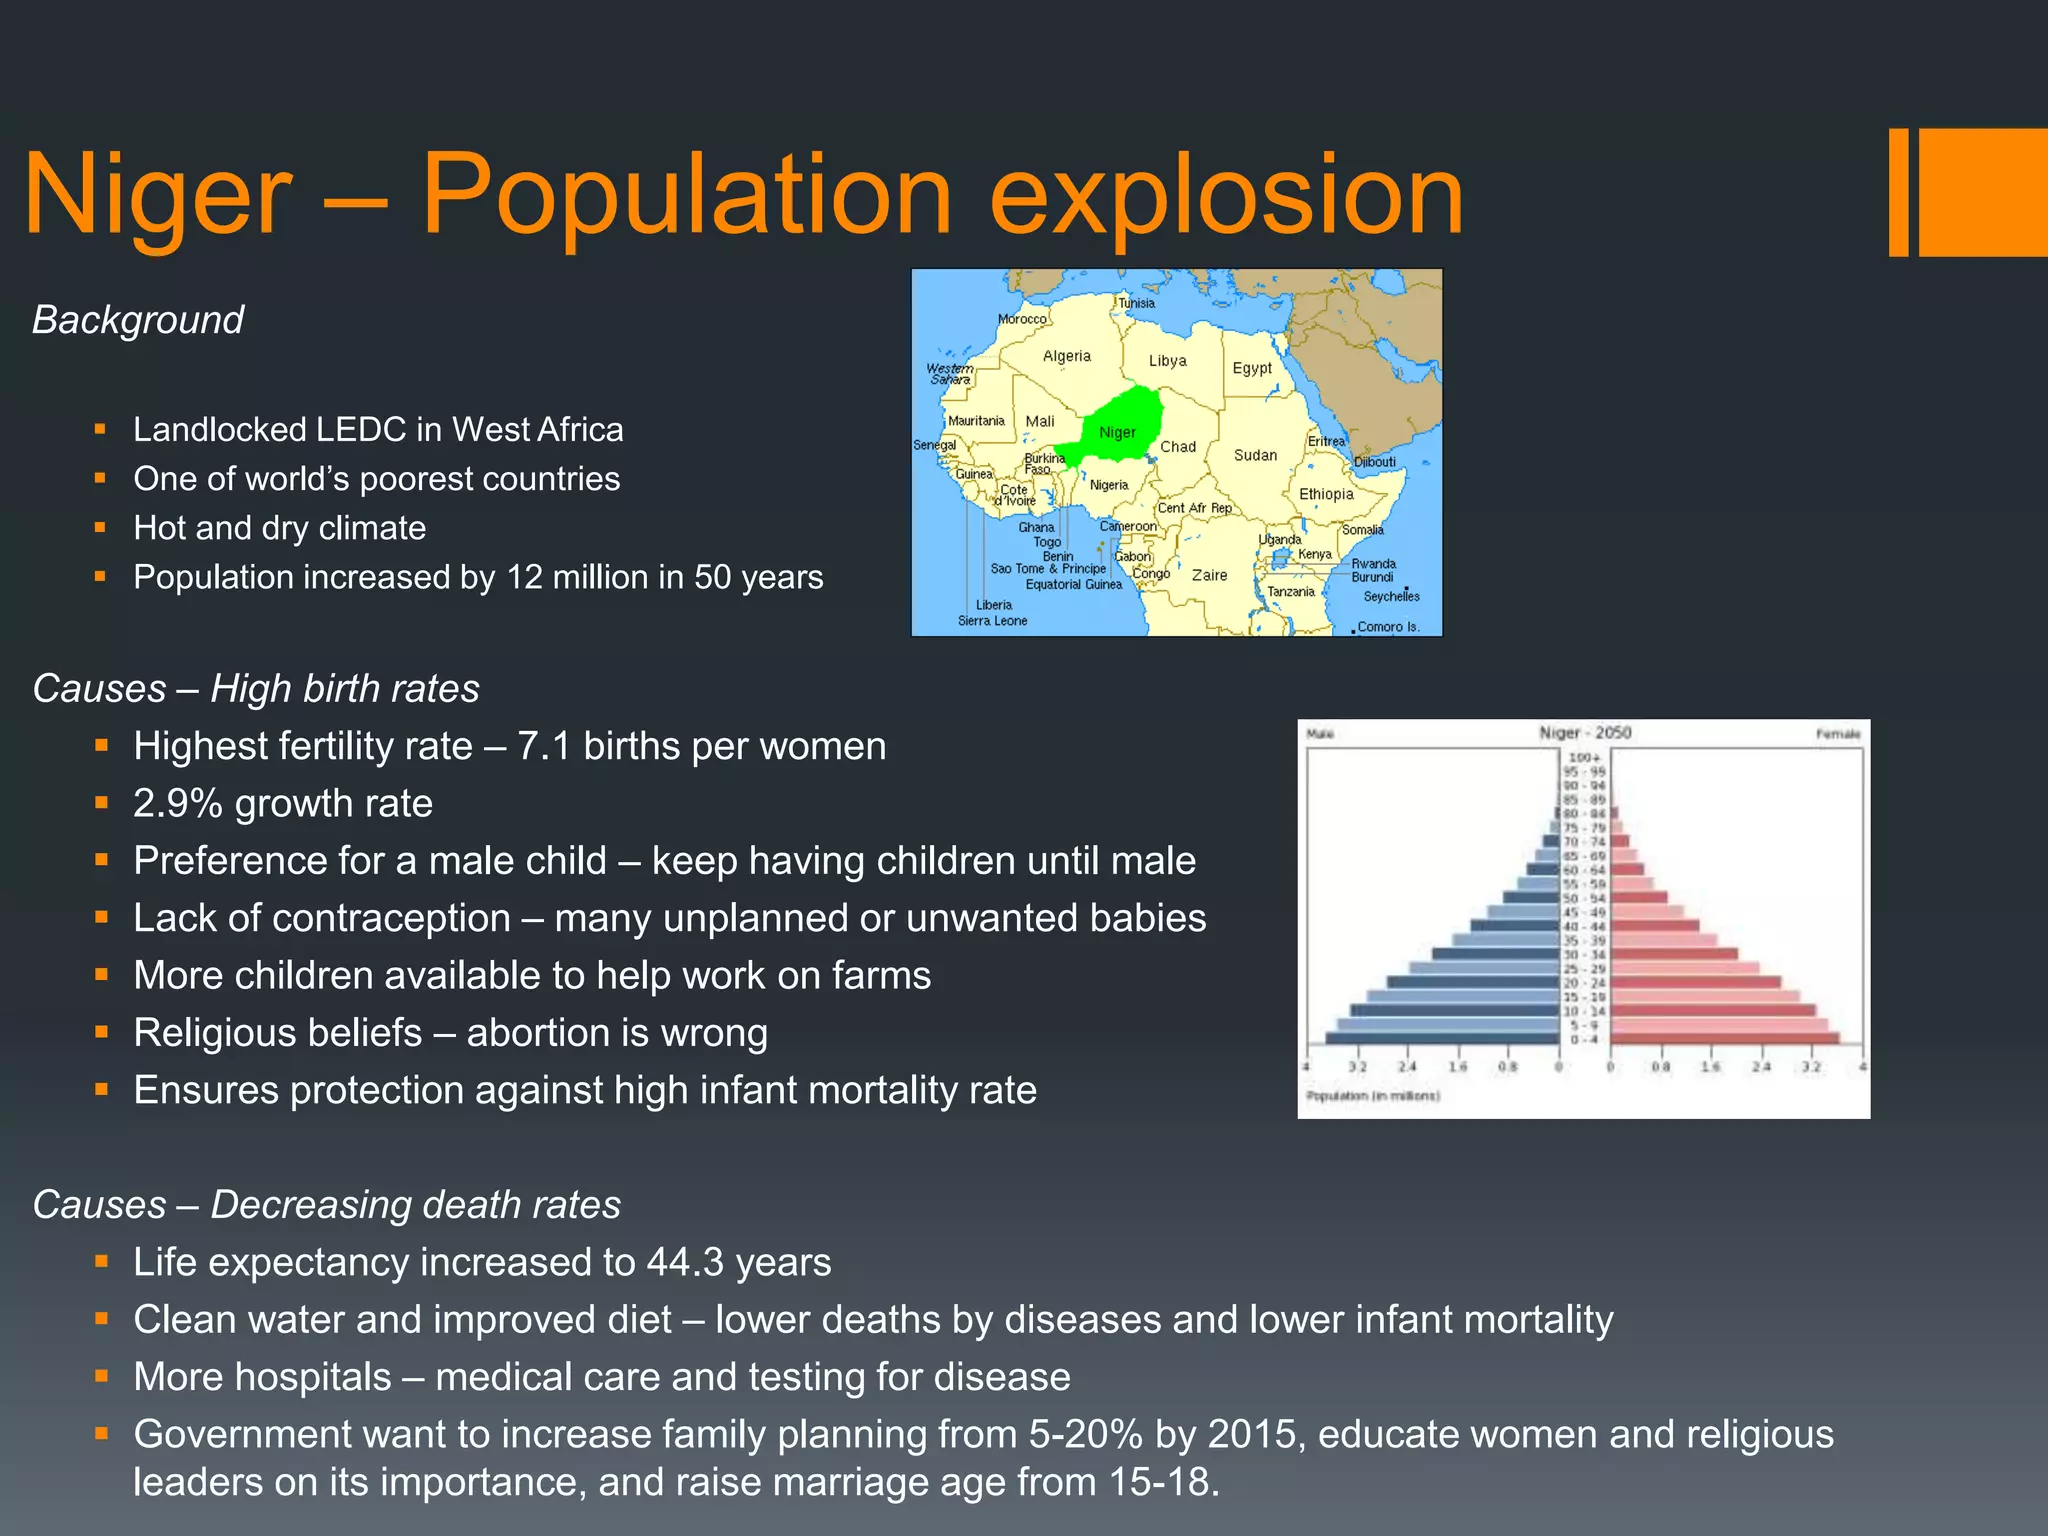
Niger – Populationexplosion
Background
Landlocked LEDC in West Africa
One of world’s poorest countries
Hot and dry climate
Population increased by 12 million in 50 years
Causes – High birth rates
Highest fertility rate – 7.1 births per women
2.9% growth rate
Preference for a male child – keep having children until male
Lack of contraception – many unplanned or unwanted babies
More children available to help work on farms
Religious beliefs – abortion is wrong
Ensures protection against high infant mortality rate
Causes – Decreasing death rates
Life expectancy increased to 44.3 years
Clean water and improved diet – lower deaths by diseases and lower infant mortality
More hospitals – medical care and testing for disease
Government want to increase family planning from 5-20% by 2015, educate women and religious
leaders on its importance, and raise marriage age from 15-18.
4.
Nigeria - Overpopulation
Background
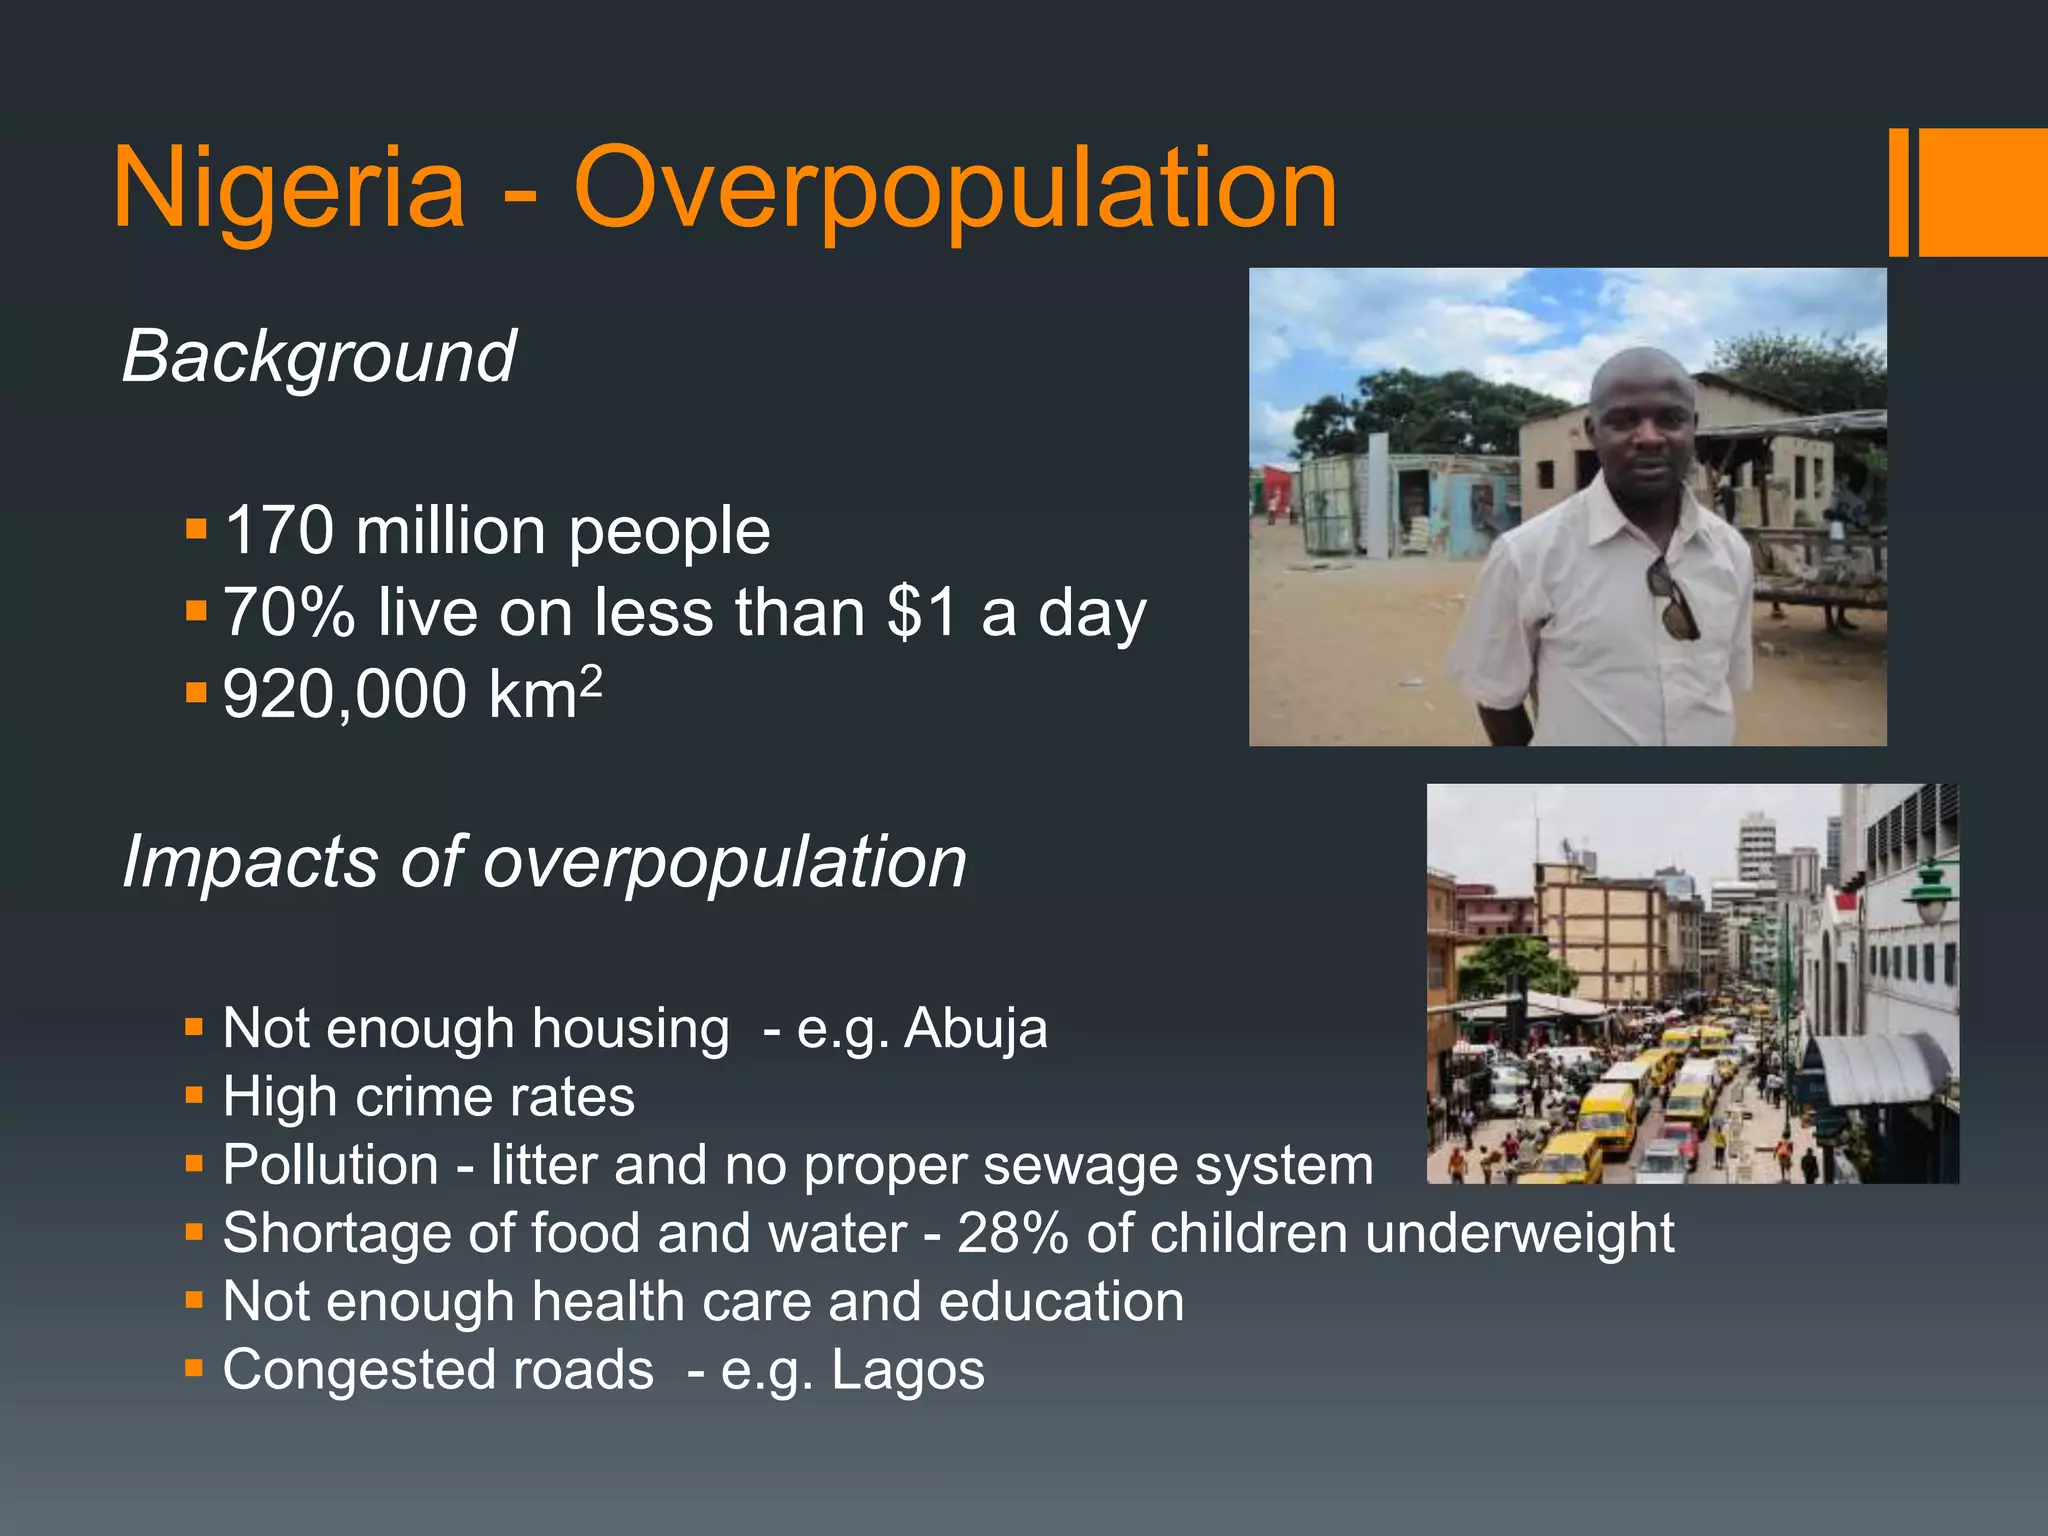
170million people
70% live on less than $1 a day
920,000 km2
Impacts of overpopulation
Not enough housing - e.g. Abuja
High crime rates
Pollution - litter and no proper sewage system
Shortage of food and water - 28% of children underweight
Not enough health care and education
Congested roads - e.g. Lagos
5.
Australia - Underpopulation
Background
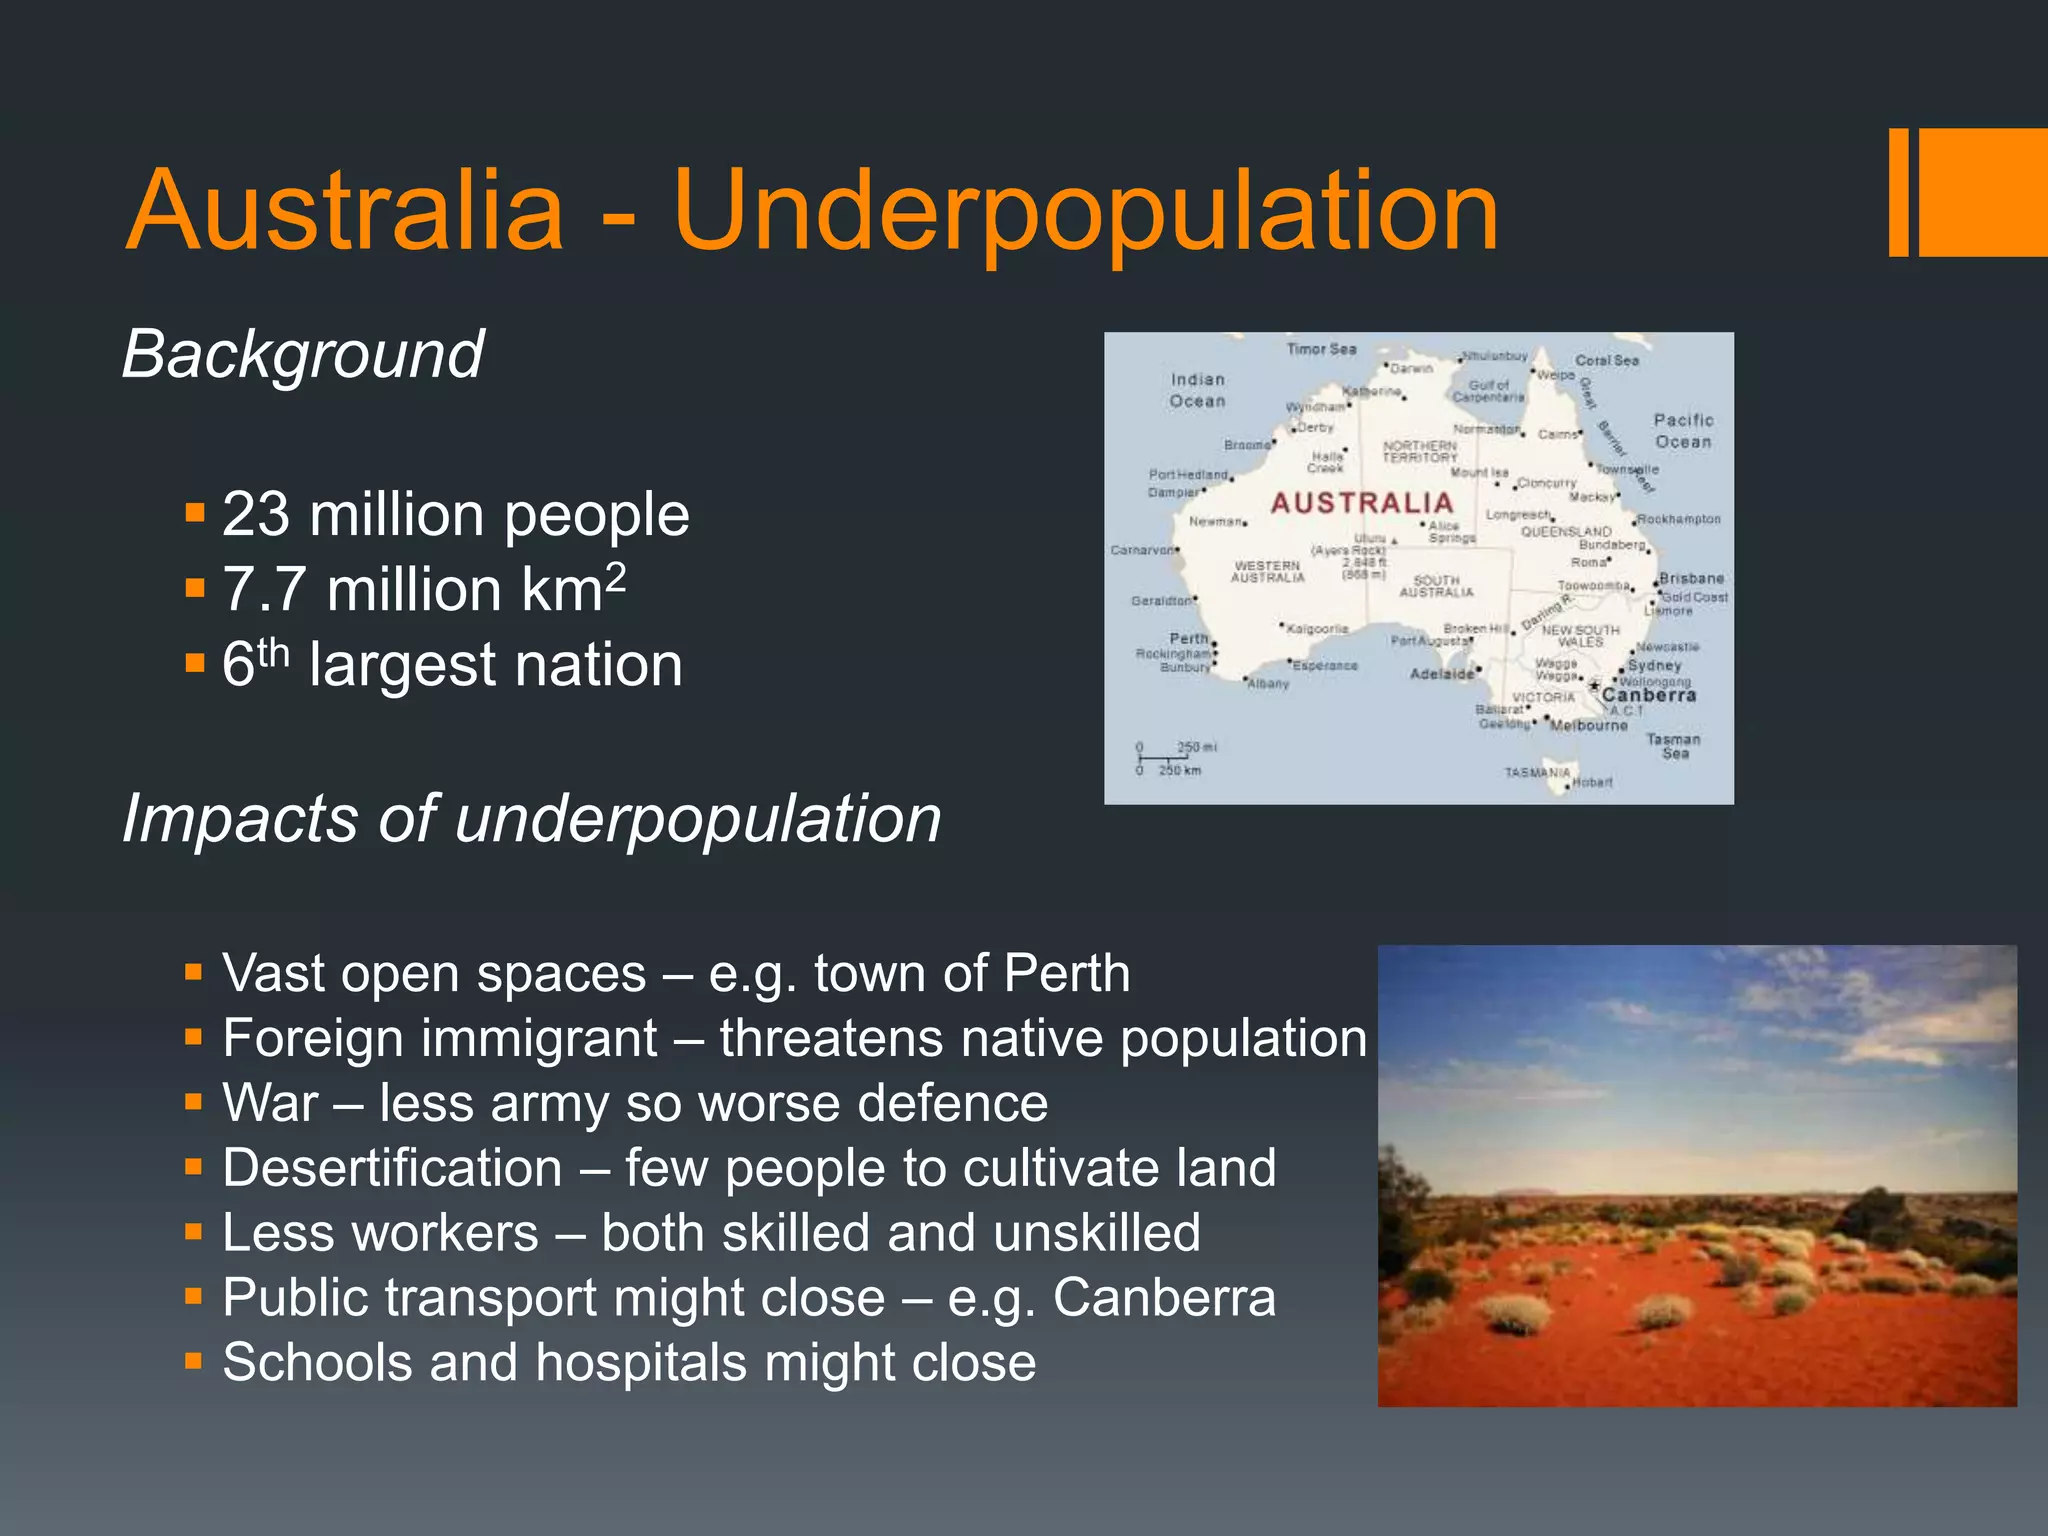
23 million people
7.7 million km2
6th largest nation
Impacts of underpopulation
Vast open spaces – e.g. town of Perth
Foreign immigrant – threatens native population
War – less army so worse defence
Desertification – few people to cultivate land
Less workers – both skilled and unskilled
Public transport might close – e.g. Canberra
Schools and hospitals might close
6.
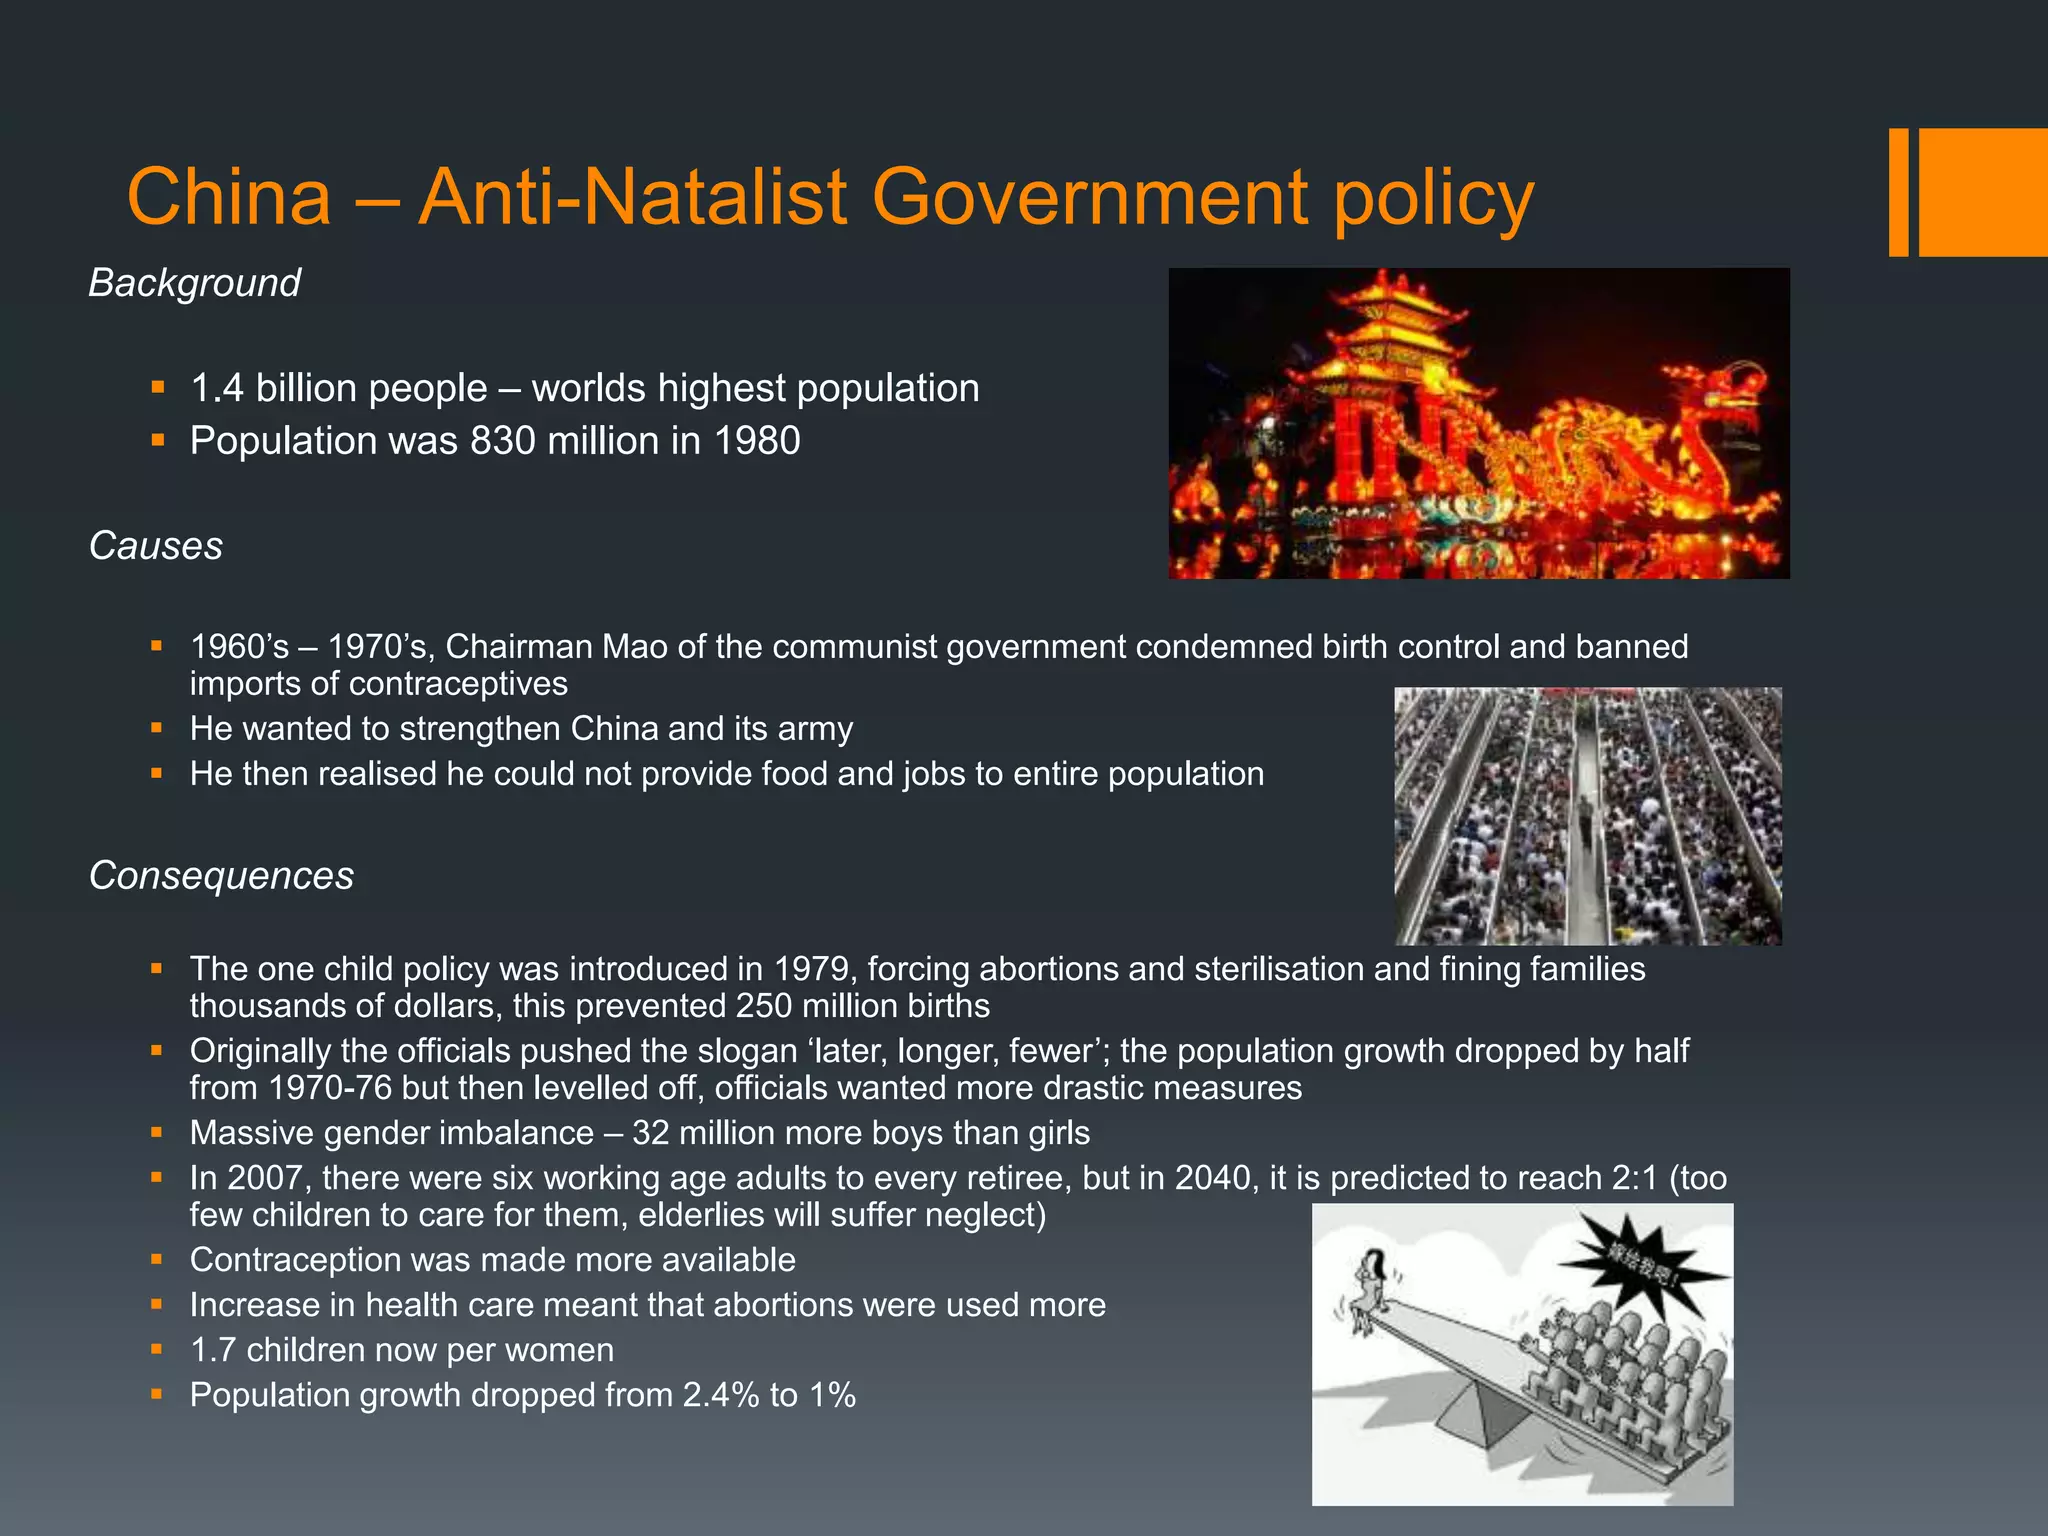
China – Anti-NatalistGovernment policy
Background
1.4 billion people – worlds highest population
Population was 830 million in 1980
Causes
1960’s – 1970’s, Chairman Mao of the communist government condemned birth control and banned
imports of contraceptives
He wanted to strengthen China and its army
He then realised he could not provide food and jobs to entire population
Consequences
The one child policy was introduced in 1979, forcing abortions and sterilisation and fining families
thousands of dollars, this prevented 250 million births
Originally the officials pushed the slogan ‘later, longer, fewer’; the population growth dropped by half
from 1970-76 but then levelled off, officials wanted more drastic measures
Massive gender imbalance – 32 million more boys than girls
In 2007, there were six working age adults to every retiree, but in 2040, it is predicted to reach 2:1 (too
few children to care for them, elderlies will suffer neglect)
Contraception was made more available
Increase in health care meant that abortions were used more
1.7 children now per women
Population growth dropped from 2.4% to 1%
7.
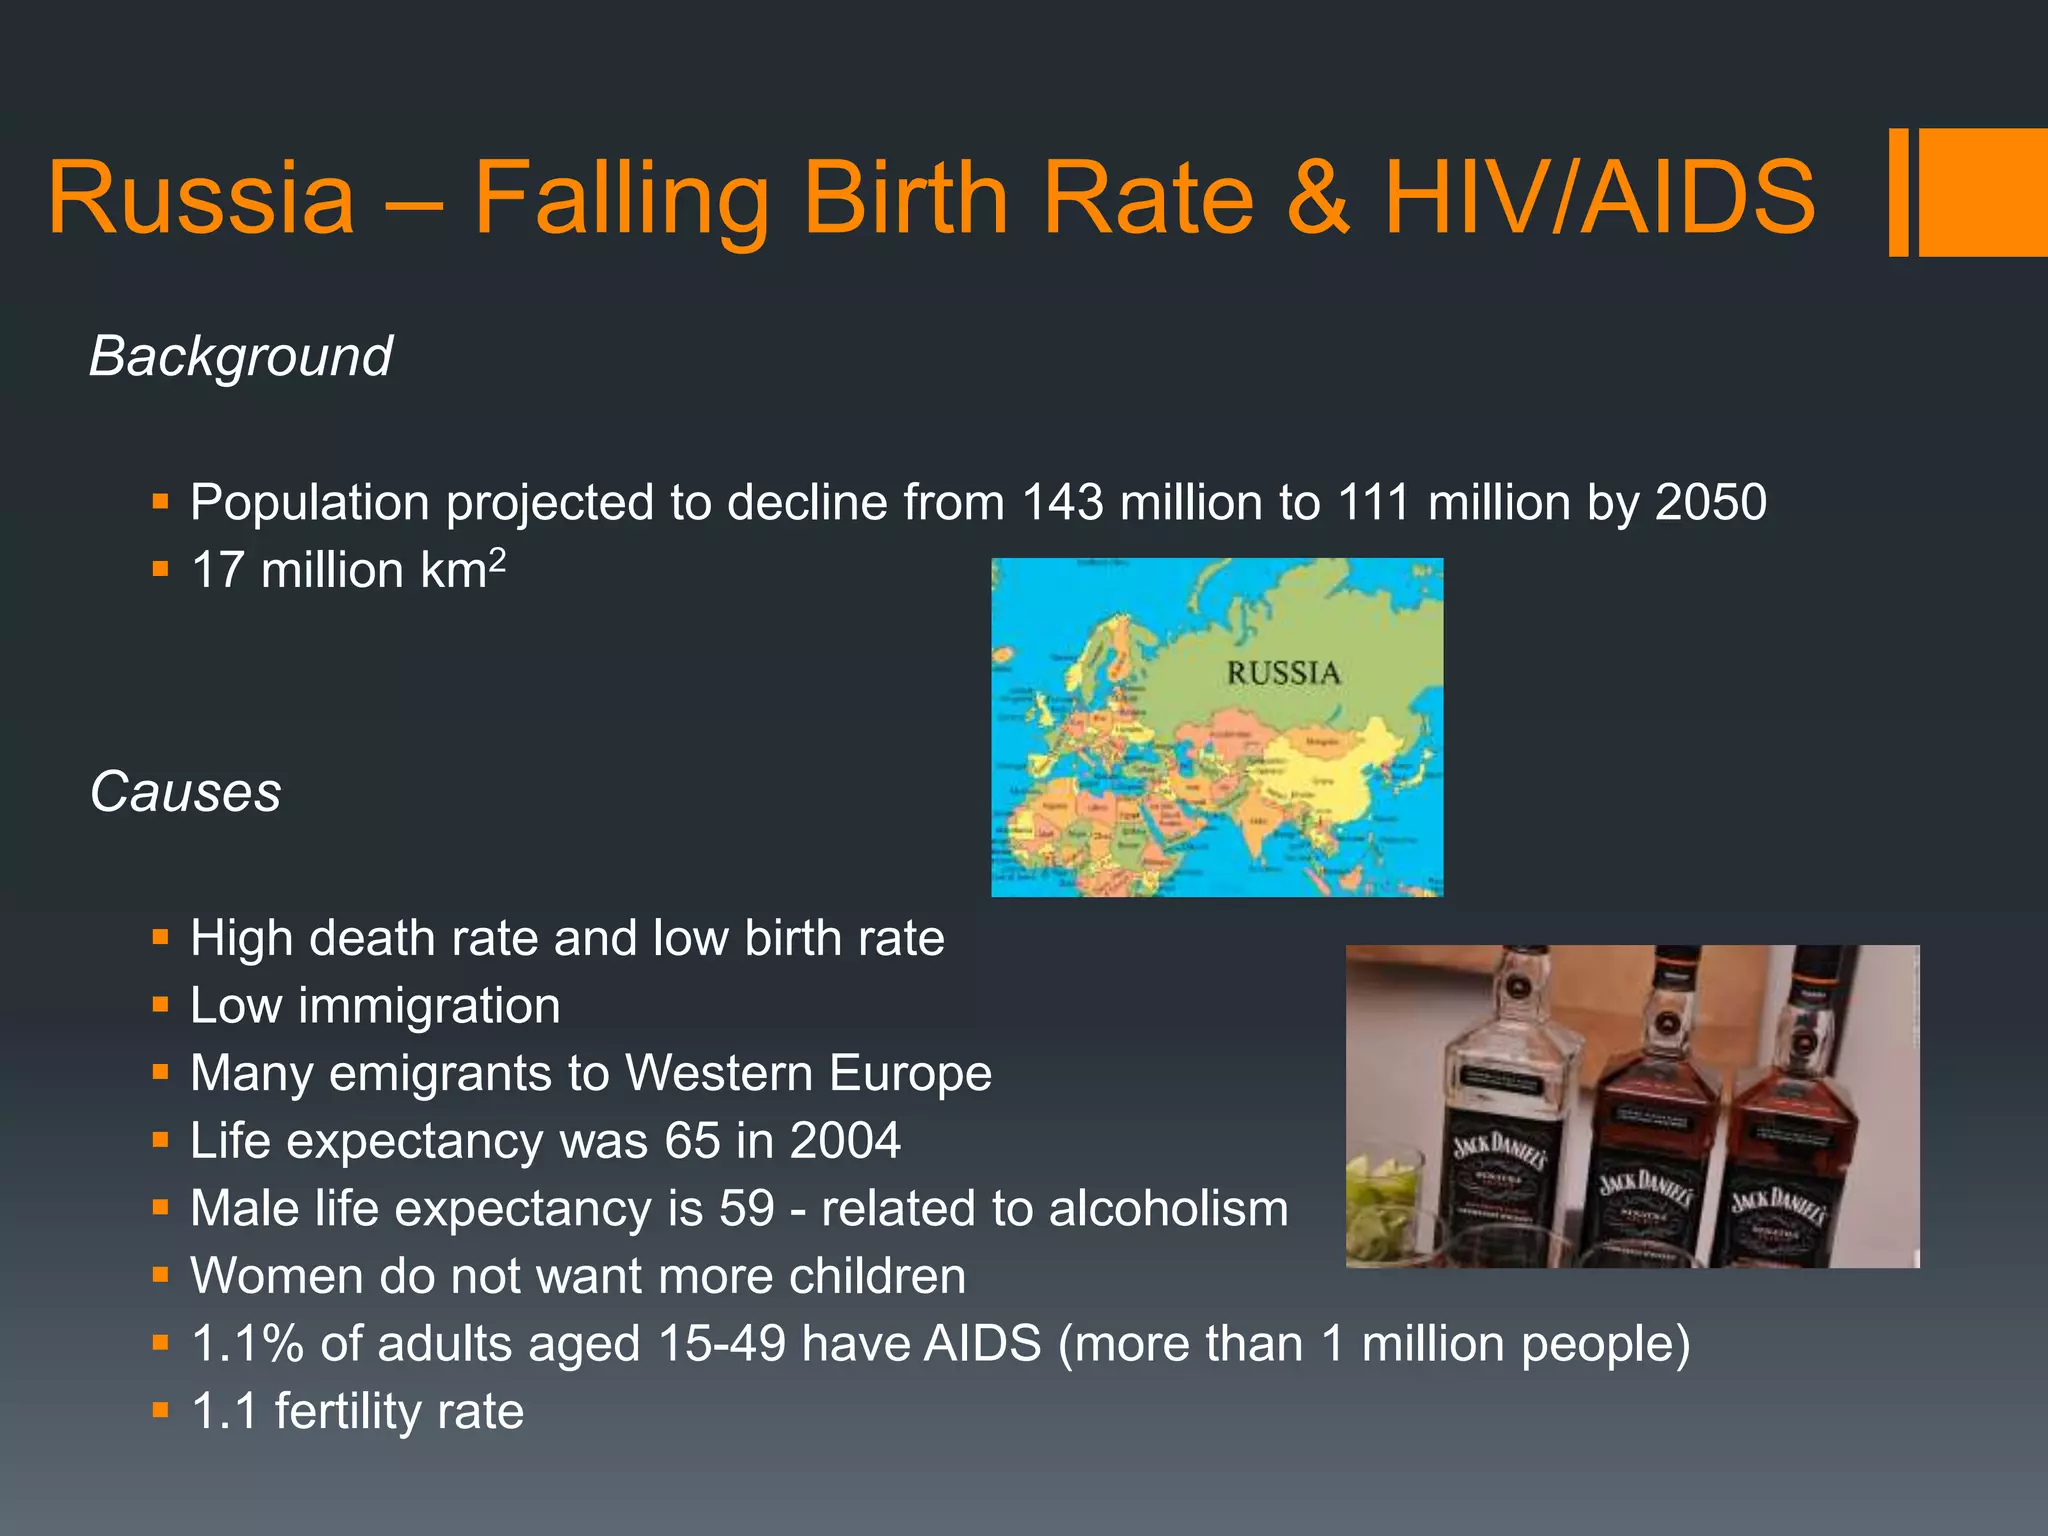
Russia – FallingBirth Rate & HIV/AIDS
Background
Population projected to decline from 143 million to 111 million by 2050
17 million km2
Causes
High death rate and low birth rate
Low immigration
Many emigrants to Western Europe
Life expectancy was 65 in 2004
Male life expectancy is 59 - related to alcoholism
Women do not want more children
1.1% of adults aged 15-49 have AIDS (more than 1 million people)
1.1 fertility rate
8.
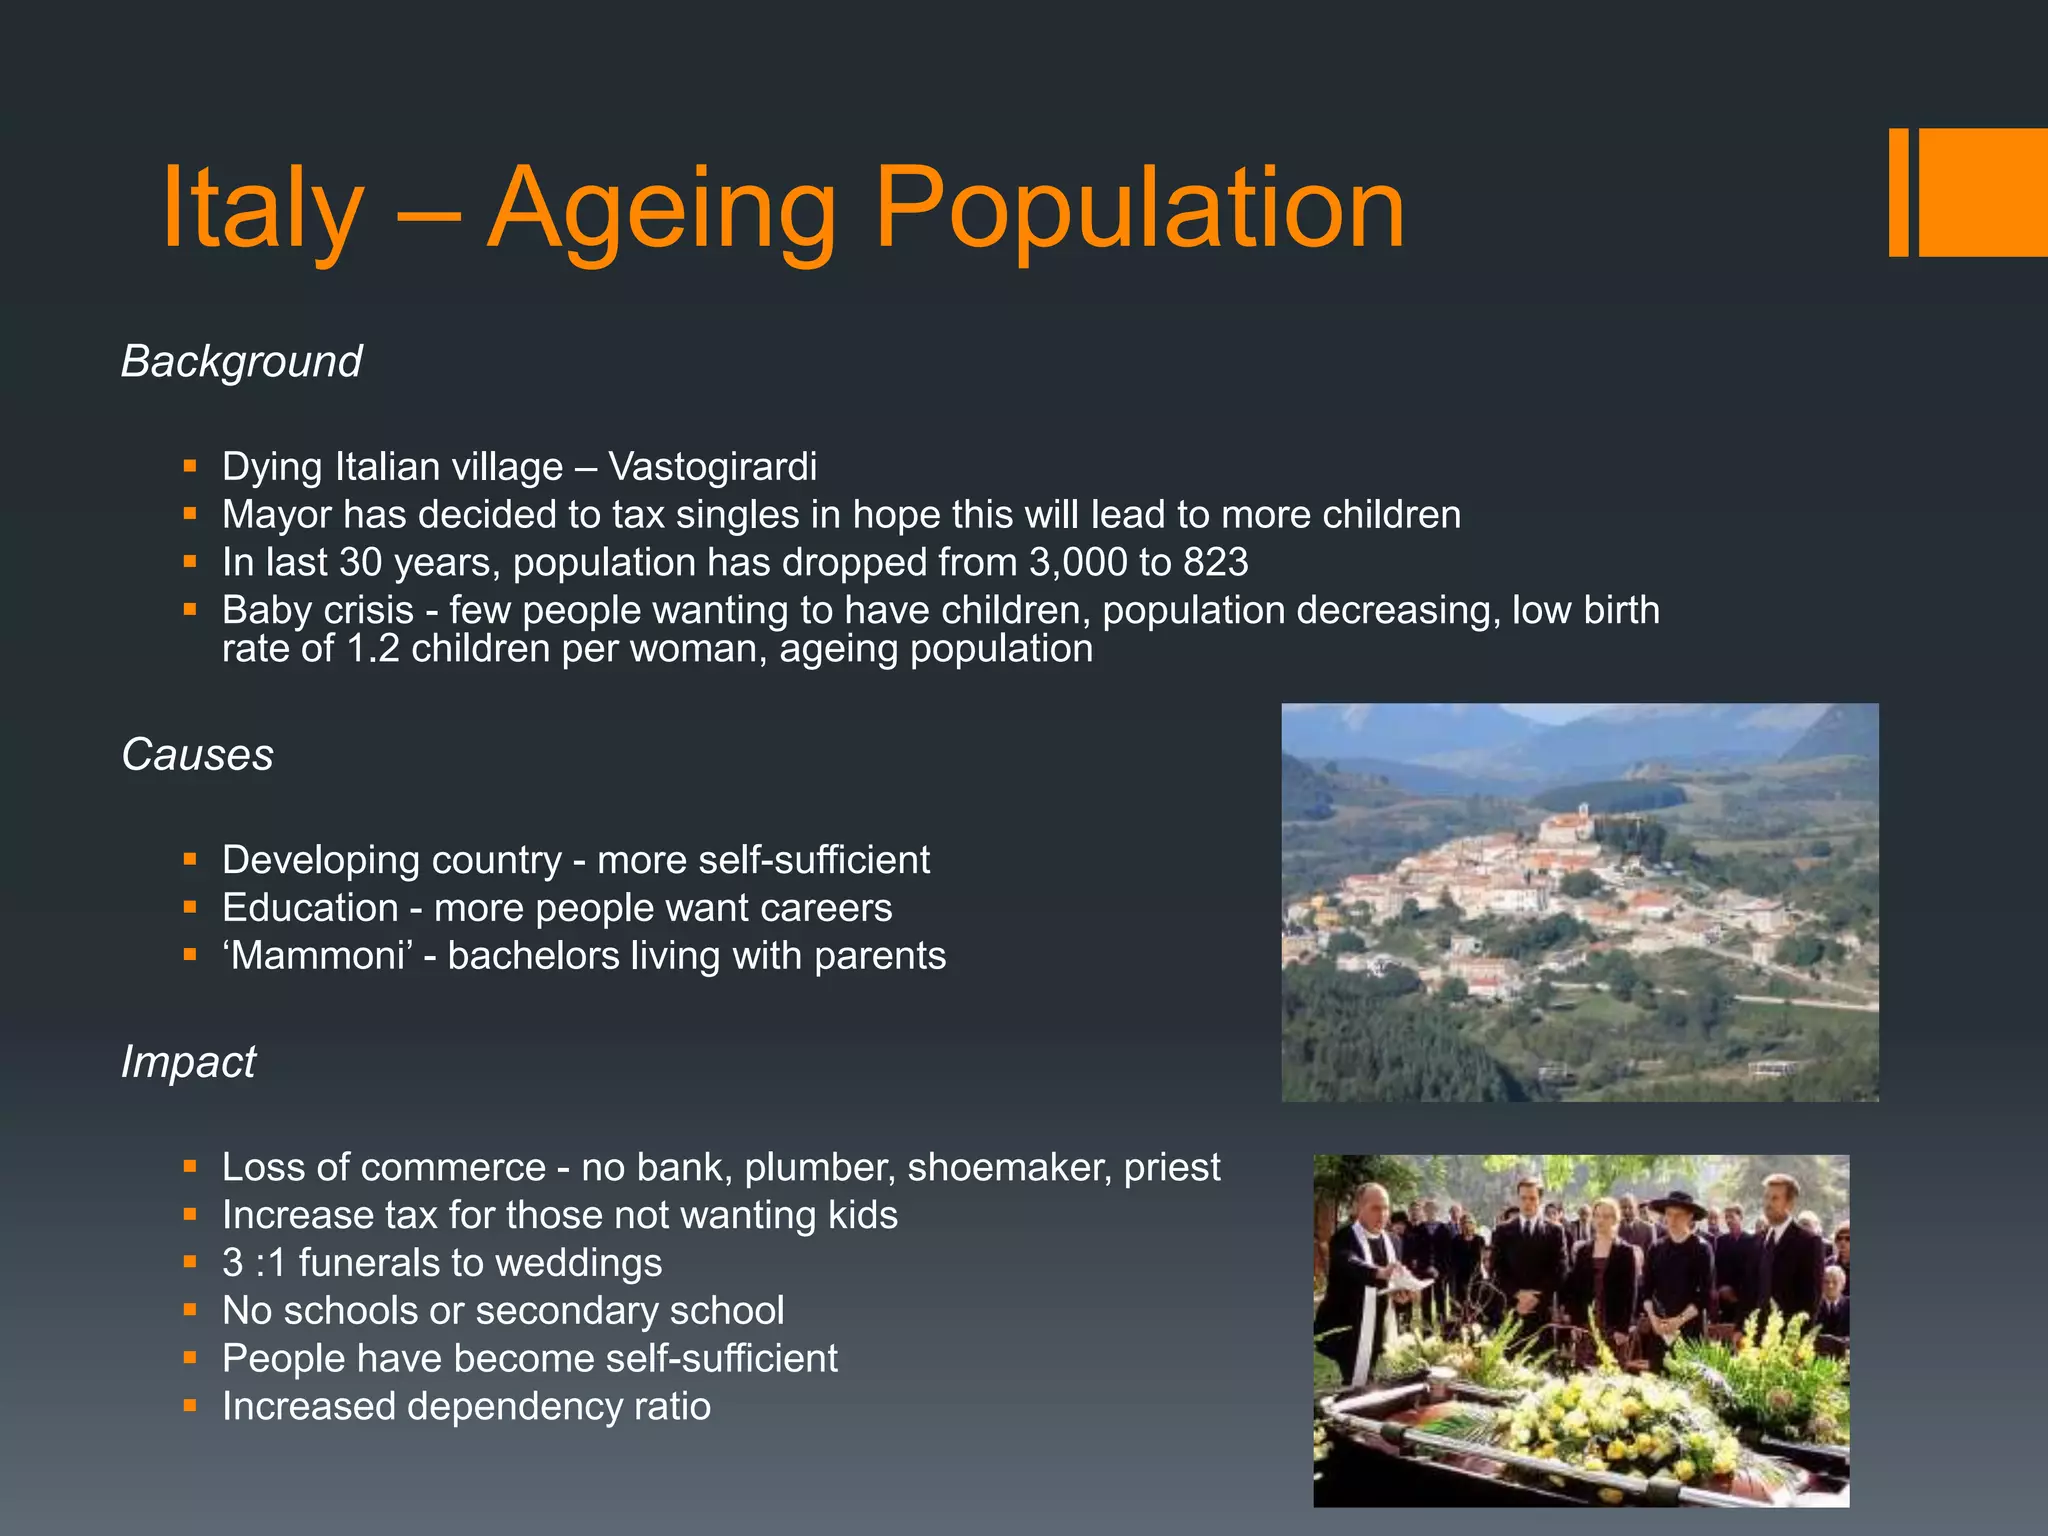
Italy – AgeingPopulation
Background
Dying Italian village – Vastogirardi
Mayor has decided to tax singles in hope this will lead to more children
In last 30 years, population has dropped from 3,000 to 823
Baby crisis - few people wanting to have children, population decreasing, low birth
rate of 1.2 children per woman, ageing population
Causes
Developing country - more self-sufficient
Education - more people want careers
‘Mammoni’ - bachelors living with parents
Impact
Loss of commerce - no bank, plumber, shoemaker, priest
Increase tax for those not wanting kids
3 :1 funerals to weddings
No schools or secondary school
People have become self-sufficient
Increased dependency ratio
9.
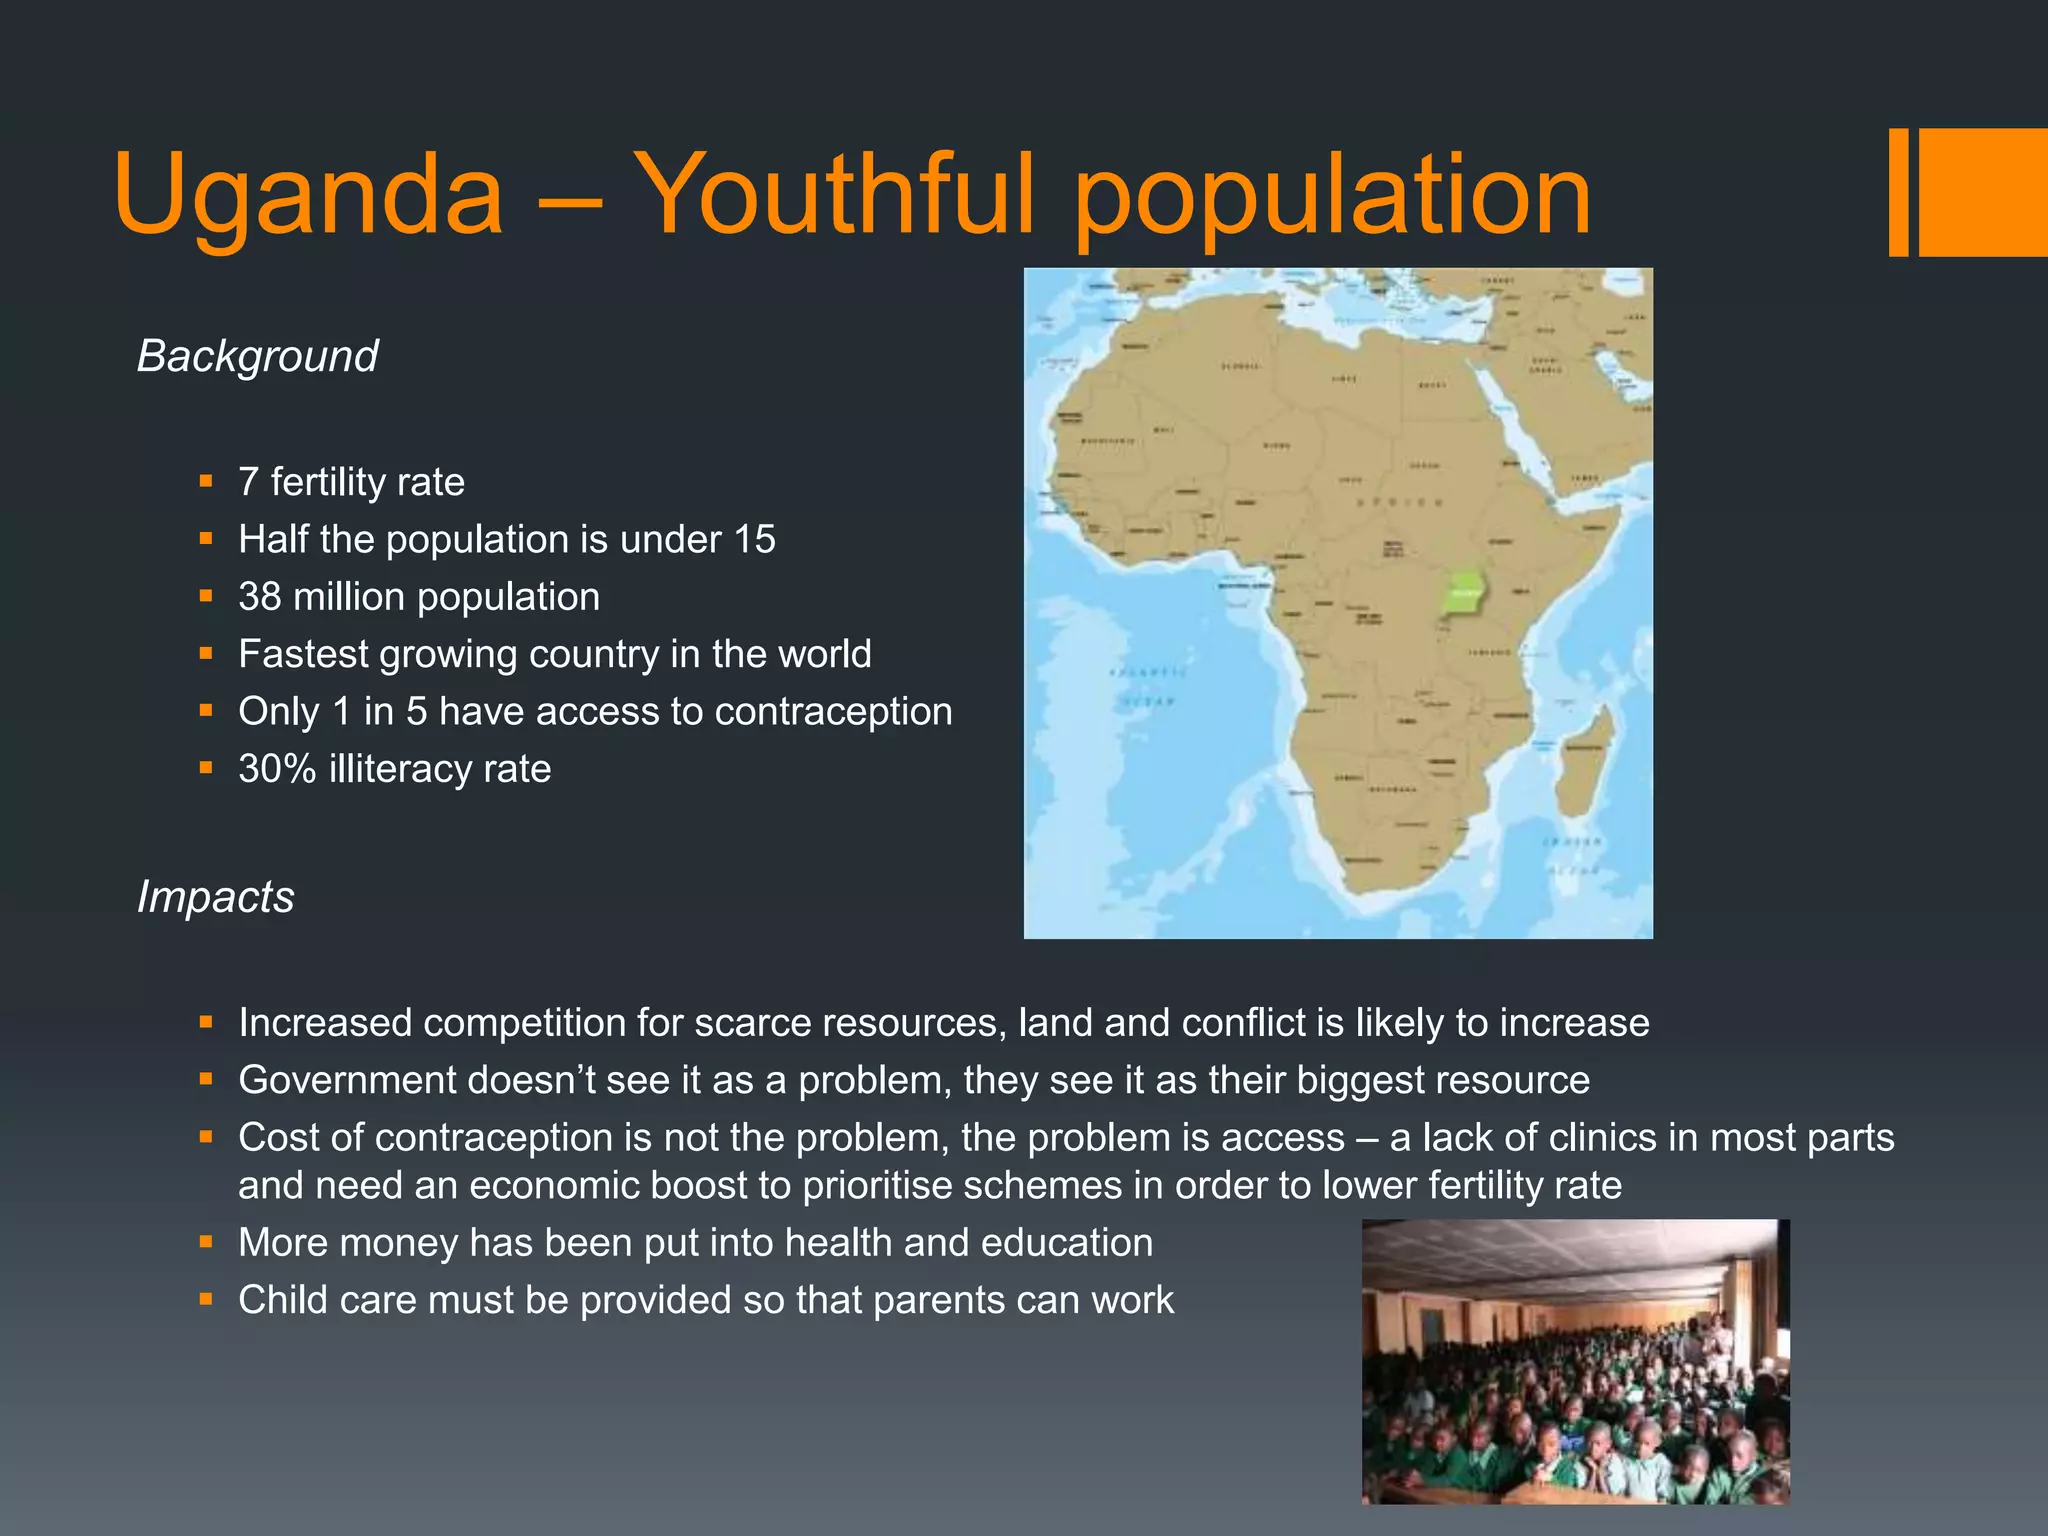
Uganda – Youthfulpopulation
Background
7 fertility rate
Half the population is under 15
38 million population
Fastest growing country in the world
Only 1 in 5 have access to contraception
30% illiteracy rate
Impacts
Increased competition for scarce resources, land and conflict is likely to increase
Government doesn’t see it as a problem, they see it as their biggest resource
Cost of contraception is not the problem, the problem is access – a lack of clinics in most parts
and need an economic boost to prioritise schemes in order to lower fertility rate
More money has been put into health and education
Child care must be provided so that parents can work
10.
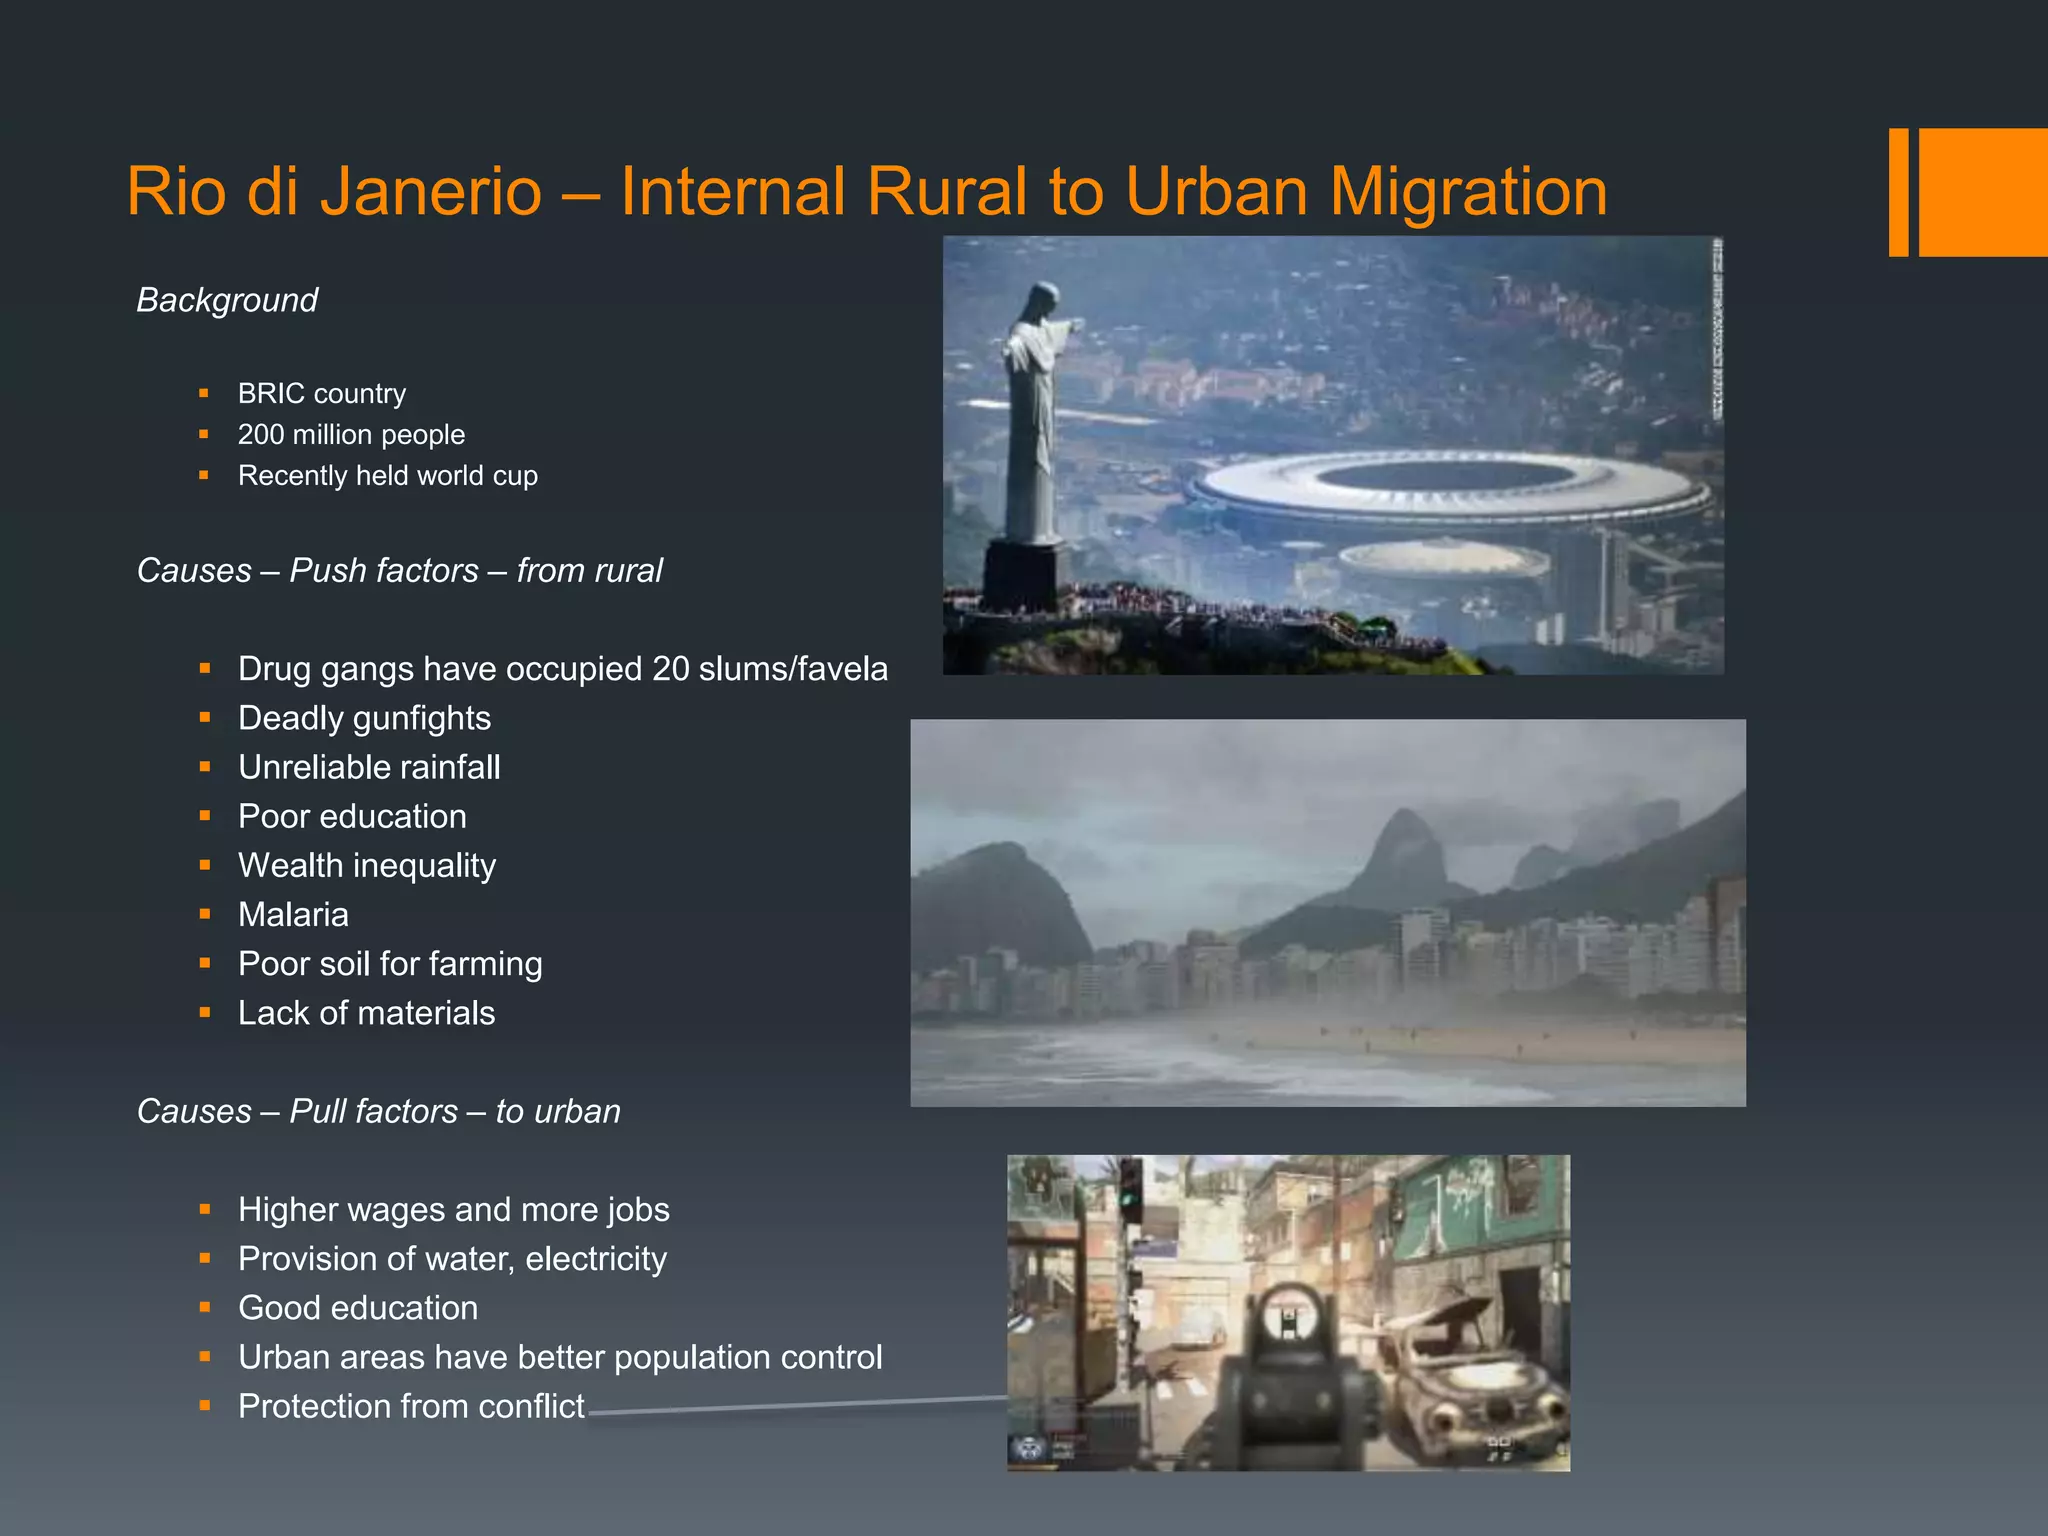
Rio di Janerio– Internal Rural to Urban Migration
Background
BRIC country
200 million people
Recently held world cup
Causes – Push factors – from rural
Drug gangs have occupied 20 slums/favela
Deadly gunfights
Unreliable rainfall
Poor education
Wealth inequality
Malaria
Poor soil for farming
Lack of materials
Causes – Pull factors – to urban
Higher wages and more jobs
Provision of water, electricity
Good education
Urban areas have better population control
Protection from conflict
11.
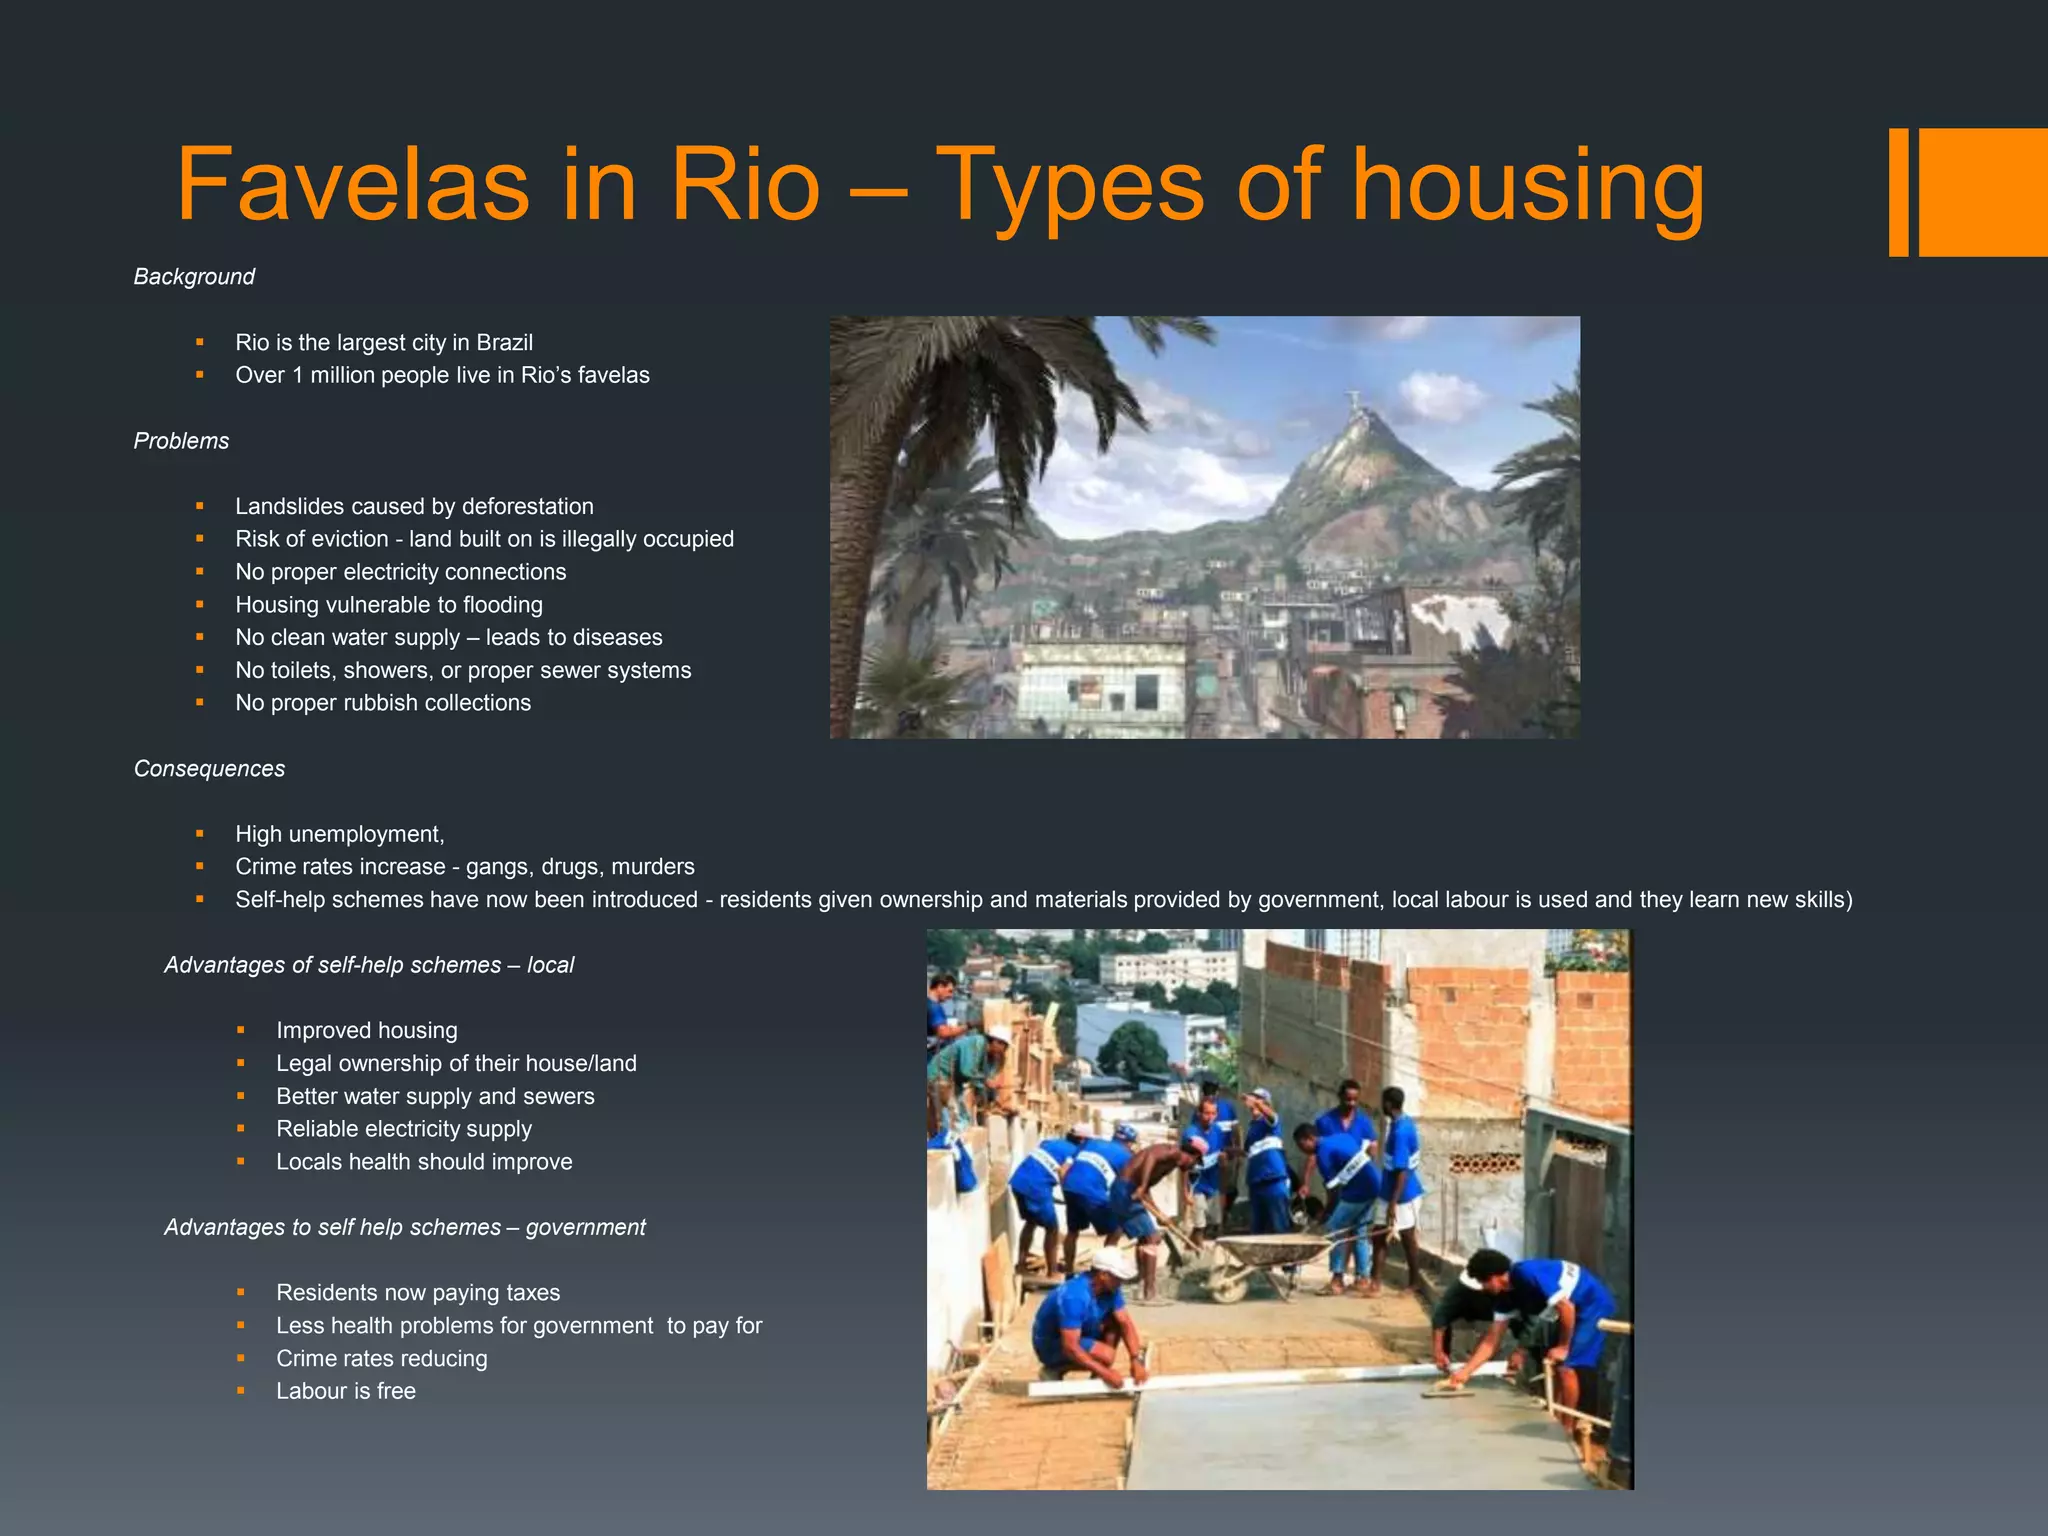
Favelas in Rio– Types of housing
Background
Rio is the largest city in Brazil
Over 1 million people live in Rio’s favelas
Problems
Landslides caused by deforestation
Risk of eviction - land built on is illegally occupied
No proper electricity connections
Housing vulnerable to flooding
No clean water supply – leads to diseases
No toilets, showers, or proper sewer systems
No proper rubbish collections
Consequences
High unemployment,
Crime rates increase - gangs, drugs, murders
Self-help schemes have now been introduced - residents given ownership and materials provided by government, local labour is used and they learn new skills)
Advantages of self-help schemes – local
Improved housing
Legal ownership of their house/land
Better water supply and sewers
Reliable electricity supply
Locals health should improve
Advantages to self help schemes – government
Residents now paying taxes
Less health problems for government to pay for
Crime rates reducing
Labour is free
12.
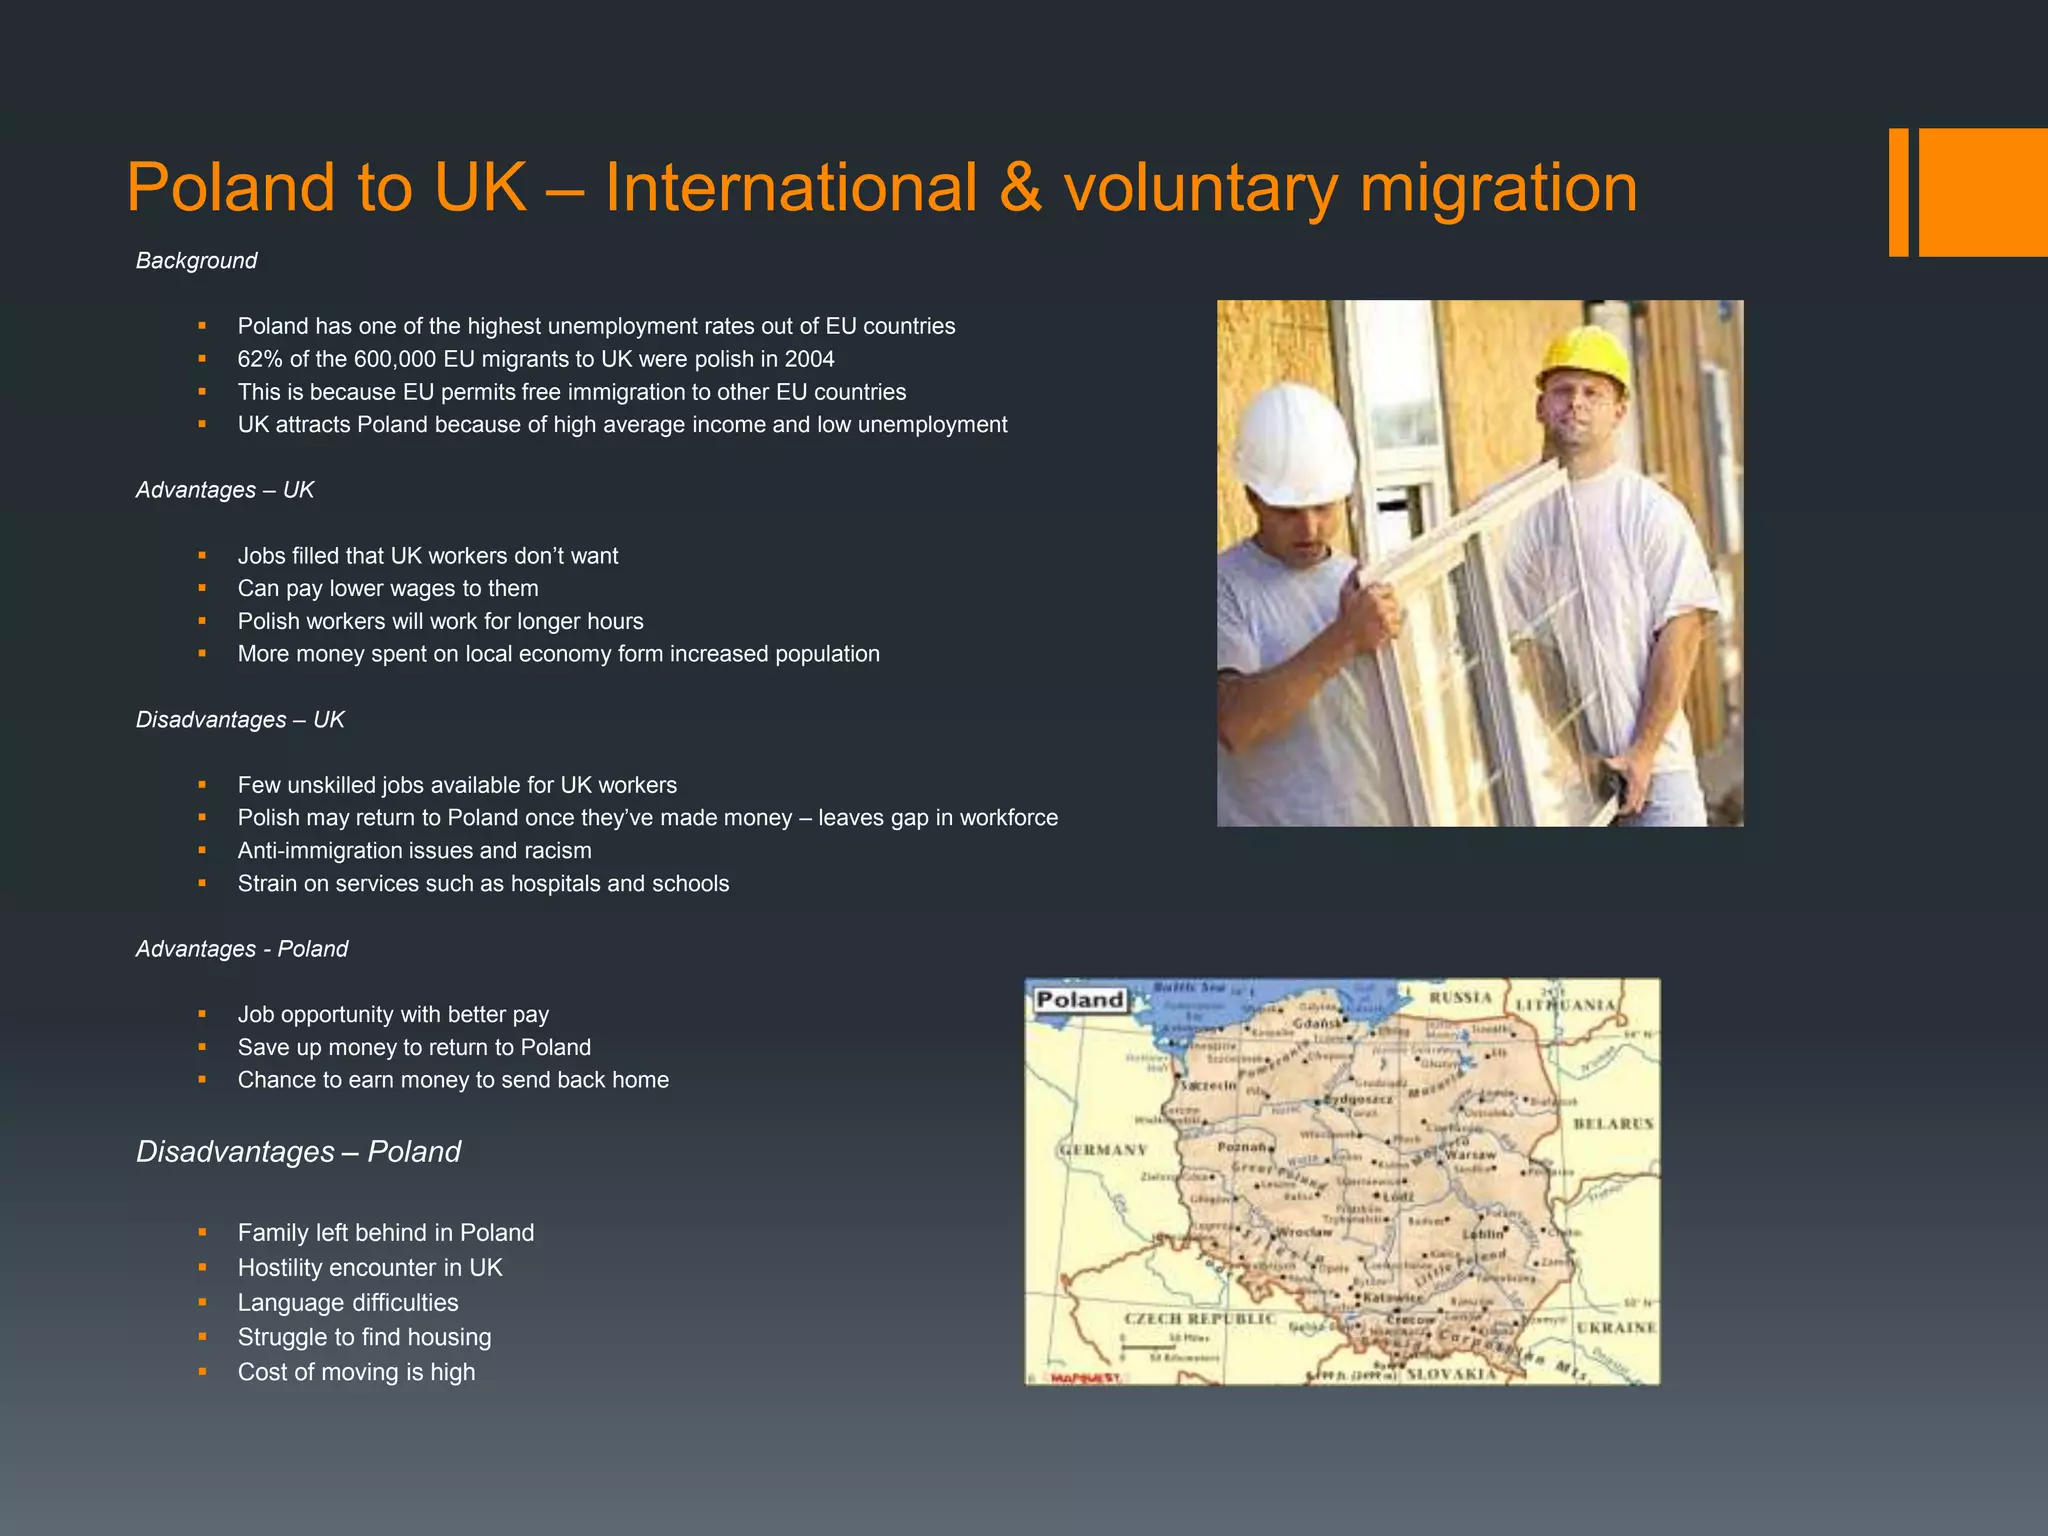
Poland to UK– International & voluntary migration
Background
Poland has one of the highest unemployment rates out of EU countries
62% of the 600,000 EU migrants to UK were polish in 2004
This is because EU permits free immigration to other EU countries
UK attracts Poland because of high average income and low unemployment
Advantages – UK
Jobs filled that UK workers don’t want
Can pay lower wages to them
Polish workers will work for longer hours
More money spent on local economy form increased population
Disadvantages – UK
Few unskilled jobs available for UK workers
Polish may return to Poland once they’ve made money – leaves gap in workforce
Anti-immigration issues and racism
Strain on services such as hospitals and schools
Advantages - Poland
Job opportunity with better pay
Save up money to return to Poland
Chance to earn money to send back home
Disadvantages – Poland
Family left behind in Poland
Hostility encounter in UK
Language difficulties
Struggle to find housing
Cost of moving is high
13.
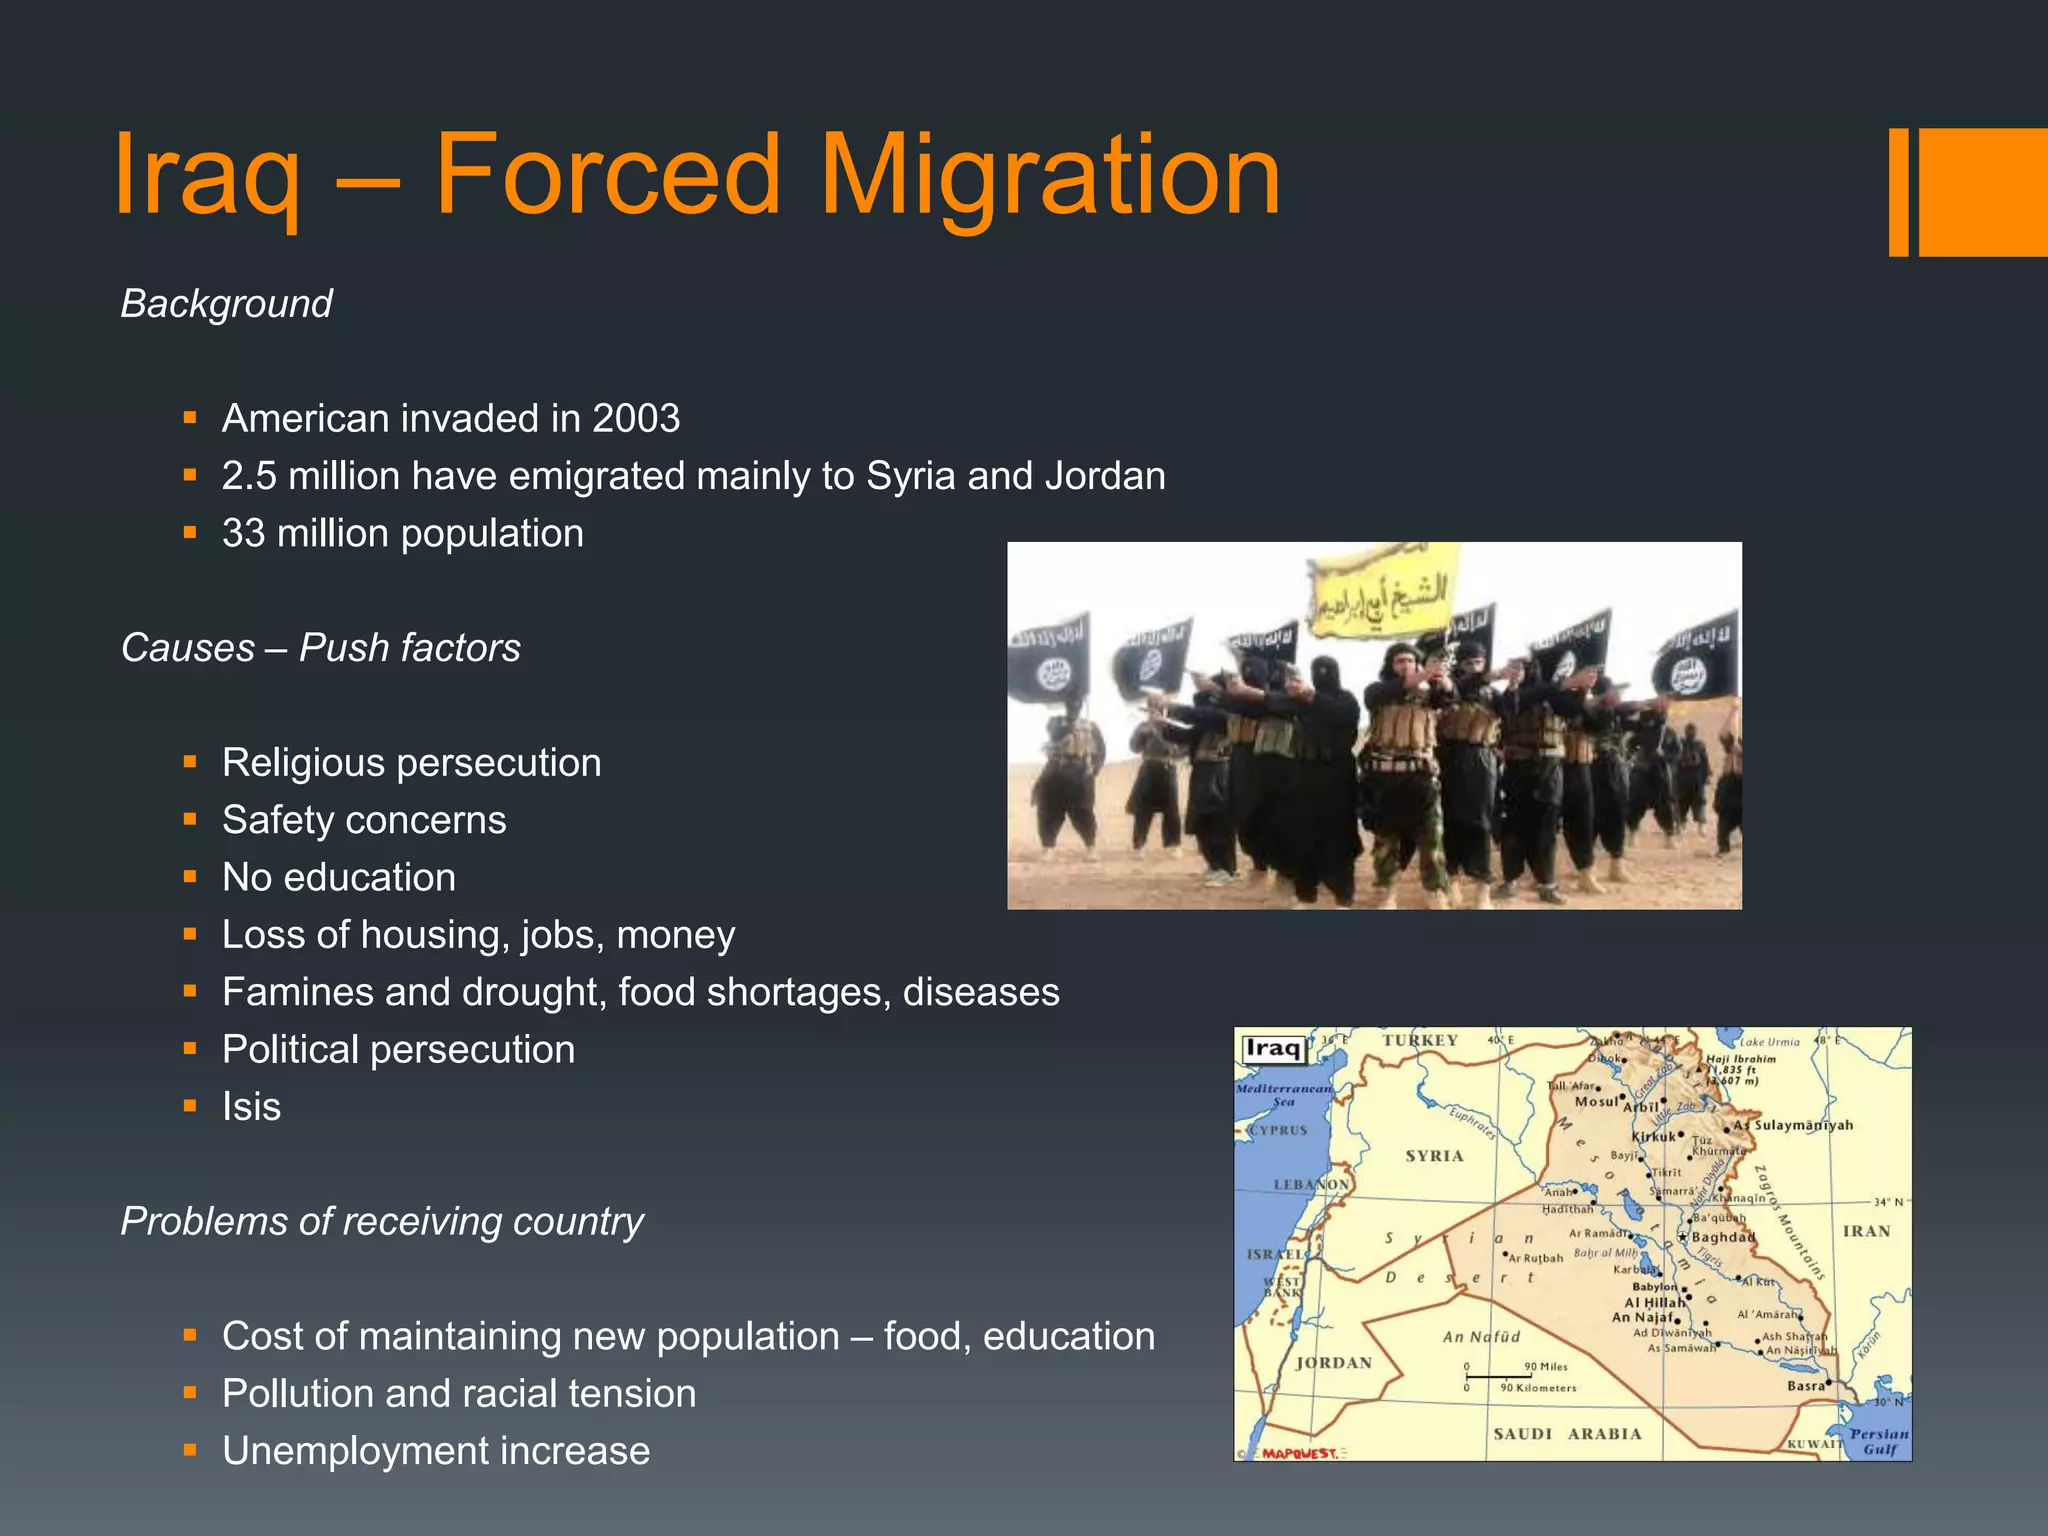
Iraq – ForcedMigration
Background
American invaded in 2003
2.5 million have emigrated mainly to Syria and Jordan
33 million population
Causes – Push factors
Religious persecution
Safety concerns
No education
Loss of housing, jobs, money
Famines and drought, food shortages, diseases
Political persecution
Isis
Problems of receiving country
Cost of maintaining new population – food, education
Pollution and racial tension
Unemployment increase
14.
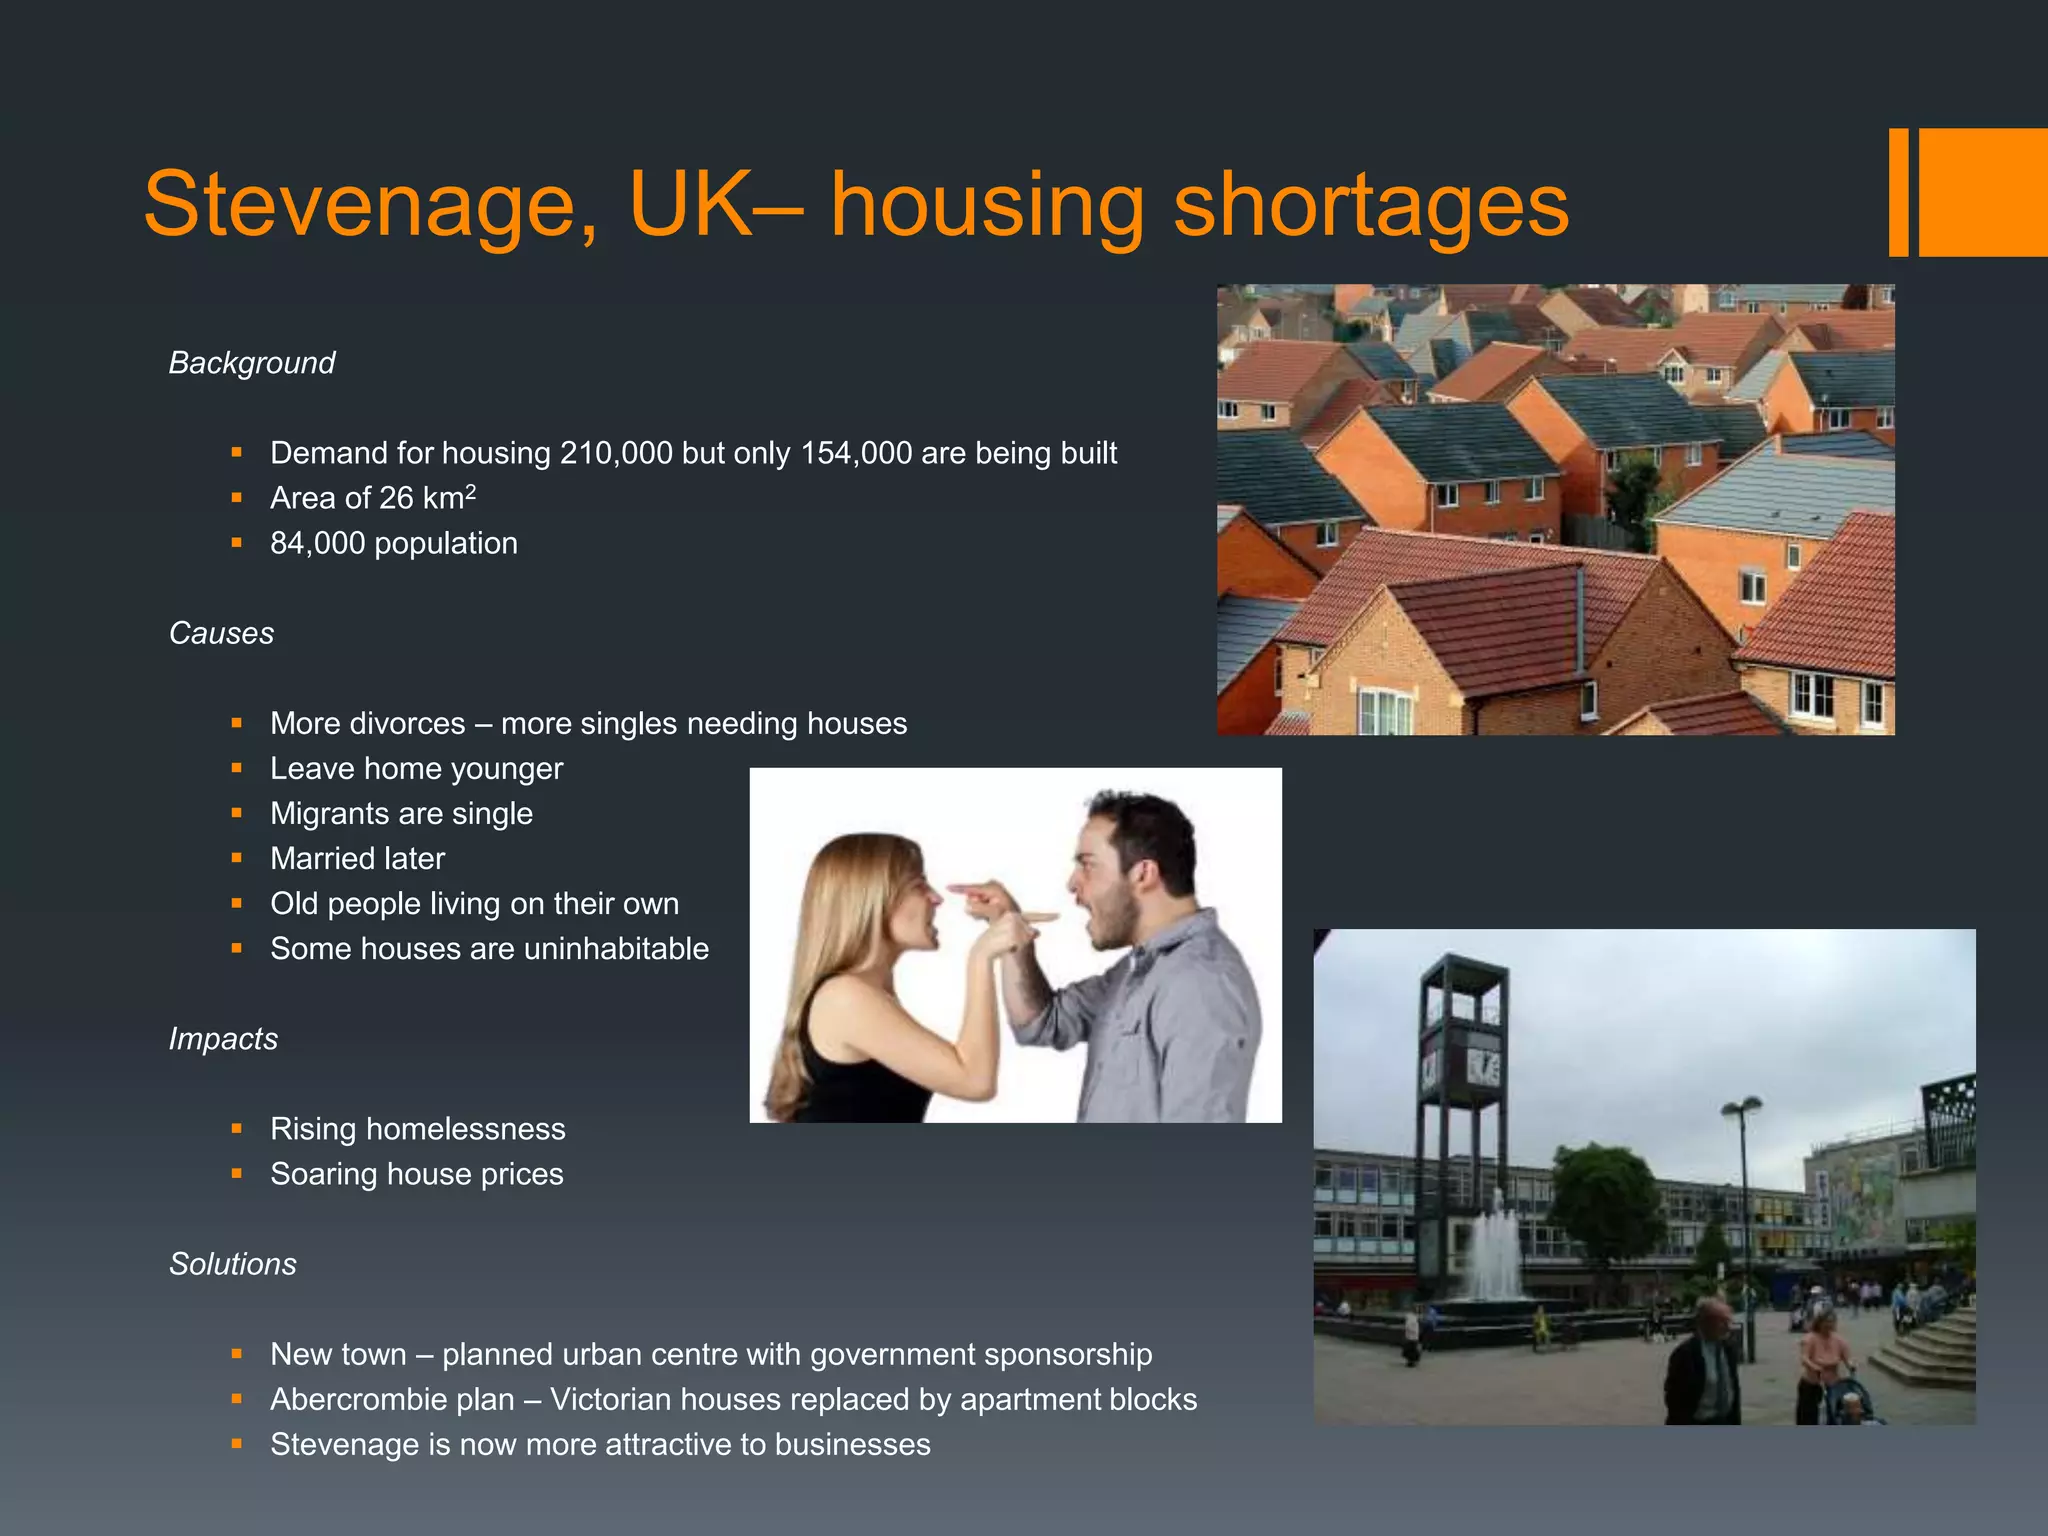
Stevenage, UK– housingshortages
Background
Demand for housing 210,000 but only 154,000 are being built
Area of 26 km2
84,000 population
Causes
More divorces – more singles needing houses
Leave home younger
Migrants are single
Married later
Old people living on their own
Some houses are uninhabitable
Impacts
Rising homelessness
Soaring house prices
Solutions
New town – planned urban centre with government sponsorship
Abercrombie plan – Victorian houses replaced by apartment blocks
Stevenage is now more attractive to businesses
15.
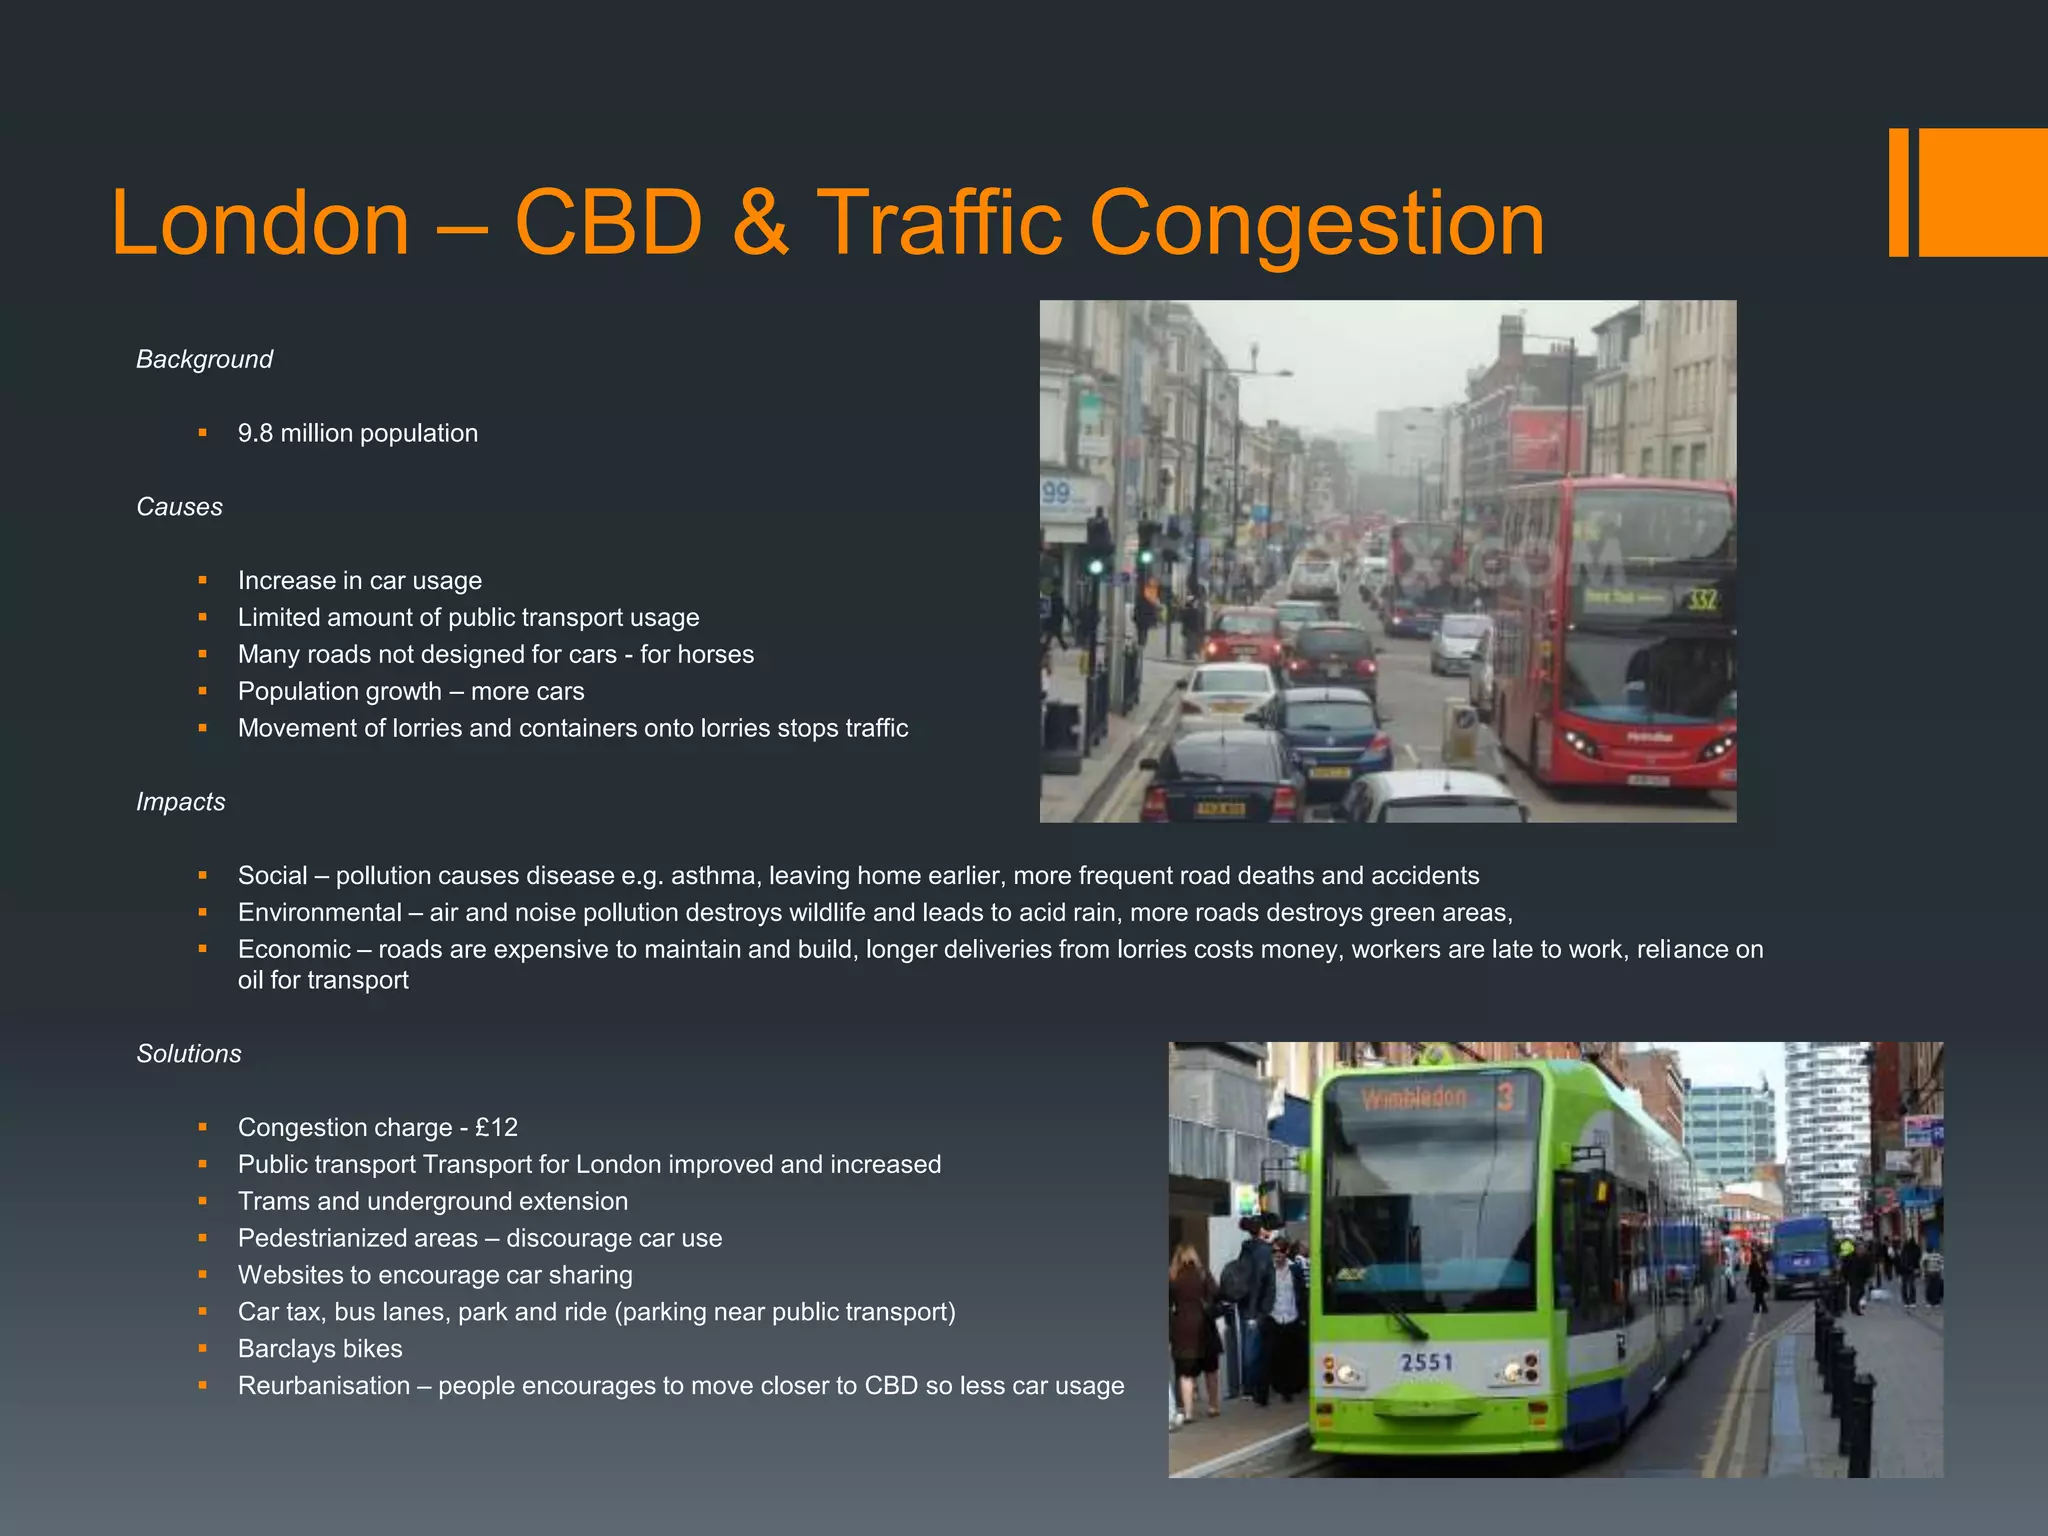
London – CBD& Traffic Congestion
Background
9.8 million population
Causes
Increase in car usage
Limited amount of public transport usage
Many roads not designed for cars - for horses
Population growth – more cars
Movement of lorries and containers onto lorries stops traffic
Impacts
Social – pollution causes disease e.g. asthma, leaving home earlier, more frequent road deaths and accidents
Environmental – air and noise pollution destroys wildlife and leads to acid rain, more roads destroys green areas,
Economic – roads are expensive to maintain and build, longer deliveries from lorries costs money, workers are late to work, reliance on
oil for transport
Solutions
Congestion charge - £12
Public transport Transport for London improved and increased
Trams and underground extension
Pedestrianized areas – discourage car use
Websites to encourage car sharing
Car tax, bus lanes, park and ride (parking near public transport)
Barclays bikes
Reurbanisation – people encourages to move closer to CBD so less car usage
16.
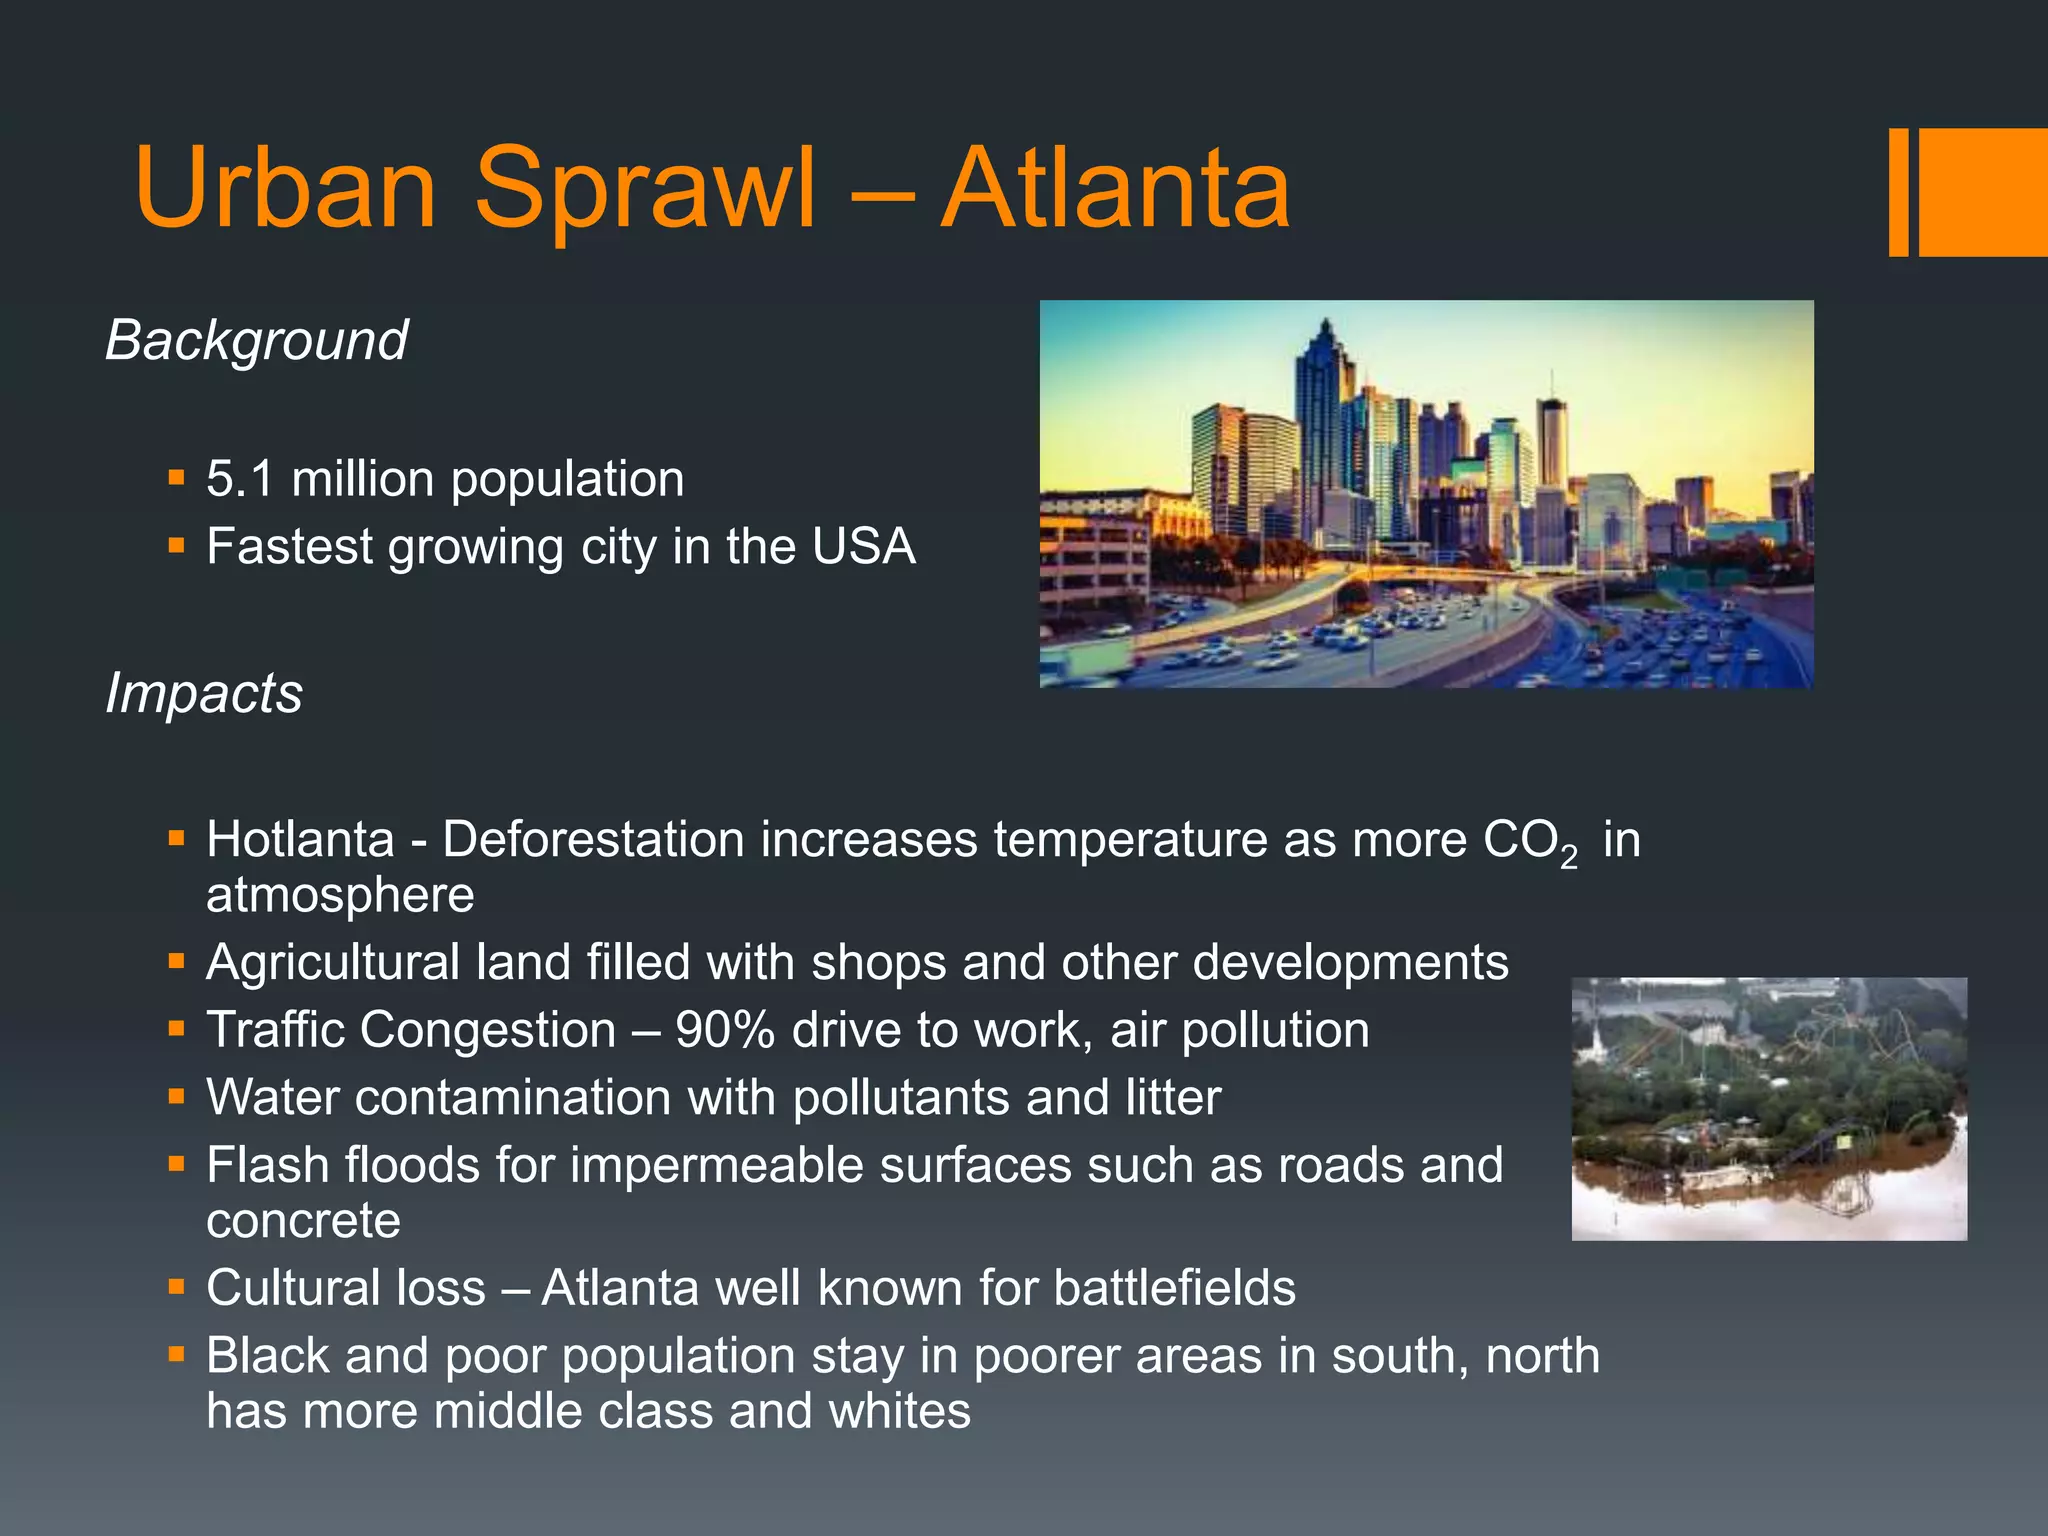
Urban Sprawl –Atlanta
Background
5.1 million population
Fastest growing city in the USA
Impacts
Hotlanta - Deforestation increases temperature as more CO2 in
atmosphere
Agricultural land filled with shops and other developments
Traffic Congestion – 90% drive to work, air pollution
Water contamination with pollutants and litter
Flash floods for impermeable surfaces such as roads and
concrete
Cultural loss – Atlanta well known for battlefields
Black and poor population stay in poorer areas in south, north
has more middle class and whites
17.
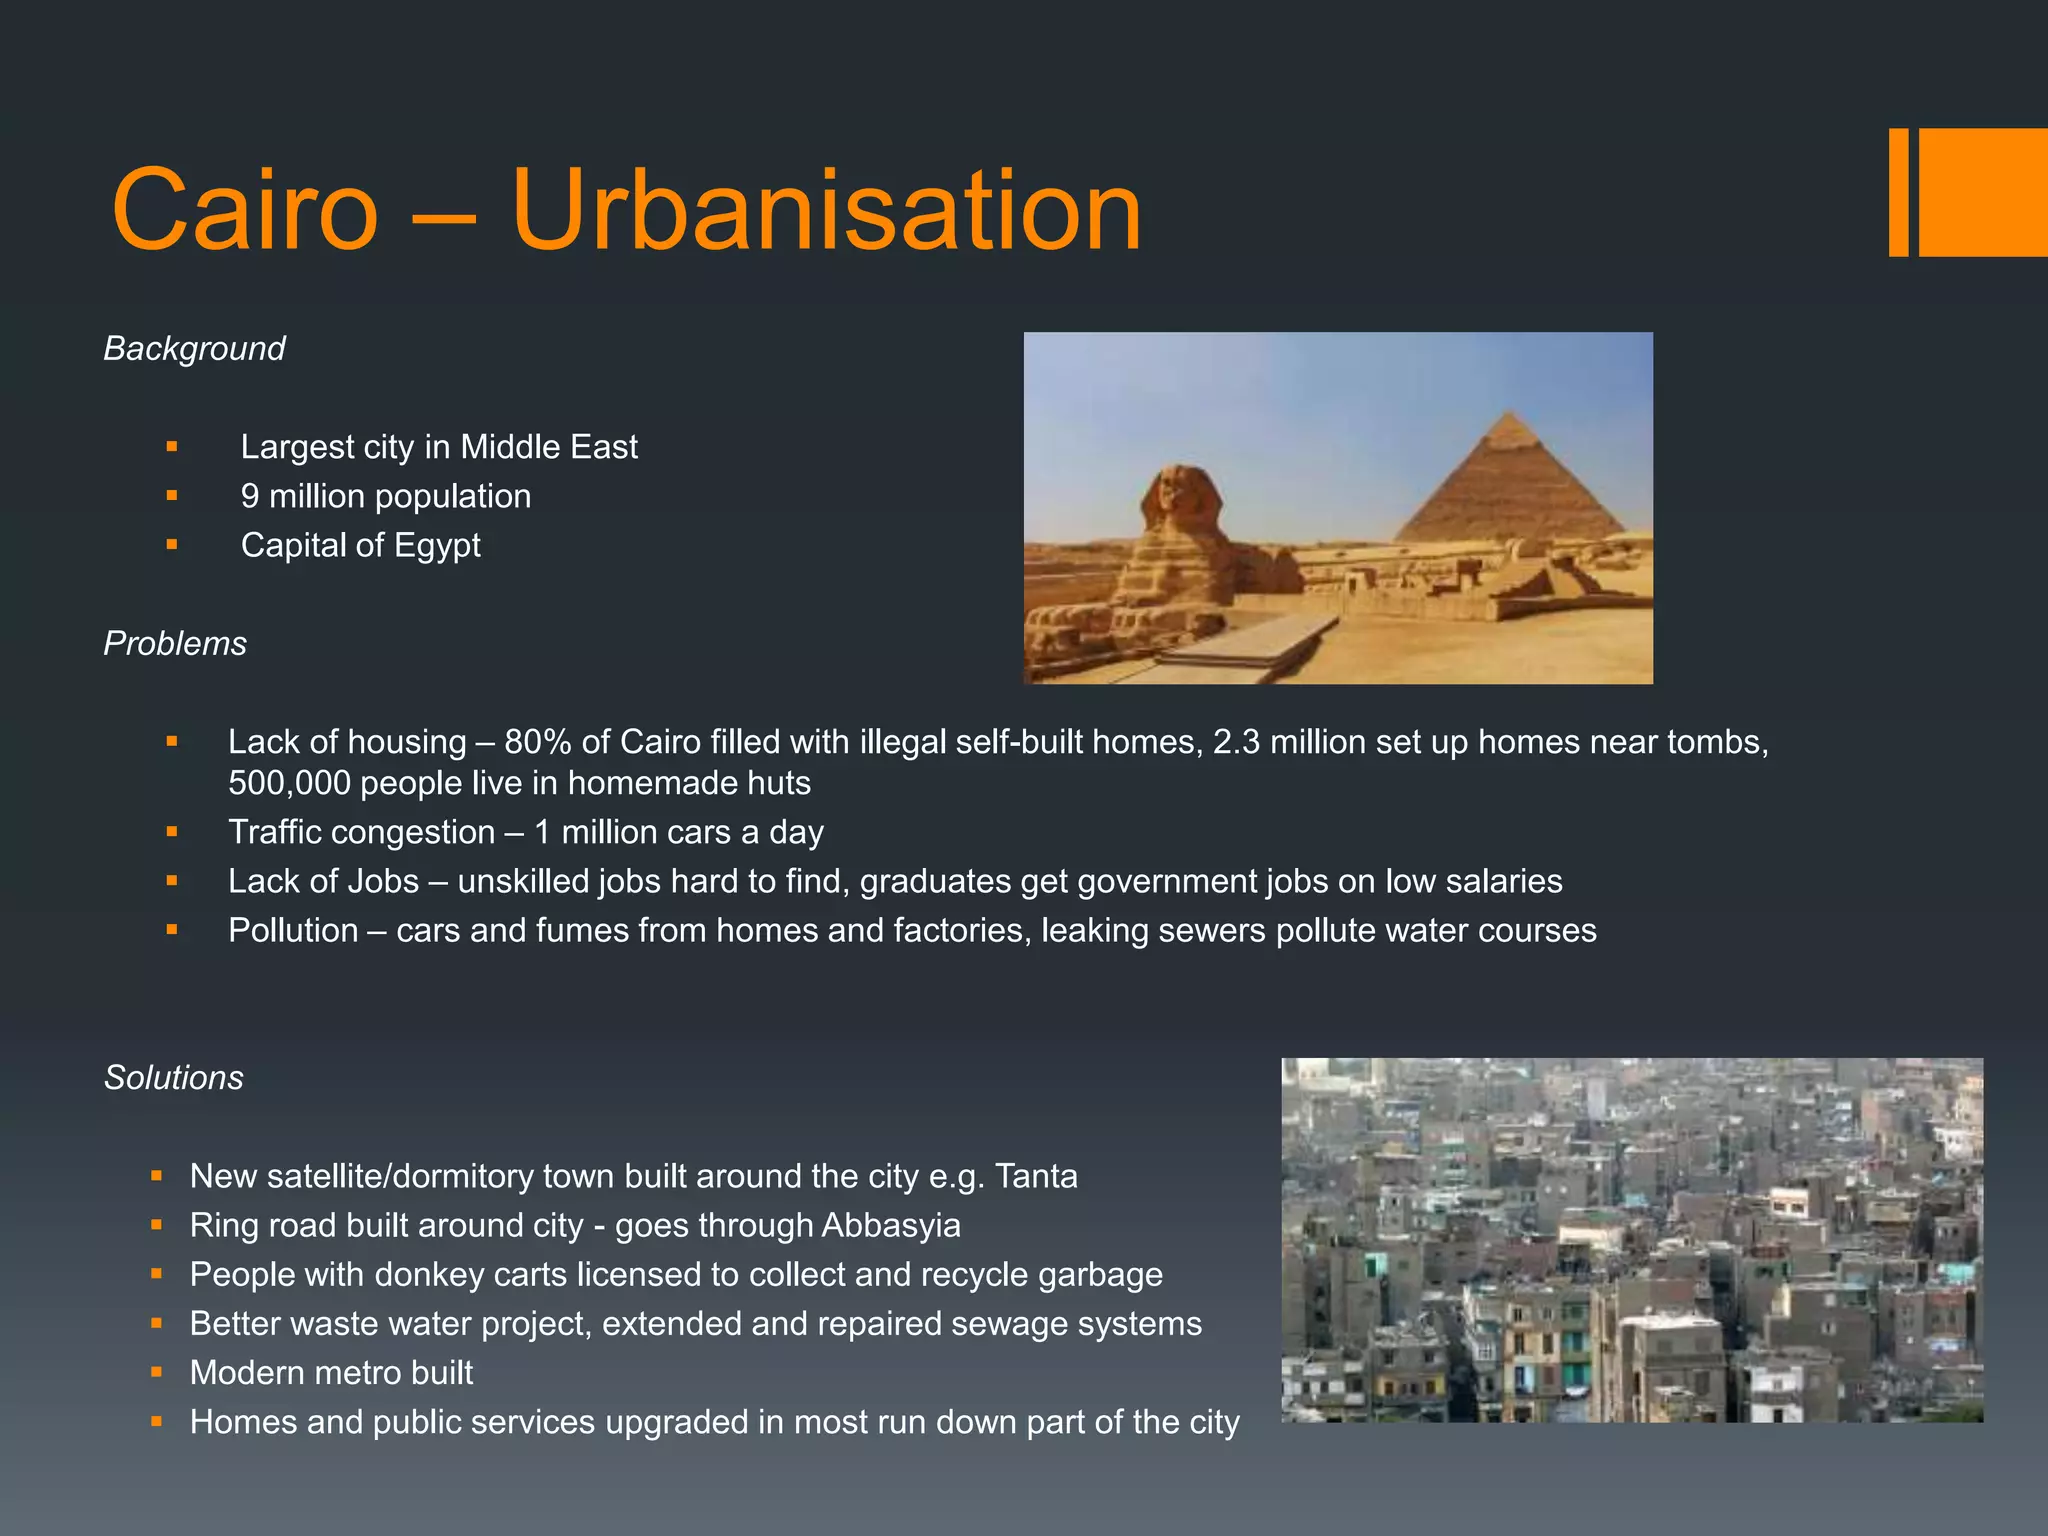
Cairo – Urbanisation
Background
Largest city in Middle East
9 million population
Capital of Egypt
Problems
Lack of housing – 80% of Cairo filled with illegal self-built homes, 2.3 million set up homes near tombs,
500,000 people live in homemade huts
Traffic congestion – 1 million cars a day
Lack of Jobs – unskilled jobs hard to find, graduates get government jobs on low salaries
Pollution – cars and fumes from homes and factories, leaking sewers pollute water courses
Solutions
New satellite/dormitory town built around the city e.g. Tanta
Ring road built around city - goes through Abbasyia
People with donkey carts licensed to collect and recycle garbage
Better waste water project, extended and repaired sewage systems
Modern metro built
Homes and public services upgraded in most run down part of the city
18.
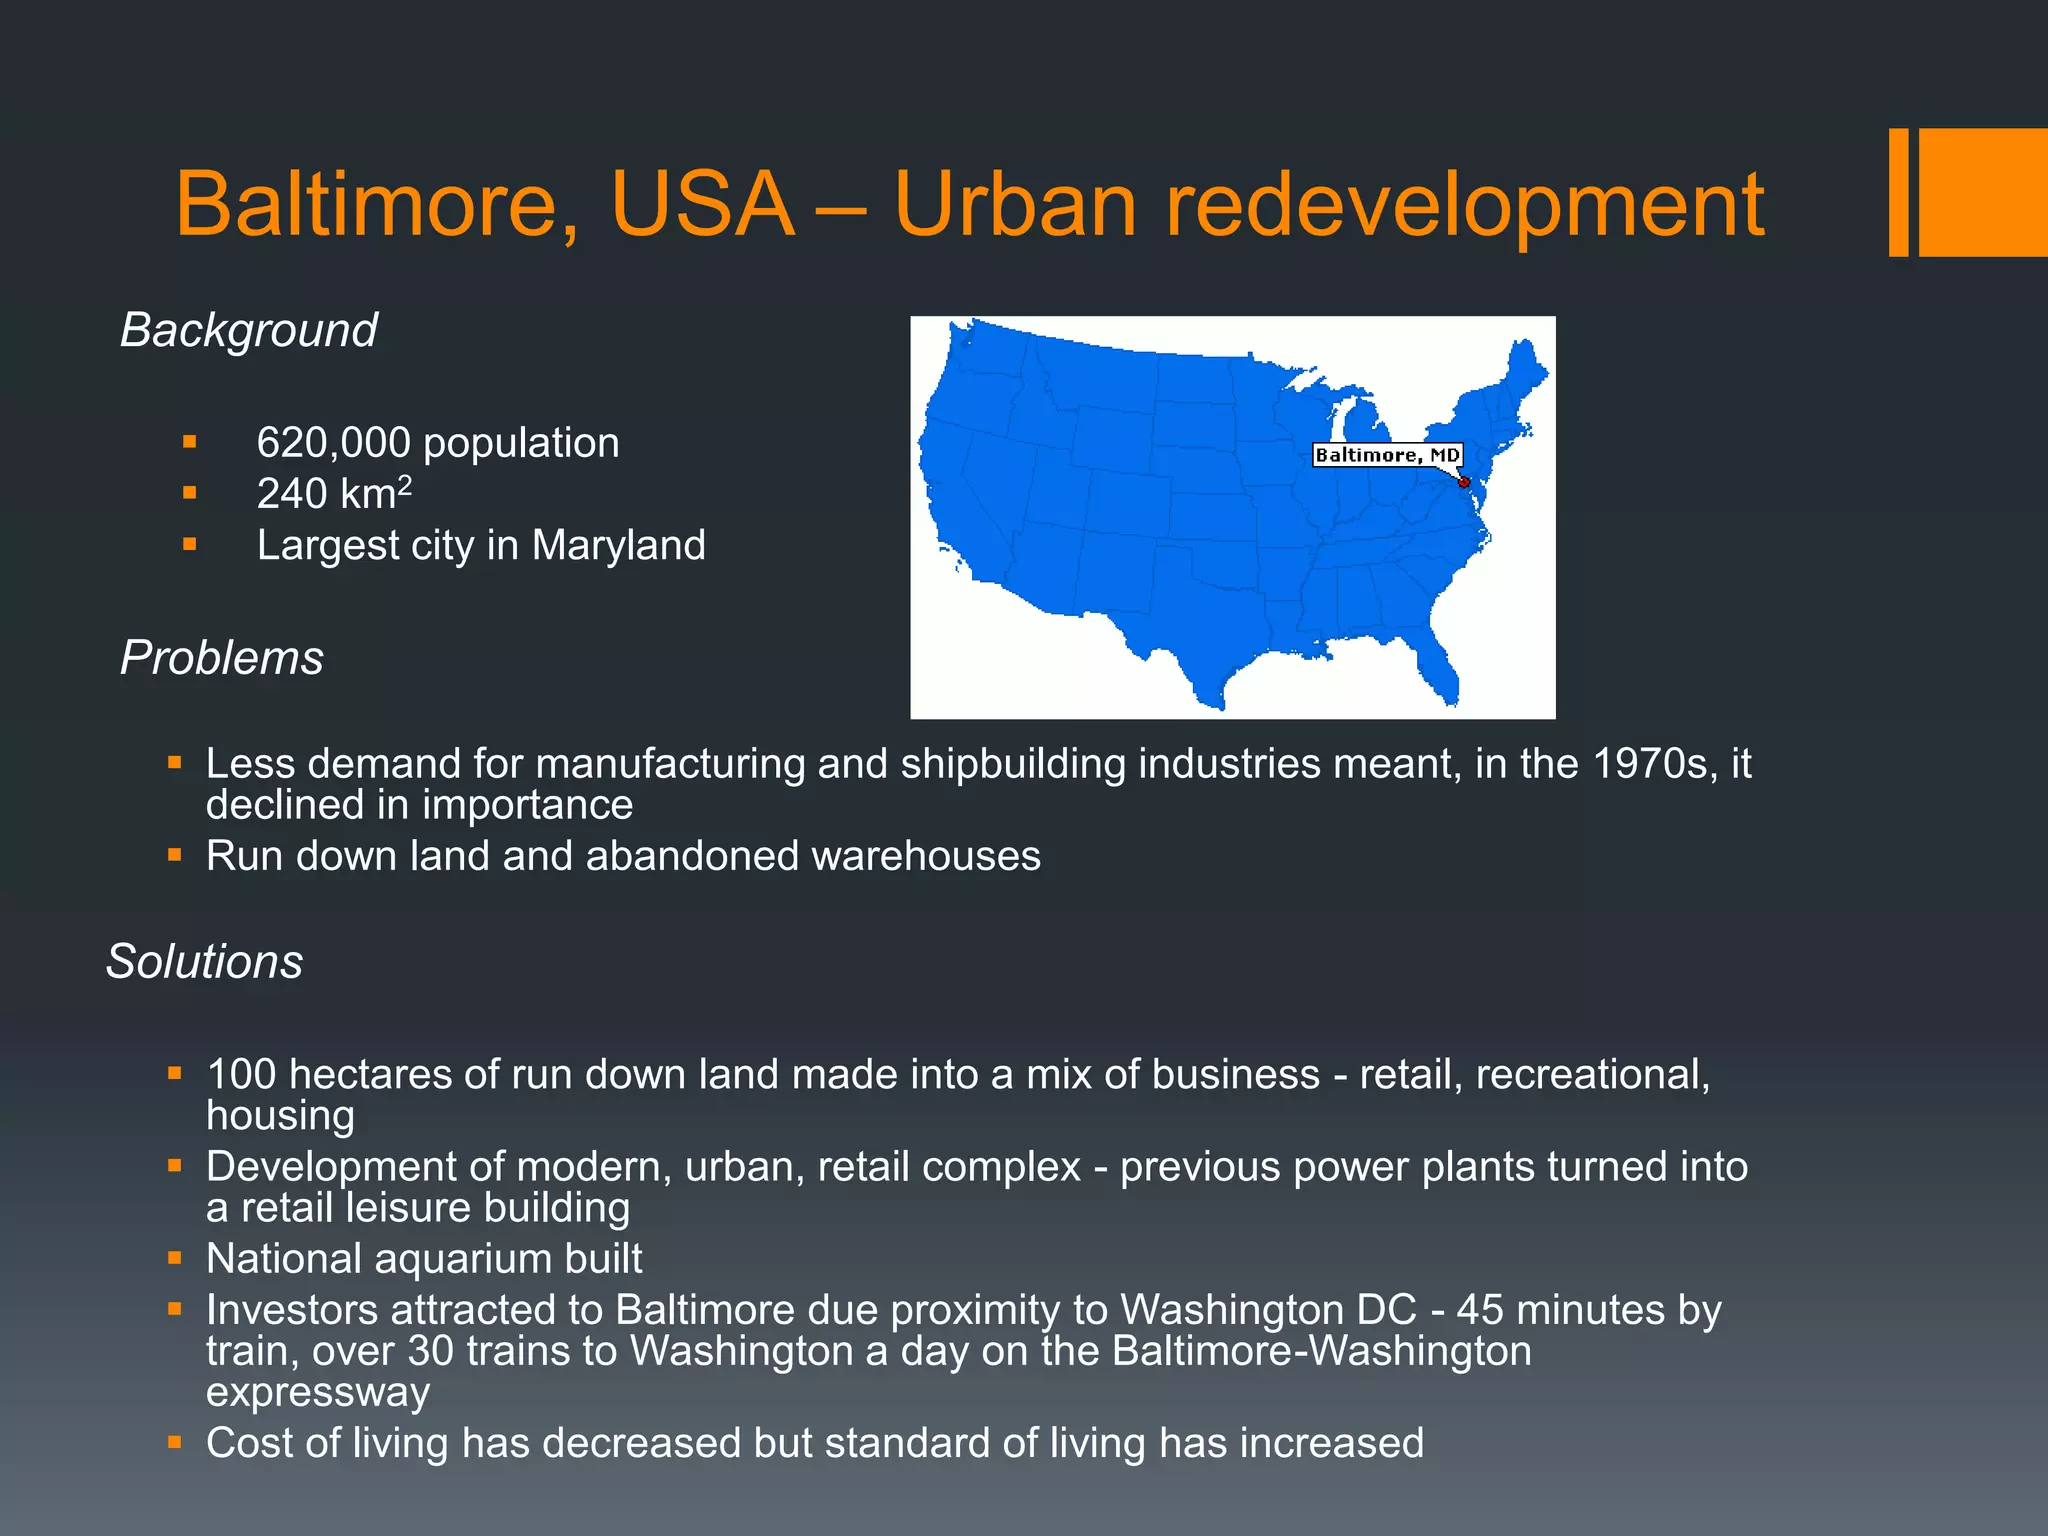
Baltimore, USA –Urban redevelopment
Background
620,000 population
240 km2
Largest city in Maryland
Problems
Less demand for manufacturing and shipbuilding industries meant, in the 1970s, it
declined in importance
Run down land and abandoned warehouses
Solutions
100 hectares of run down land made into a mix of business - retail, recreational,
housing
Development of modern, urban, retail complex - previous power plants turned into
a retail leisure building
National aquarium built
Investors attracted to Baltimore due proximity to Washington DC - 45 minutes by
train, over 30 trains to Washington a day on the Baltimore-Washington
expressway
Cost of living has decreased but standard of living has increased
19.
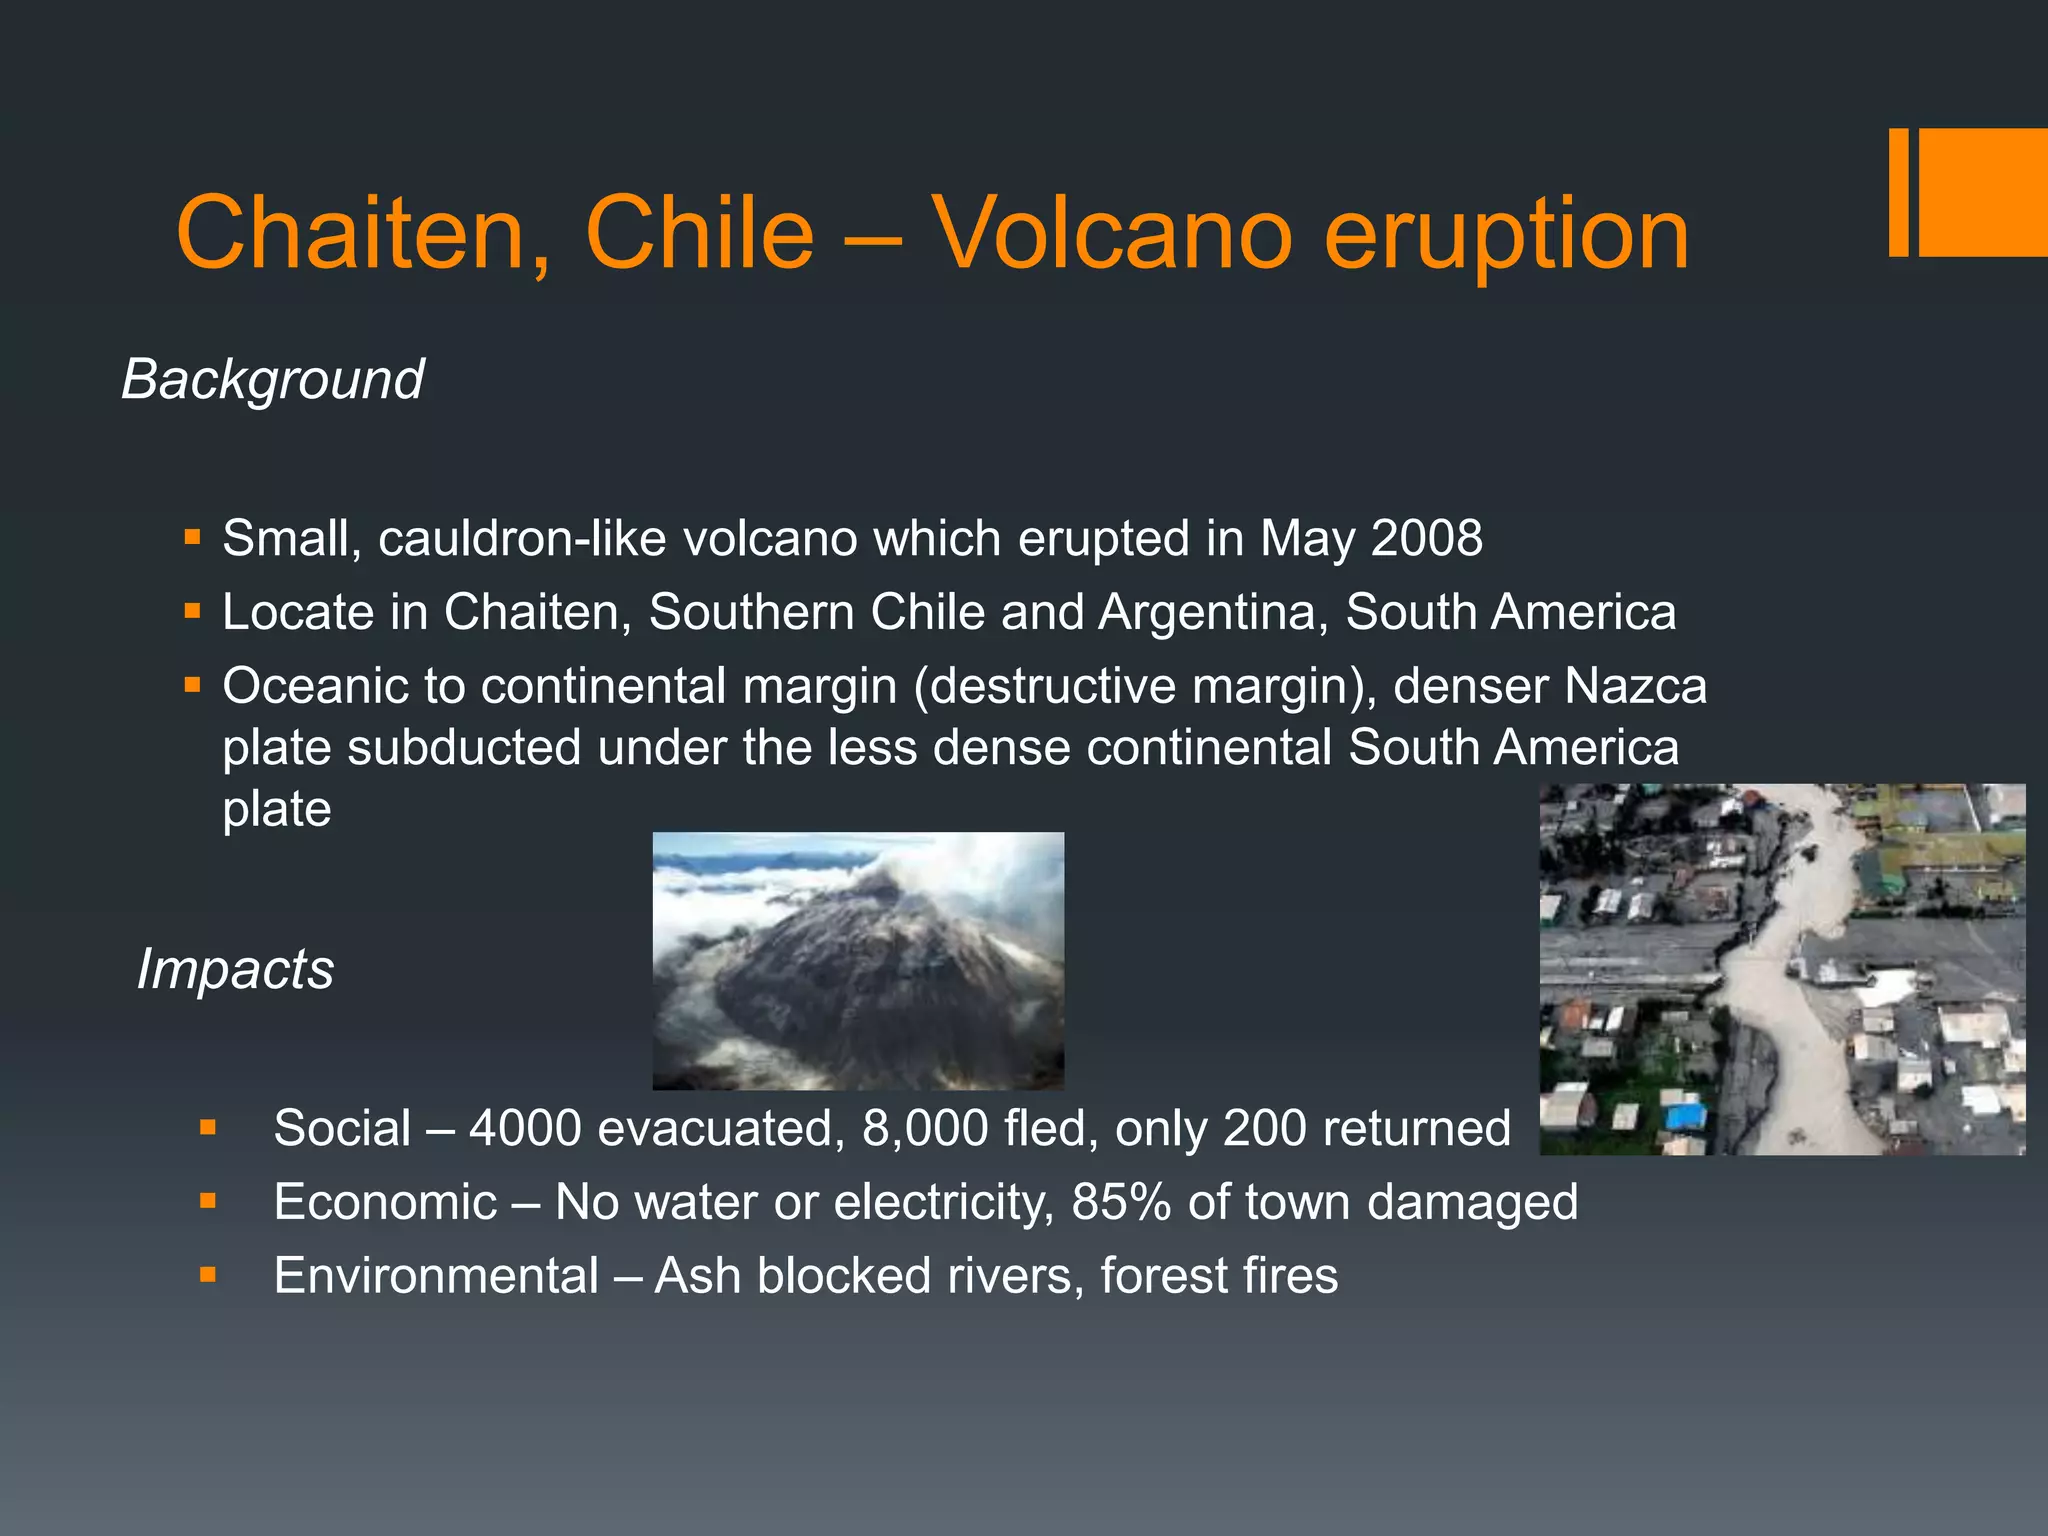
Chaiten, Chile –Volcano eruption
Background
Small, cauldron-like volcano which erupted in May 2008
Locate in Chaiten, Southern Chile and Argentina, South America
Oceanic to continental margin (destructive margin), denser Nazca
plate subducted under the less dense continental South America
plate
Impacts
Social – 4000 evacuated, 8,000 fled, only 200 returned
Economic – No water or electricity, 85% of town damaged
Environmental – Ash blocked rivers, forest fires
20.
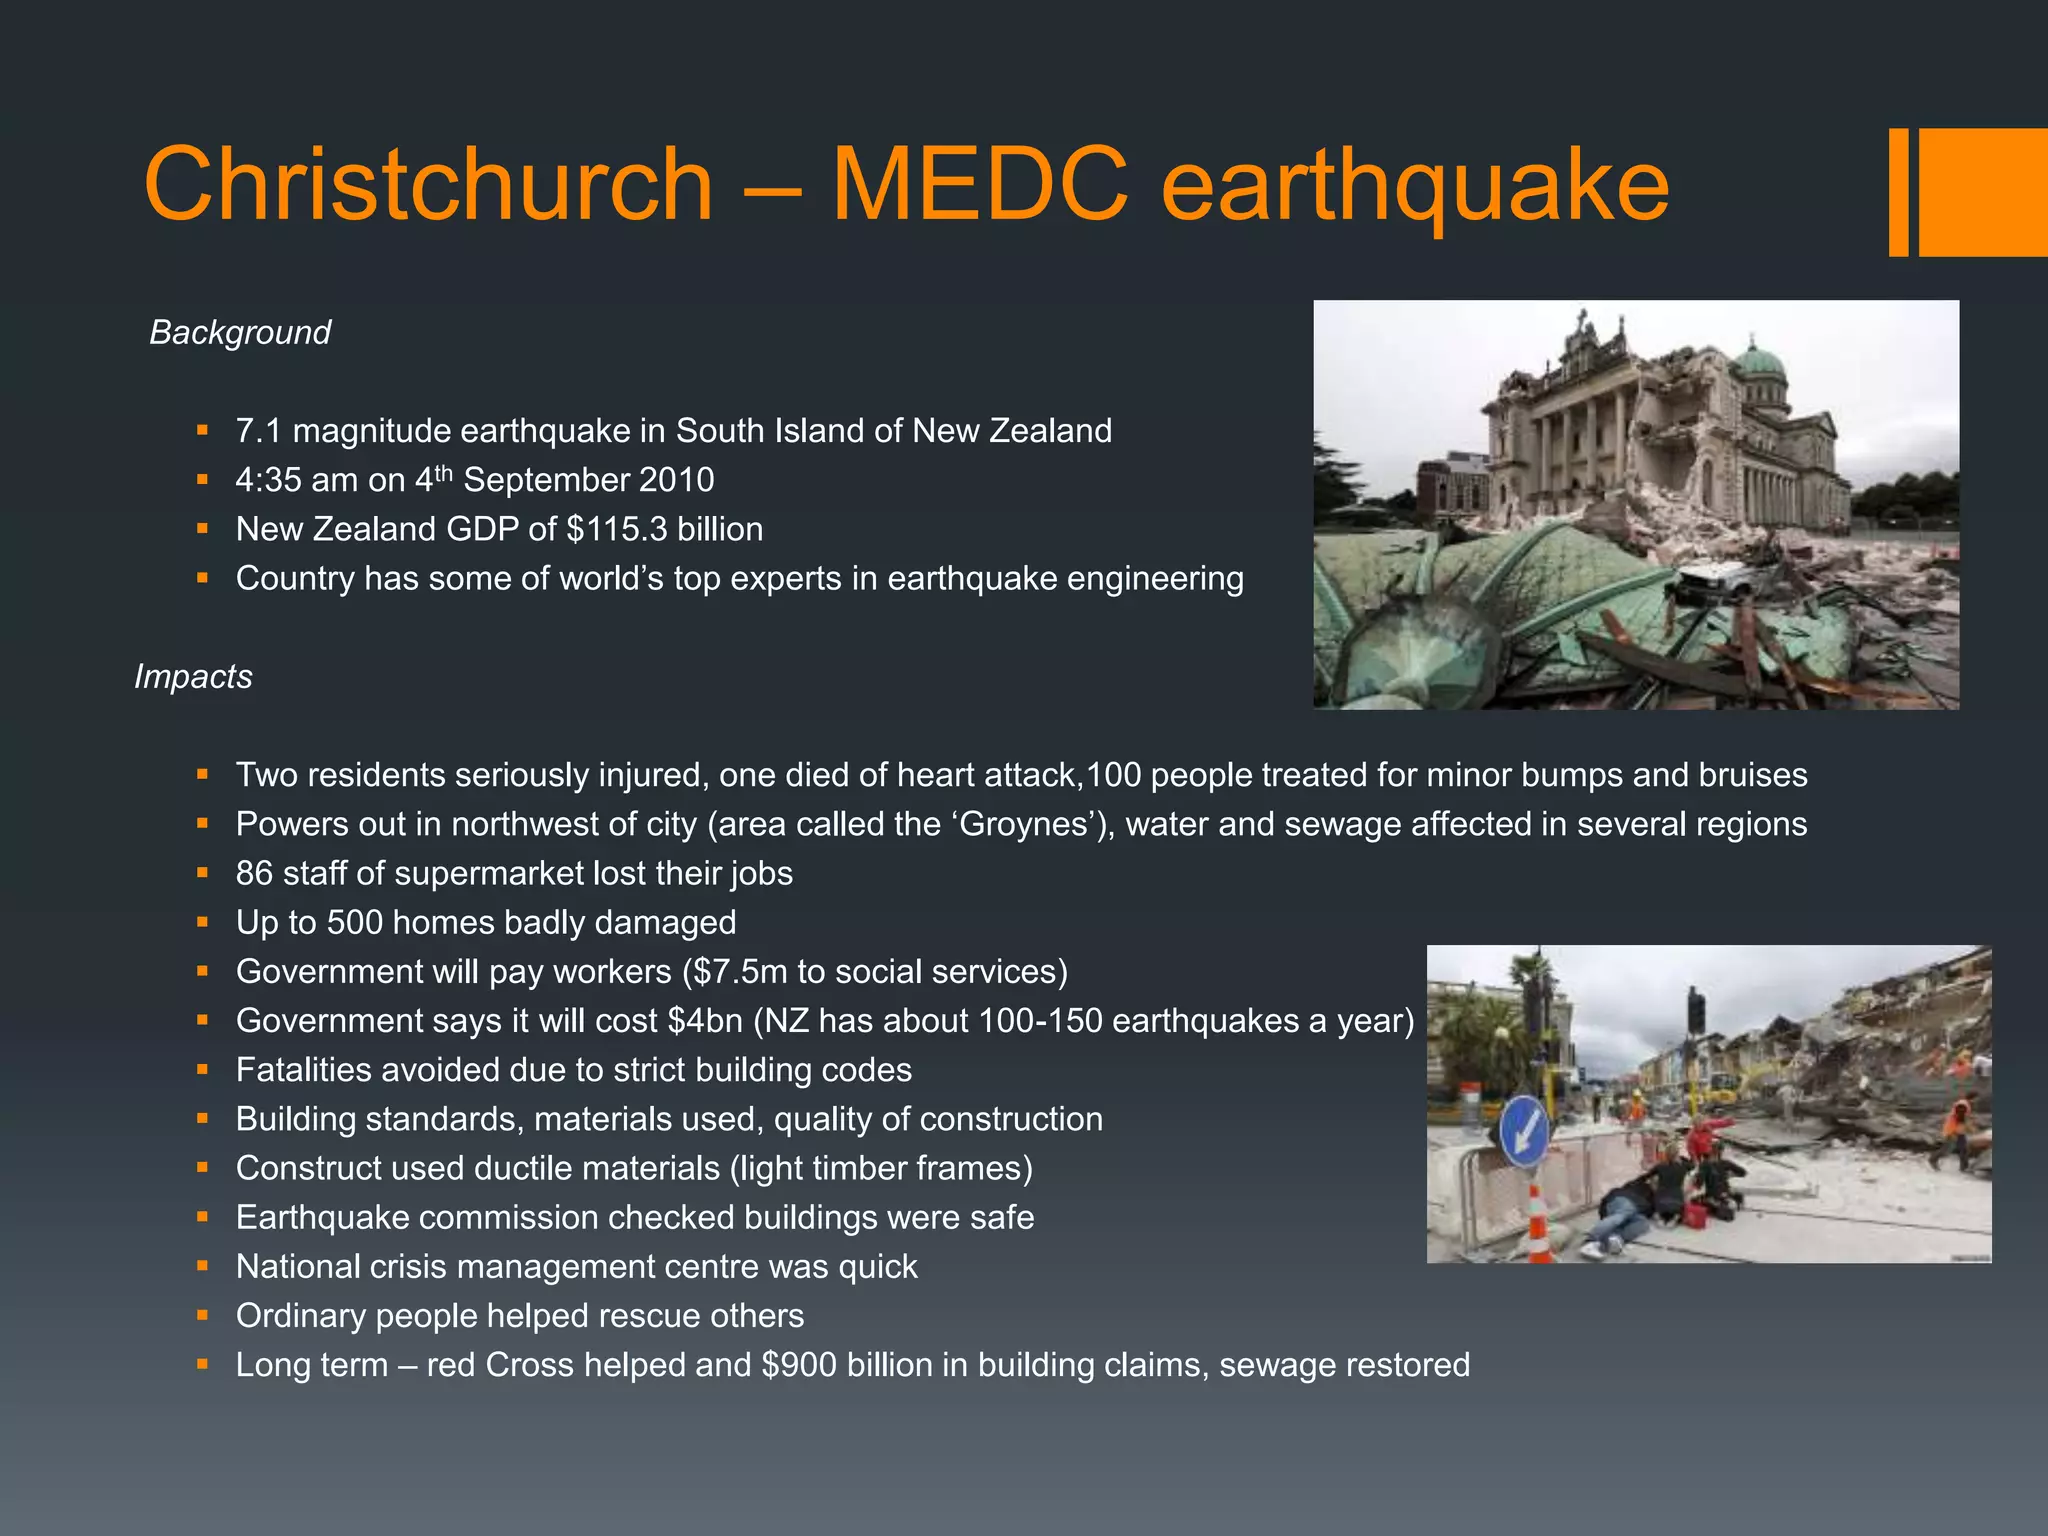
Christchurch – MEDCearthquake
Background
7.1 magnitude earthquake in South Island of New Zealand
4:35 am on 4th September 2010
New Zealand GDP of $115.3 billion
Country has some of world’s top experts in earthquake engineering
Impacts
Two residents seriously injured, one died of heart attack,100 people treated for minor bumps and bruises
Powers out in northwest of city (area called the ‘Groynes’), water and sewage affected in several regions
86 staff of supermarket lost their jobs
Up to 500 homes badly damaged
Government will pay workers ($7.5m to social services)
Government says it will cost $4bn (NZ has about 100-150 earthquakes a year)
Fatalities avoided due to strict building codes
Building standards, materials used, quality of construction
Construct used ductile materials (light timber frames)
Earthquake commission checked buildings were safe
National crisis management centre was quick
Ordinary people helped rescue others
Long term – red Cross helped and $900 billion in building claims, sewage restored
21.
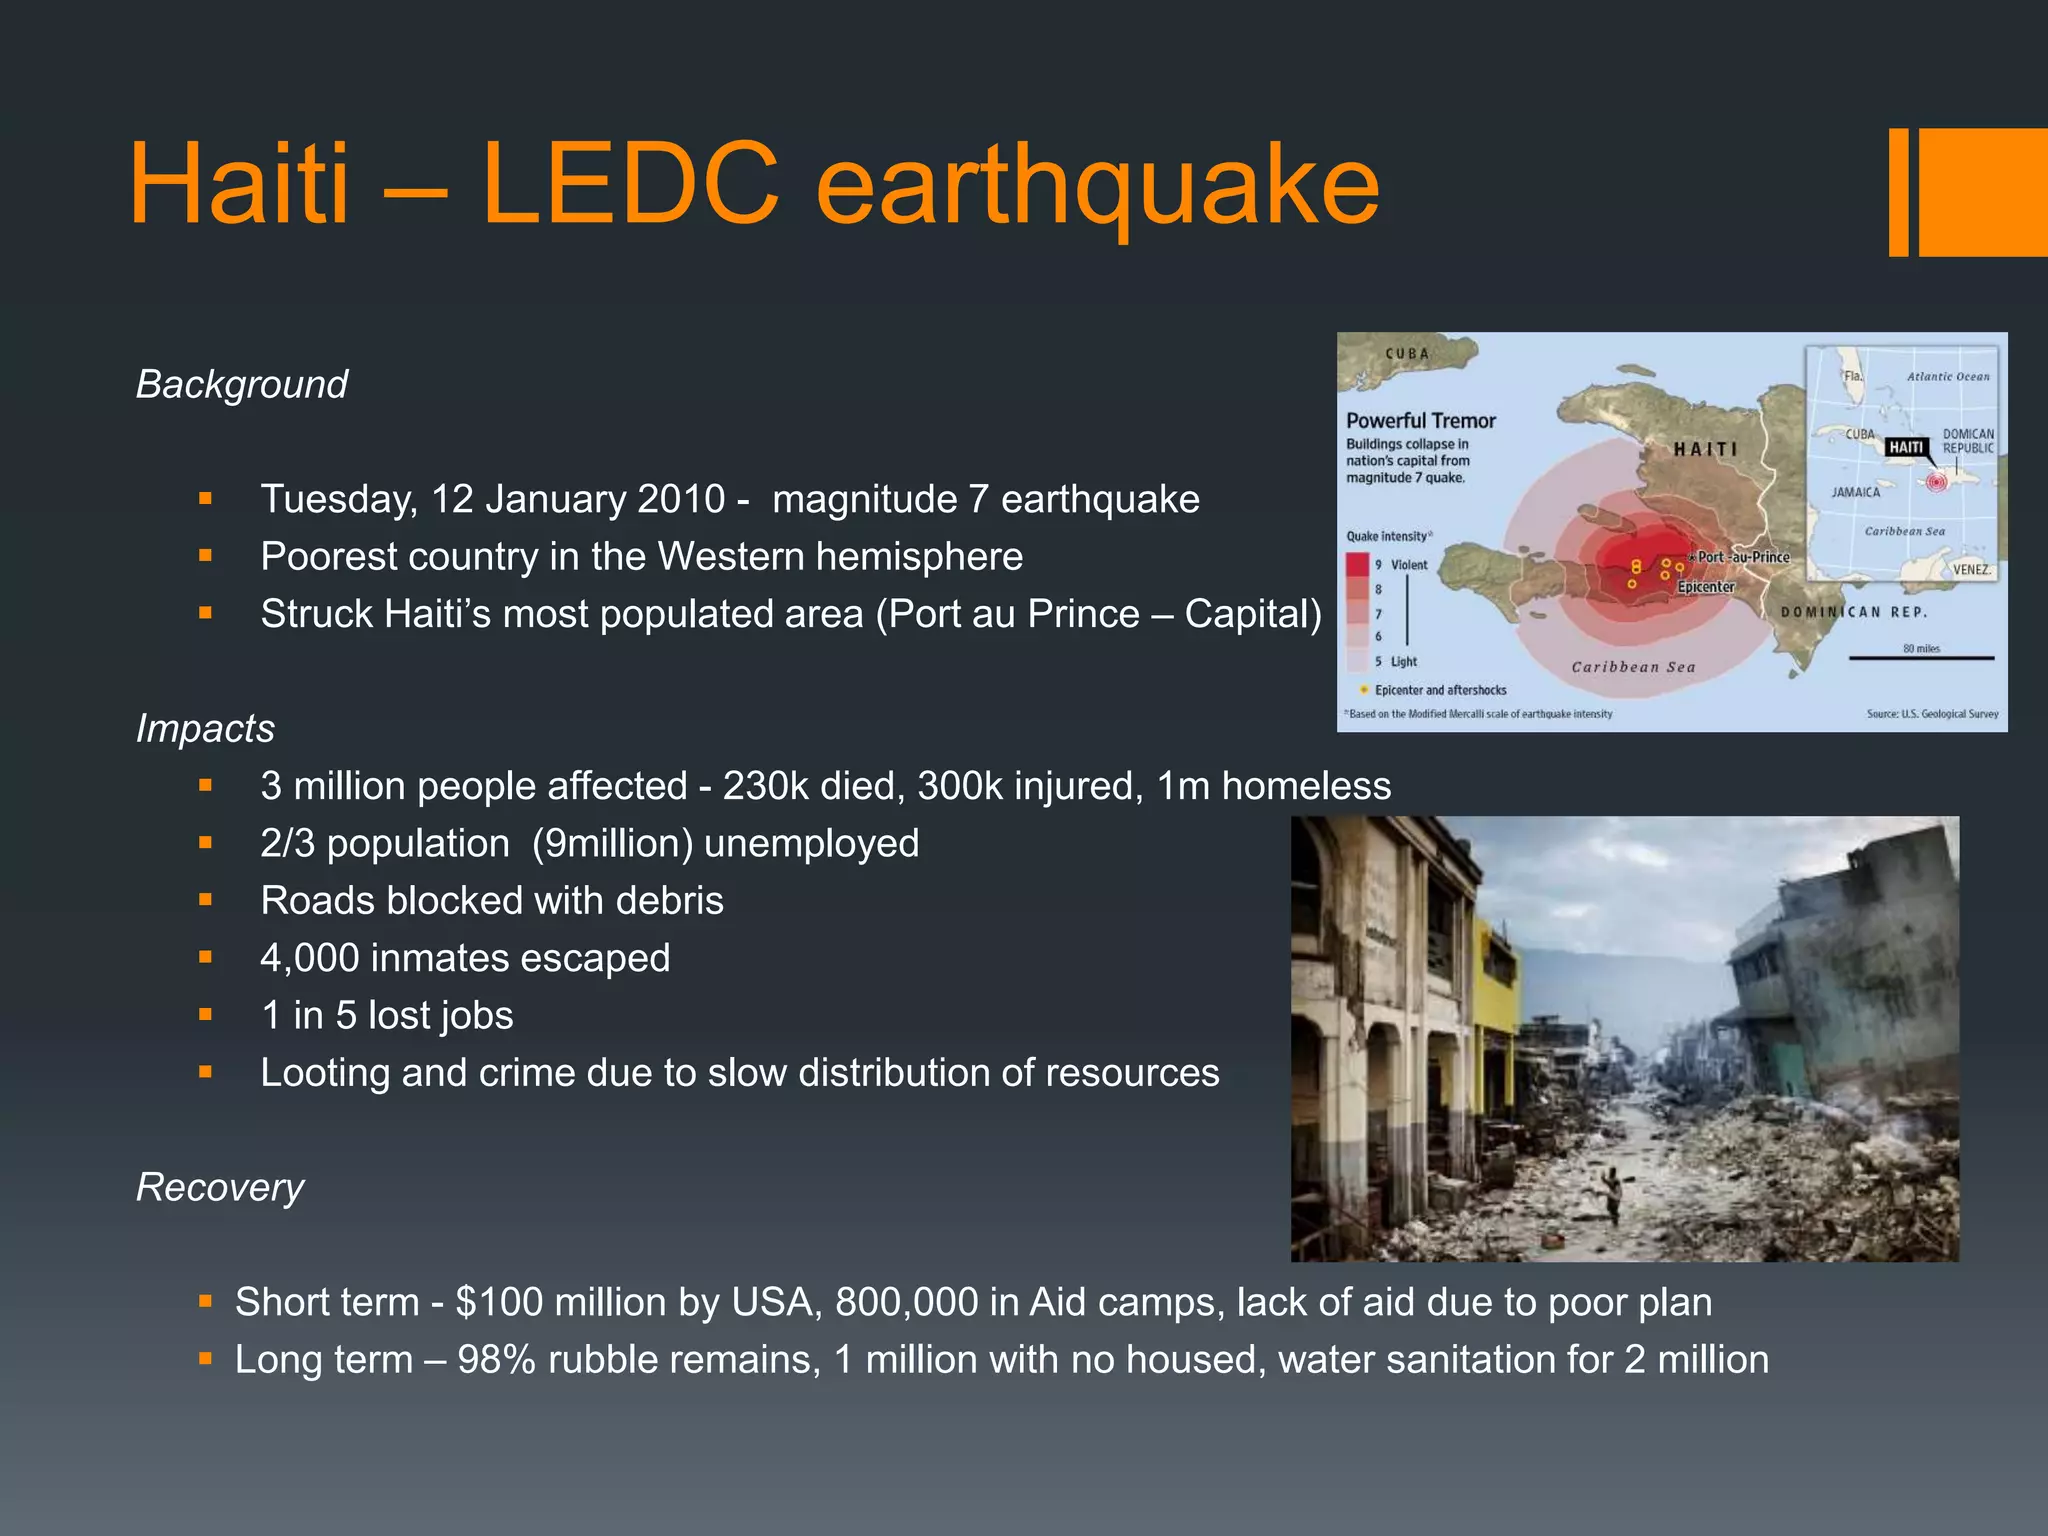
Haiti – LEDCearthquake
Background
Tuesday, 12 January 2010 - magnitude 7 earthquake
Poorest country in the Western hemisphere
Struck Haiti’s most populated area (Port au Prince – Capital)
Impacts
3 million people affected - 230k died, 300k injured, 1m homeless
2/3 population (9million) unemployed
Roads blocked with debris
4,000 inmates escaped
1 in 5 lost jobs
Looting and crime due to slow distribution of resources
Recovery
Short term - $100 million by USA, 800,000 in Aid camps, lack of aid due to poor plan
Long term – 98% rubble remains, 1 million with no housed, water sanitation for 2 million
22.
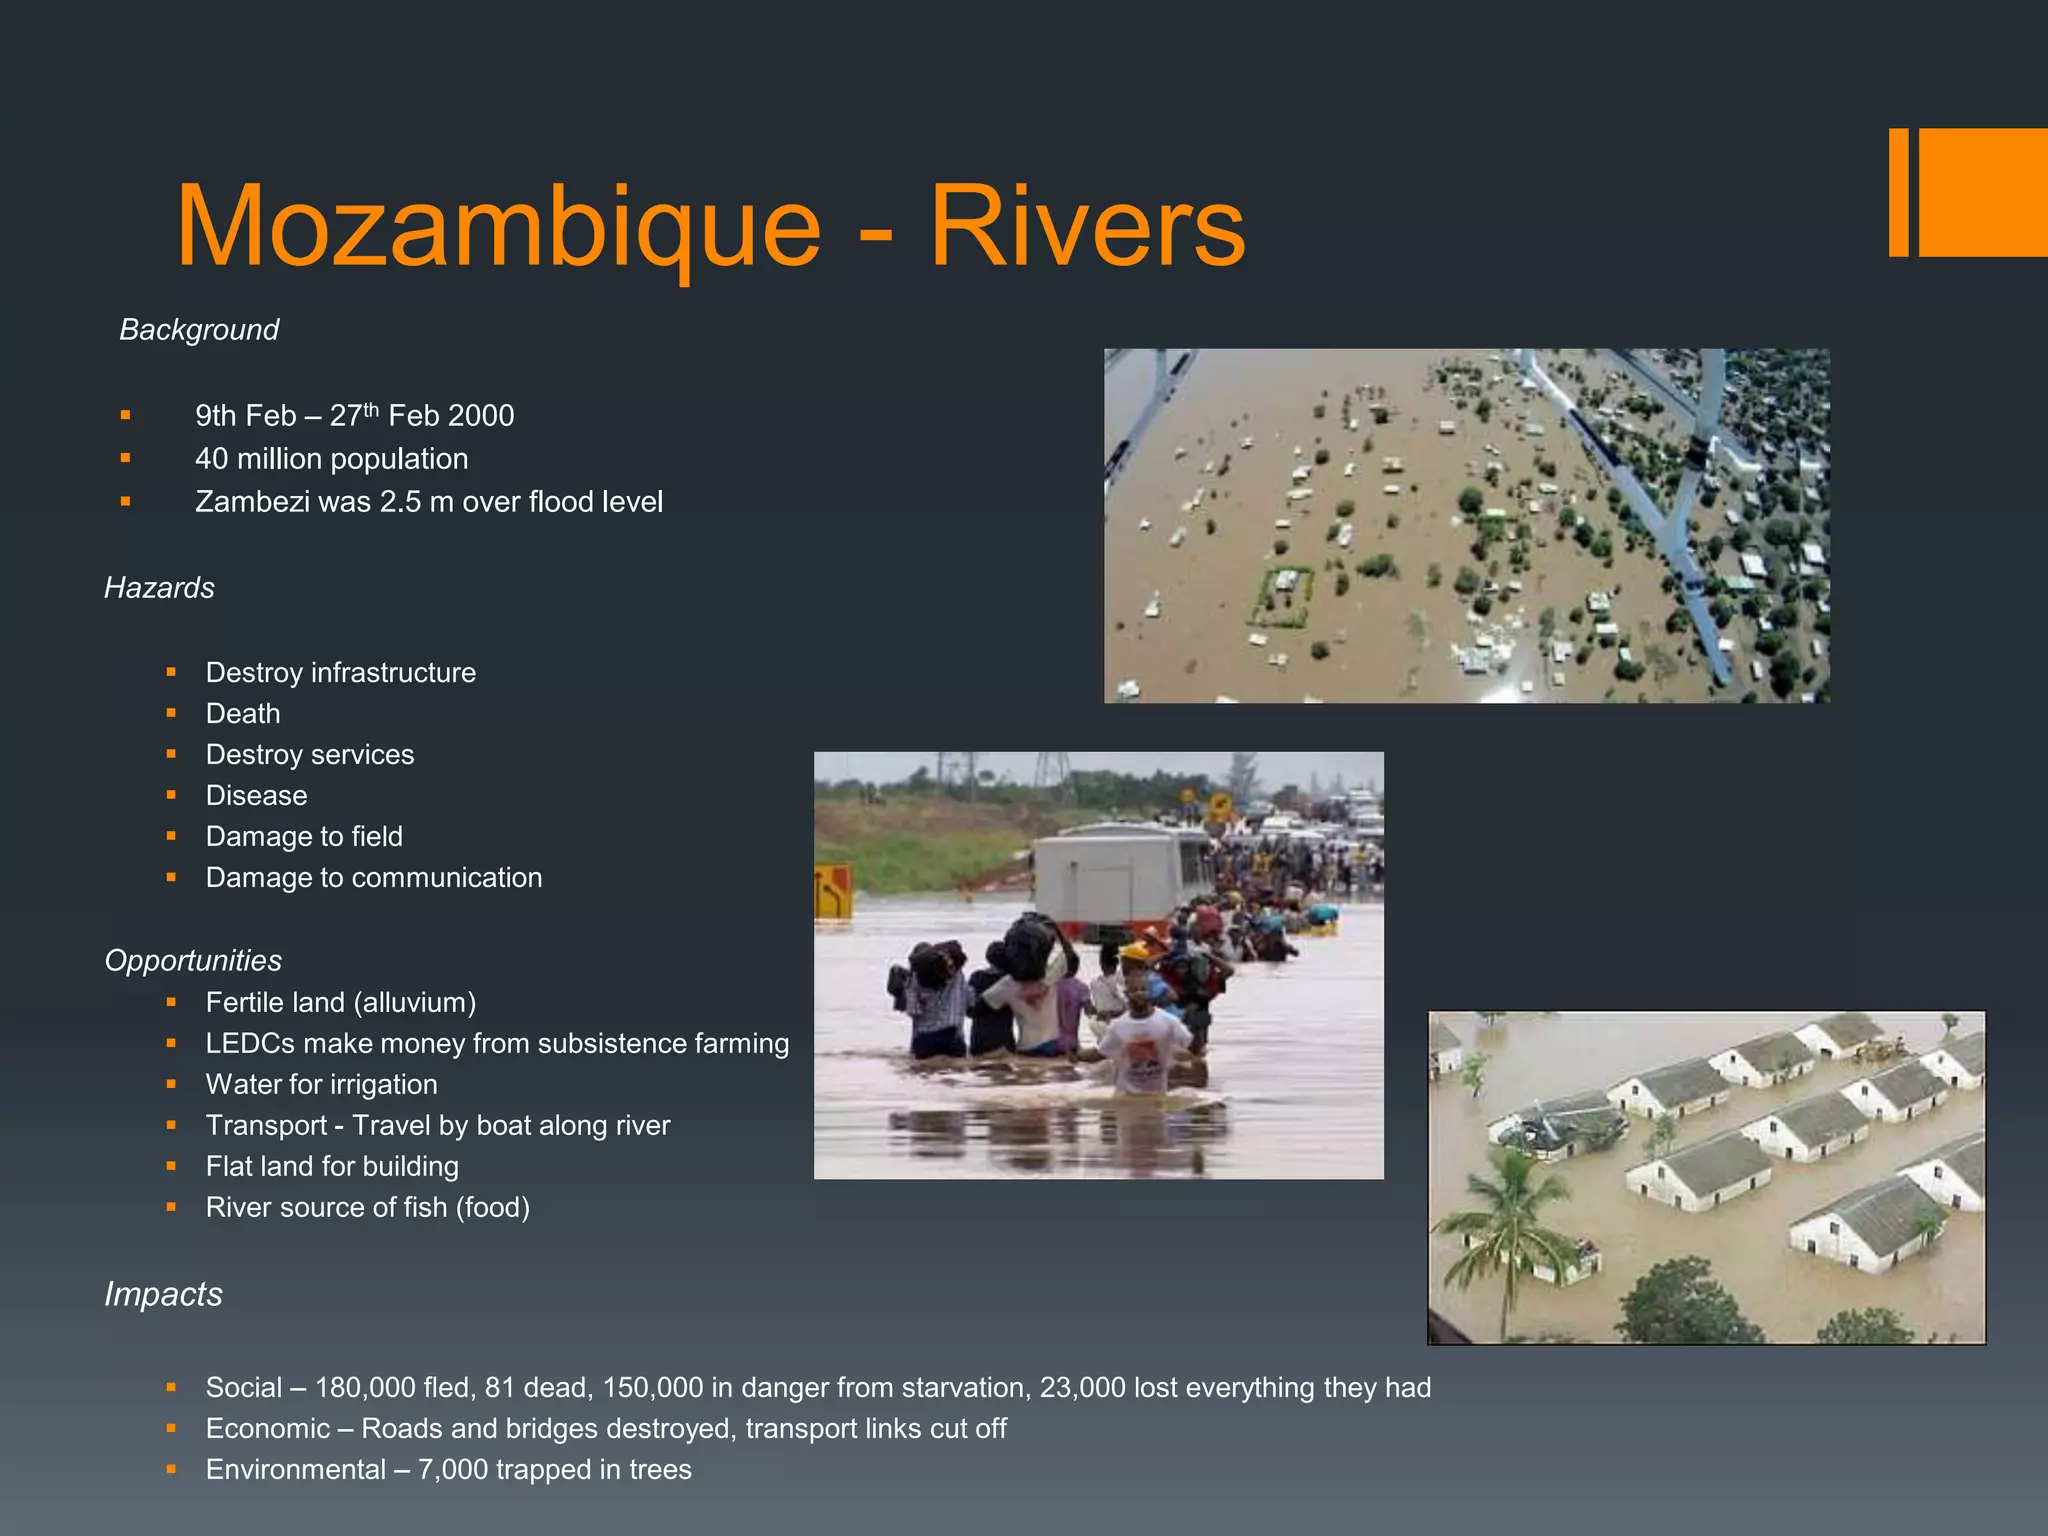
Mozambique - Rivers
Background
9th Feb – 27th Feb 2000
40 million population
Zambezi was 2.5 m over flood level
Hazards
Destroy infrastructure
Death
Destroy services
Disease
Damage to field
Damage to communication
Opportunities
Fertile land (alluvium)
LEDCs make money from subsistence farming
Water for irrigation
Transport - Travel by boat along river
Flat land for building
River source of fish (food)
Impacts
Social – 180,000 fled, 81 dead, 150,000 in danger from starvation, 23,000 lost everything they had
Economic – Roads and bridges destroyed, transport links cut off
Environmental – 7,000 trapped in trees
23.
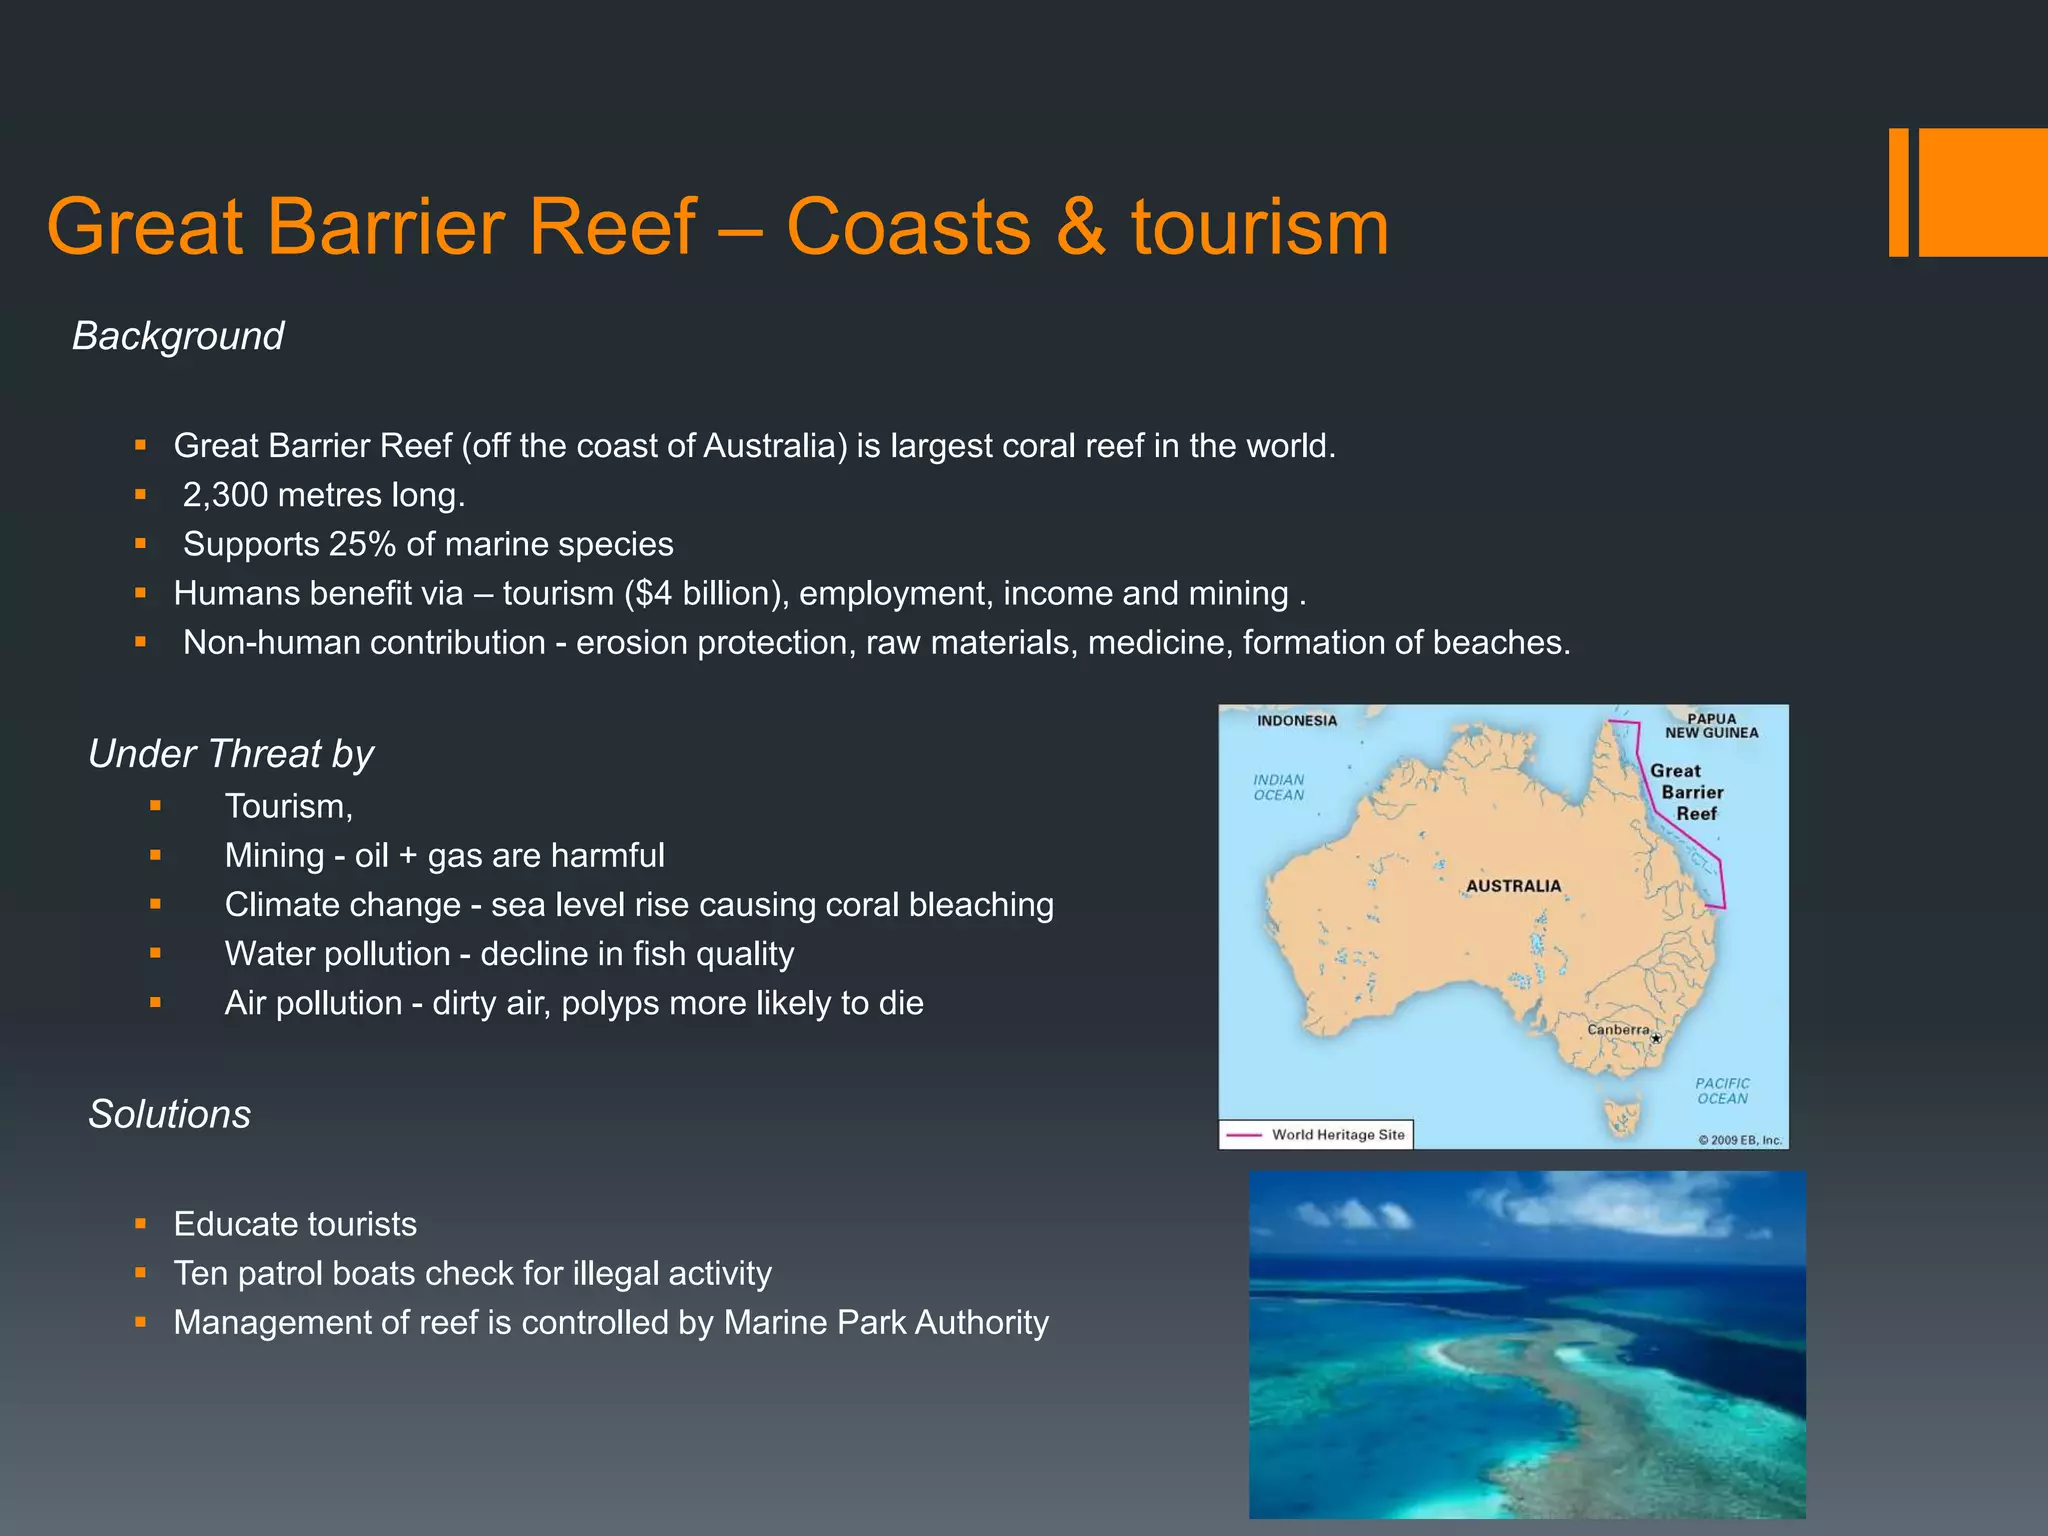
Great Barrier Reef– Coasts & tourism
Background
Great Barrier Reef (off the coast of Australia) is largest coral reef in the world.
2,300 metres long.
Supports 25% of marine species
Humans benefit via – tourism ($4 billion), employment, income and mining .
Non-human contribution - erosion protection, raw materials, medicine, formation of beaches.
Under Threat by
Tourism,
Mining - oil + gas are harmful
Climate change - sea level rise causing coral bleaching
Water pollution - decline in fish quality
Air pollution - dirty air, polyps more likely to die
Solutions
Educate tourists
Ten patrol boats check for illegal activity
Management of reef is controlled by Marine Park Authority
24.
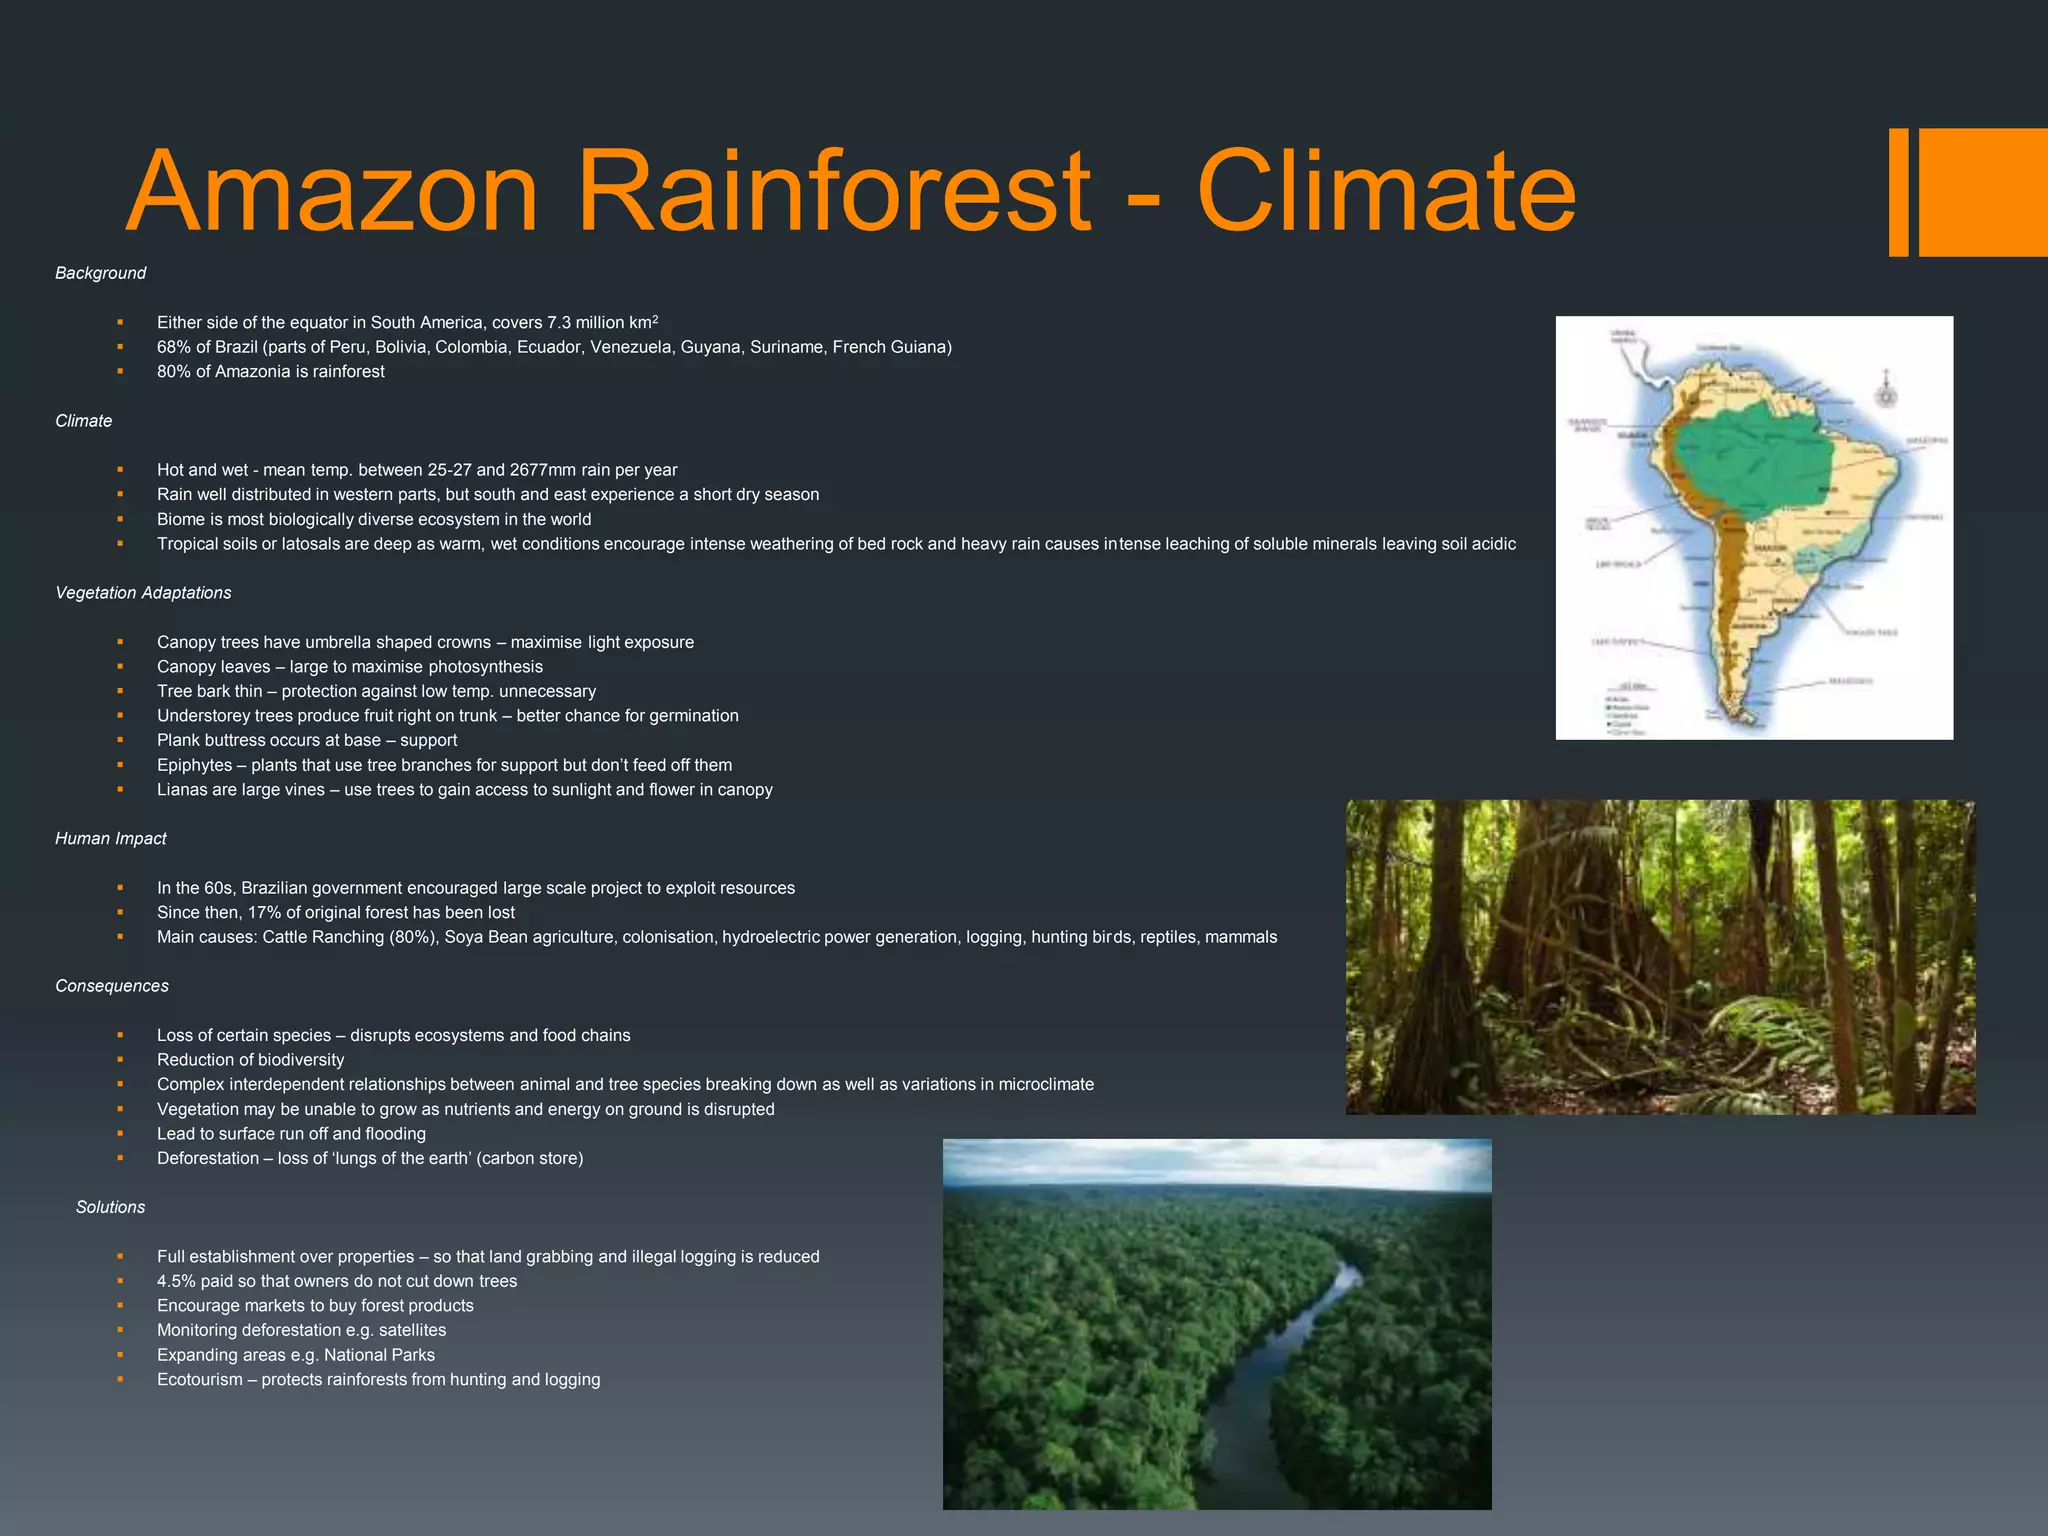
Amazon Rainforest -ClimateBackground
Either side of the equator in South America, covers 7.3 million km2
68% of Brazil (parts of Peru, Bolivia, Colombia, Ecuador, Venezuela, Guyana, Suriname, French Guiana)
80% of Amazonia is rainforest
Climate
Hot and wet - mean temp. between 25-27 and 2677mm rain per year
Rain well distributed in western parts, but south and east experience a short dry season
Biome is most biologically diverse ecosystem in the world
Tropical soils or latosals are deep as warm, wet conditions encourage intense weathering of bed rock and heavy rain causes intense leaching of soluble minerals leaving soil acidic
Vegetation Adaptations
Canopy trees have umbrella shaped crowns – maximise light exposure
Canopy leaves – large to maximise photosynthesis
Tree bark thin – protection against low temp. unnecessary
Understorey trees produce fruit right on trunk – better chance for germination
Plank buttress occurs at base – support
Epiphytes – plants that use tree branches for support but don’t feed off them
Lianas are large vines – use trees to gain access to sunlight and flower in canopy
Human Impact
In the 60s, Brazilian government encouraged large scale project to exploit resources
Since then, 17% of original forest has been lost
Main causes: Cattle Ranching (80%), Soya Bean agriculture, colonisation, hydroelectric power generation, logging, hunting birds, reptiles, mammals
Consequences
Loss of certain species – disrupts ecosystems and food chains
Reduction of biodiversity
Complex interdependent relationships between animal and tree species breaking down as well as variations in microclimate
Vegetation may be unable to grow as nutrients and energy on ground is disrupted
Lead to surface run off and flooding
Deforestation – loss of ‘lungs of the earth’ (carbon store)
Solutions
Full establishment over properties – so that land grabbing and illegal logging is reduced
4.5% paid so that owners do not cut down trees
Encourage markets to buy forest products
Monitoring deforestation e.g. satellites
Expanding areas e.g. National Parks
Ecotourism – protects rainforests from hunting and logging
25.
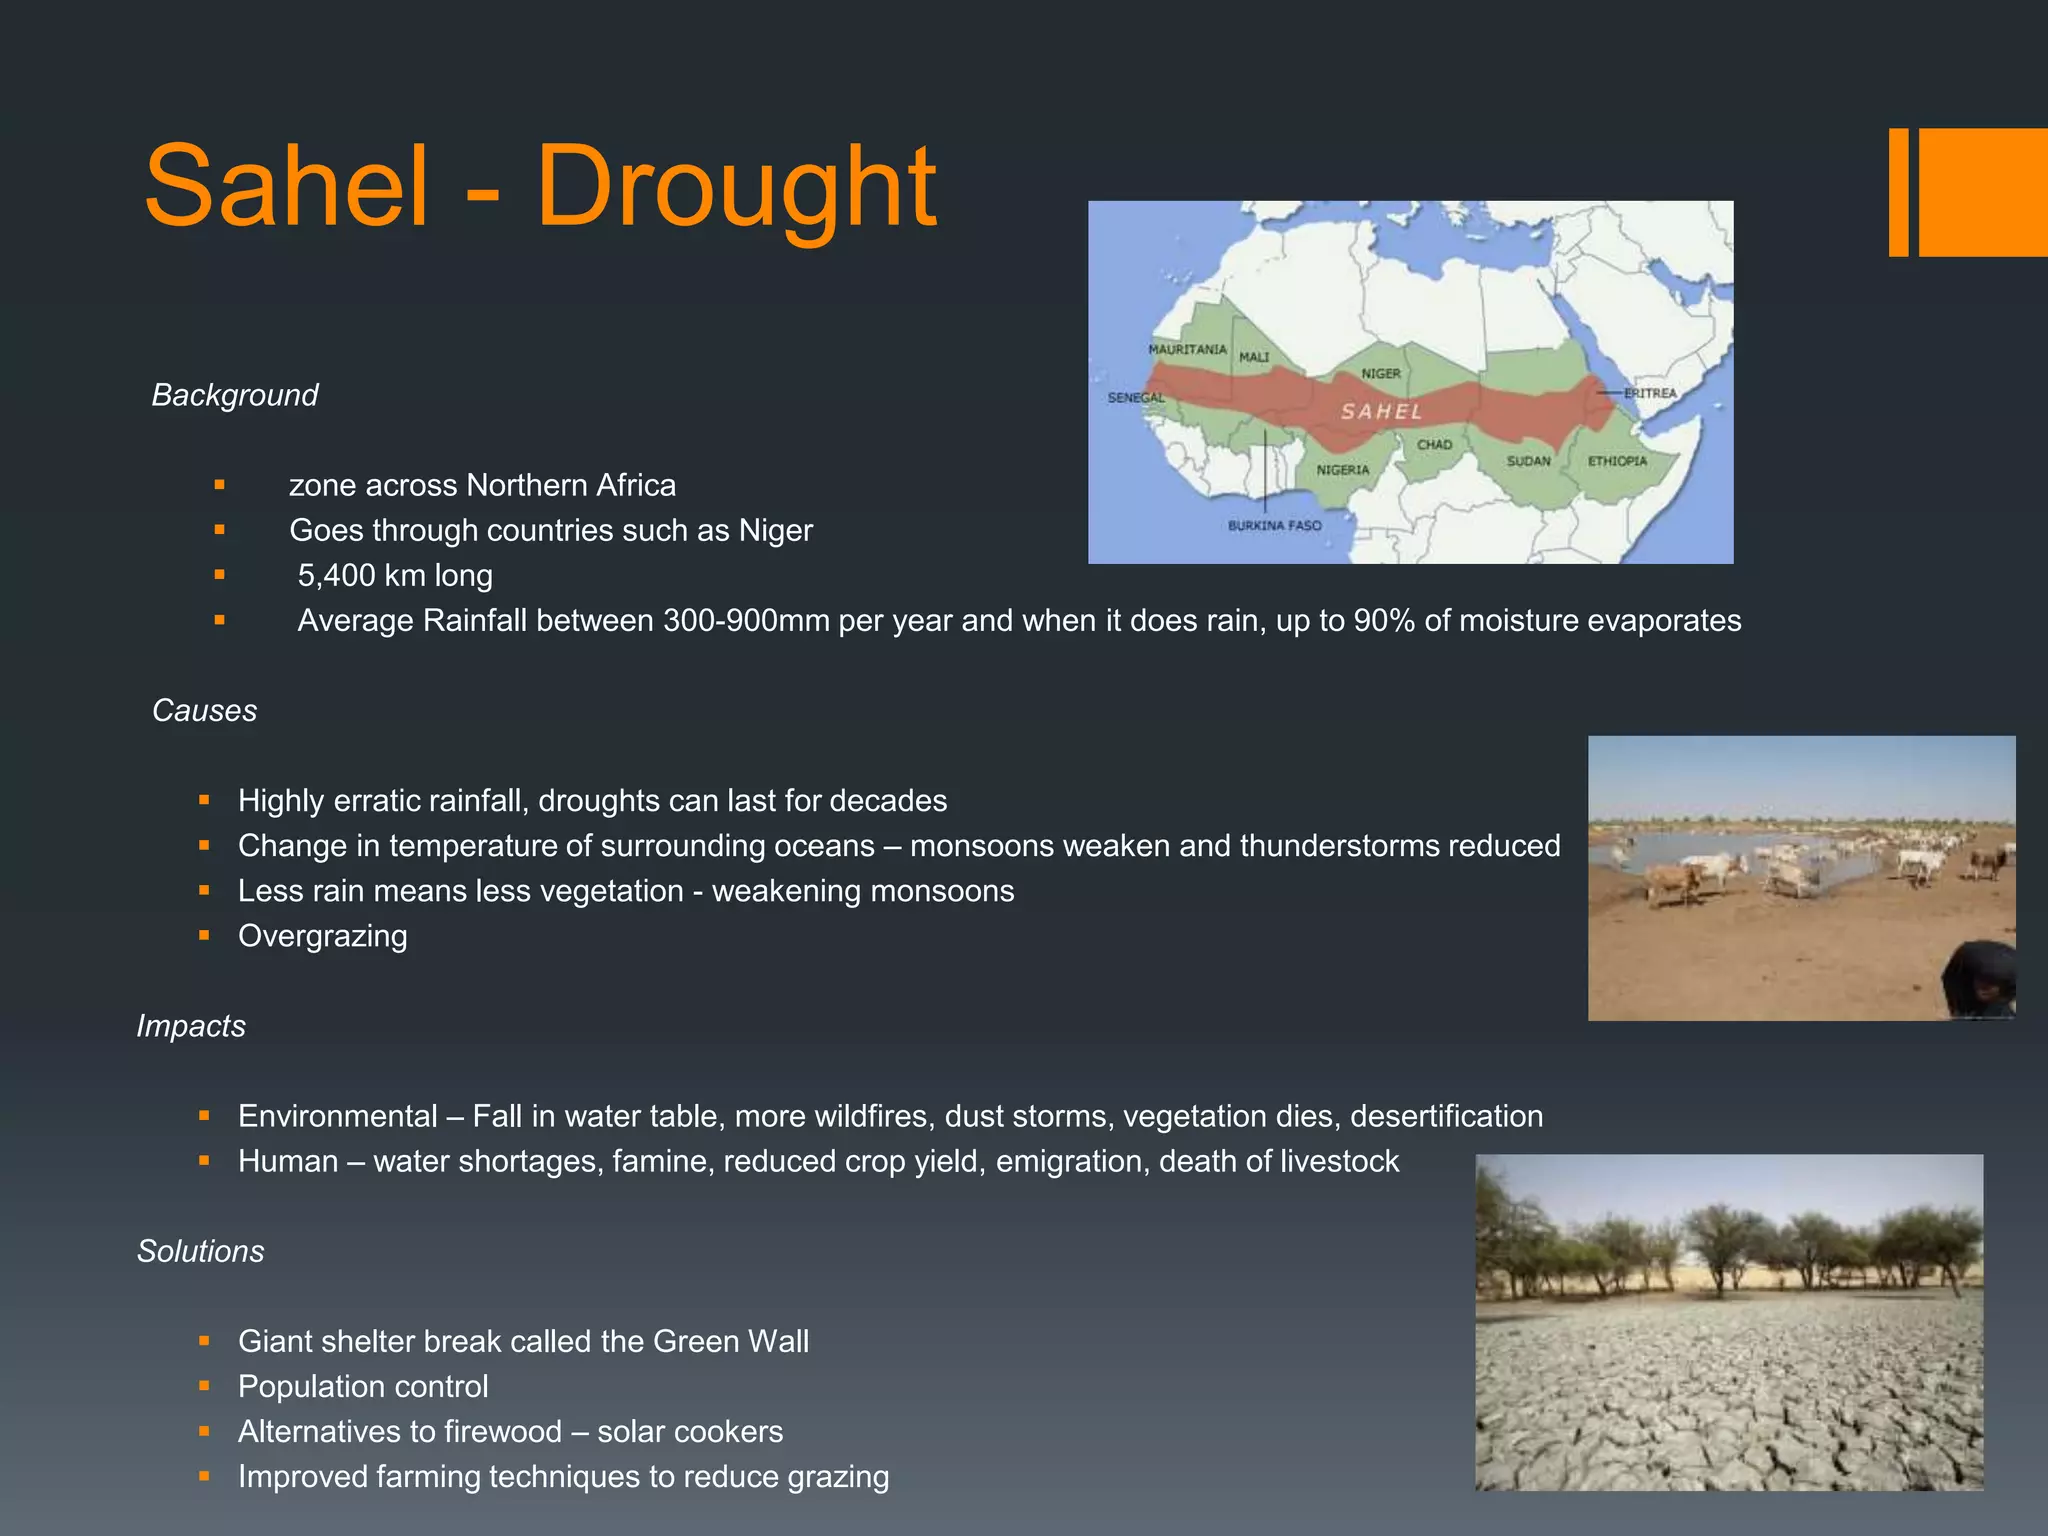
Sahel - Drought
Background
zone across Northern Africa
Goes through countries such as Niger
5,400 km long
Average Rainfall between 300-900mm per year and when it does rain, up to 90% of moisture evaporates
Causes
Highly erratic rainfall, droughts can last for decades
Change in temperature of surrounding oceans – monsoons weaken and thunderstorms reduced
Less rain means less vegetation - weakening monsoons
Overgrazing
Impacts
Environmental – Fall in water table, more wildfires, dust storms, vegetation dies, desertification
Human – water shortages, famine, reduced crop yield, emigration, death of livestock
Solutions
Giant shelter break called the Green Wall
Population control
Alternatives to firewood – solar cookers
Improved farming techniques to reduce grazing
26.
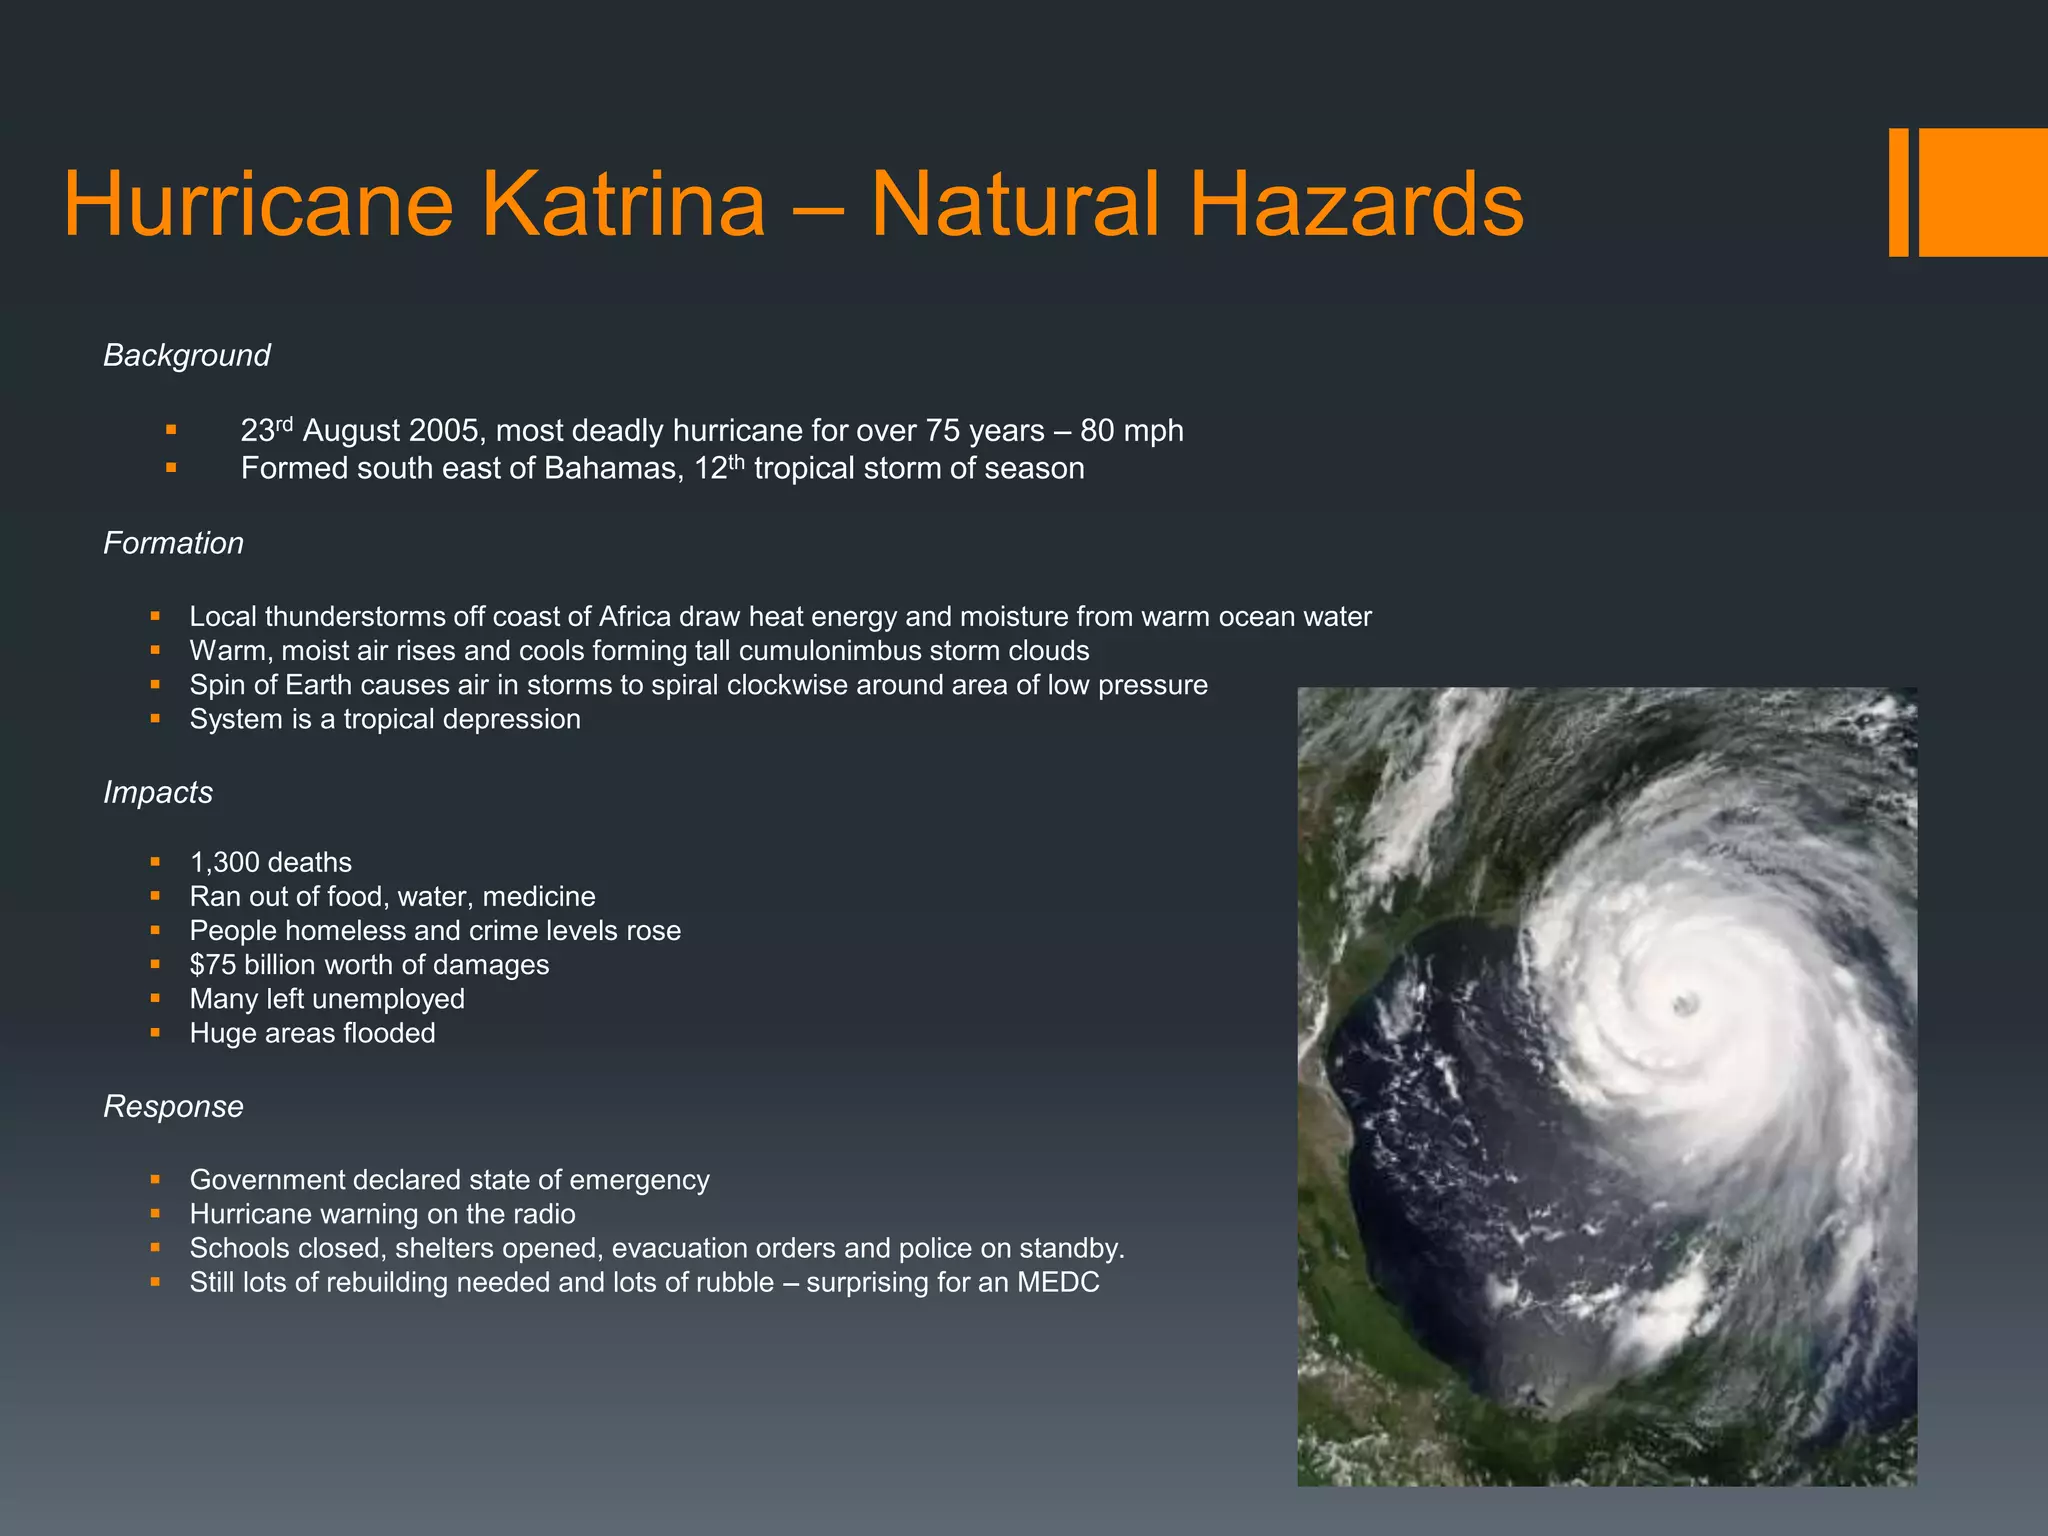
Hurricane Katrina –Natural Hazards
Background
23rd August 2005, most deadly hurricane for over 75 years – 80 mph
Formed south east of Bahamas, 12th tropical storm of season
Formation
Local thunderstorms off coast of Africa draw heat energy and moisture from warm ocean water
Warm, moist air rises and cools forming tall cumulonimbus storm clouds
Spin of Earth causes air in storms to spiral clockwise around area of low pressure
System is a tropical depression
Impacts
1,300 deaths
Ran out of food, water, medicine
People homeless and crime levels rose
$75 billion worth of damages
Many left unemployed
Huge areas flooded
Response
Government declared state of emergency
Hurricane warning on the radio
Schools closed, shelters opened, evacuation orders and police on standby.
Still lots of rebuilding needed and lots of rubble – surprising for an MEDC
27.
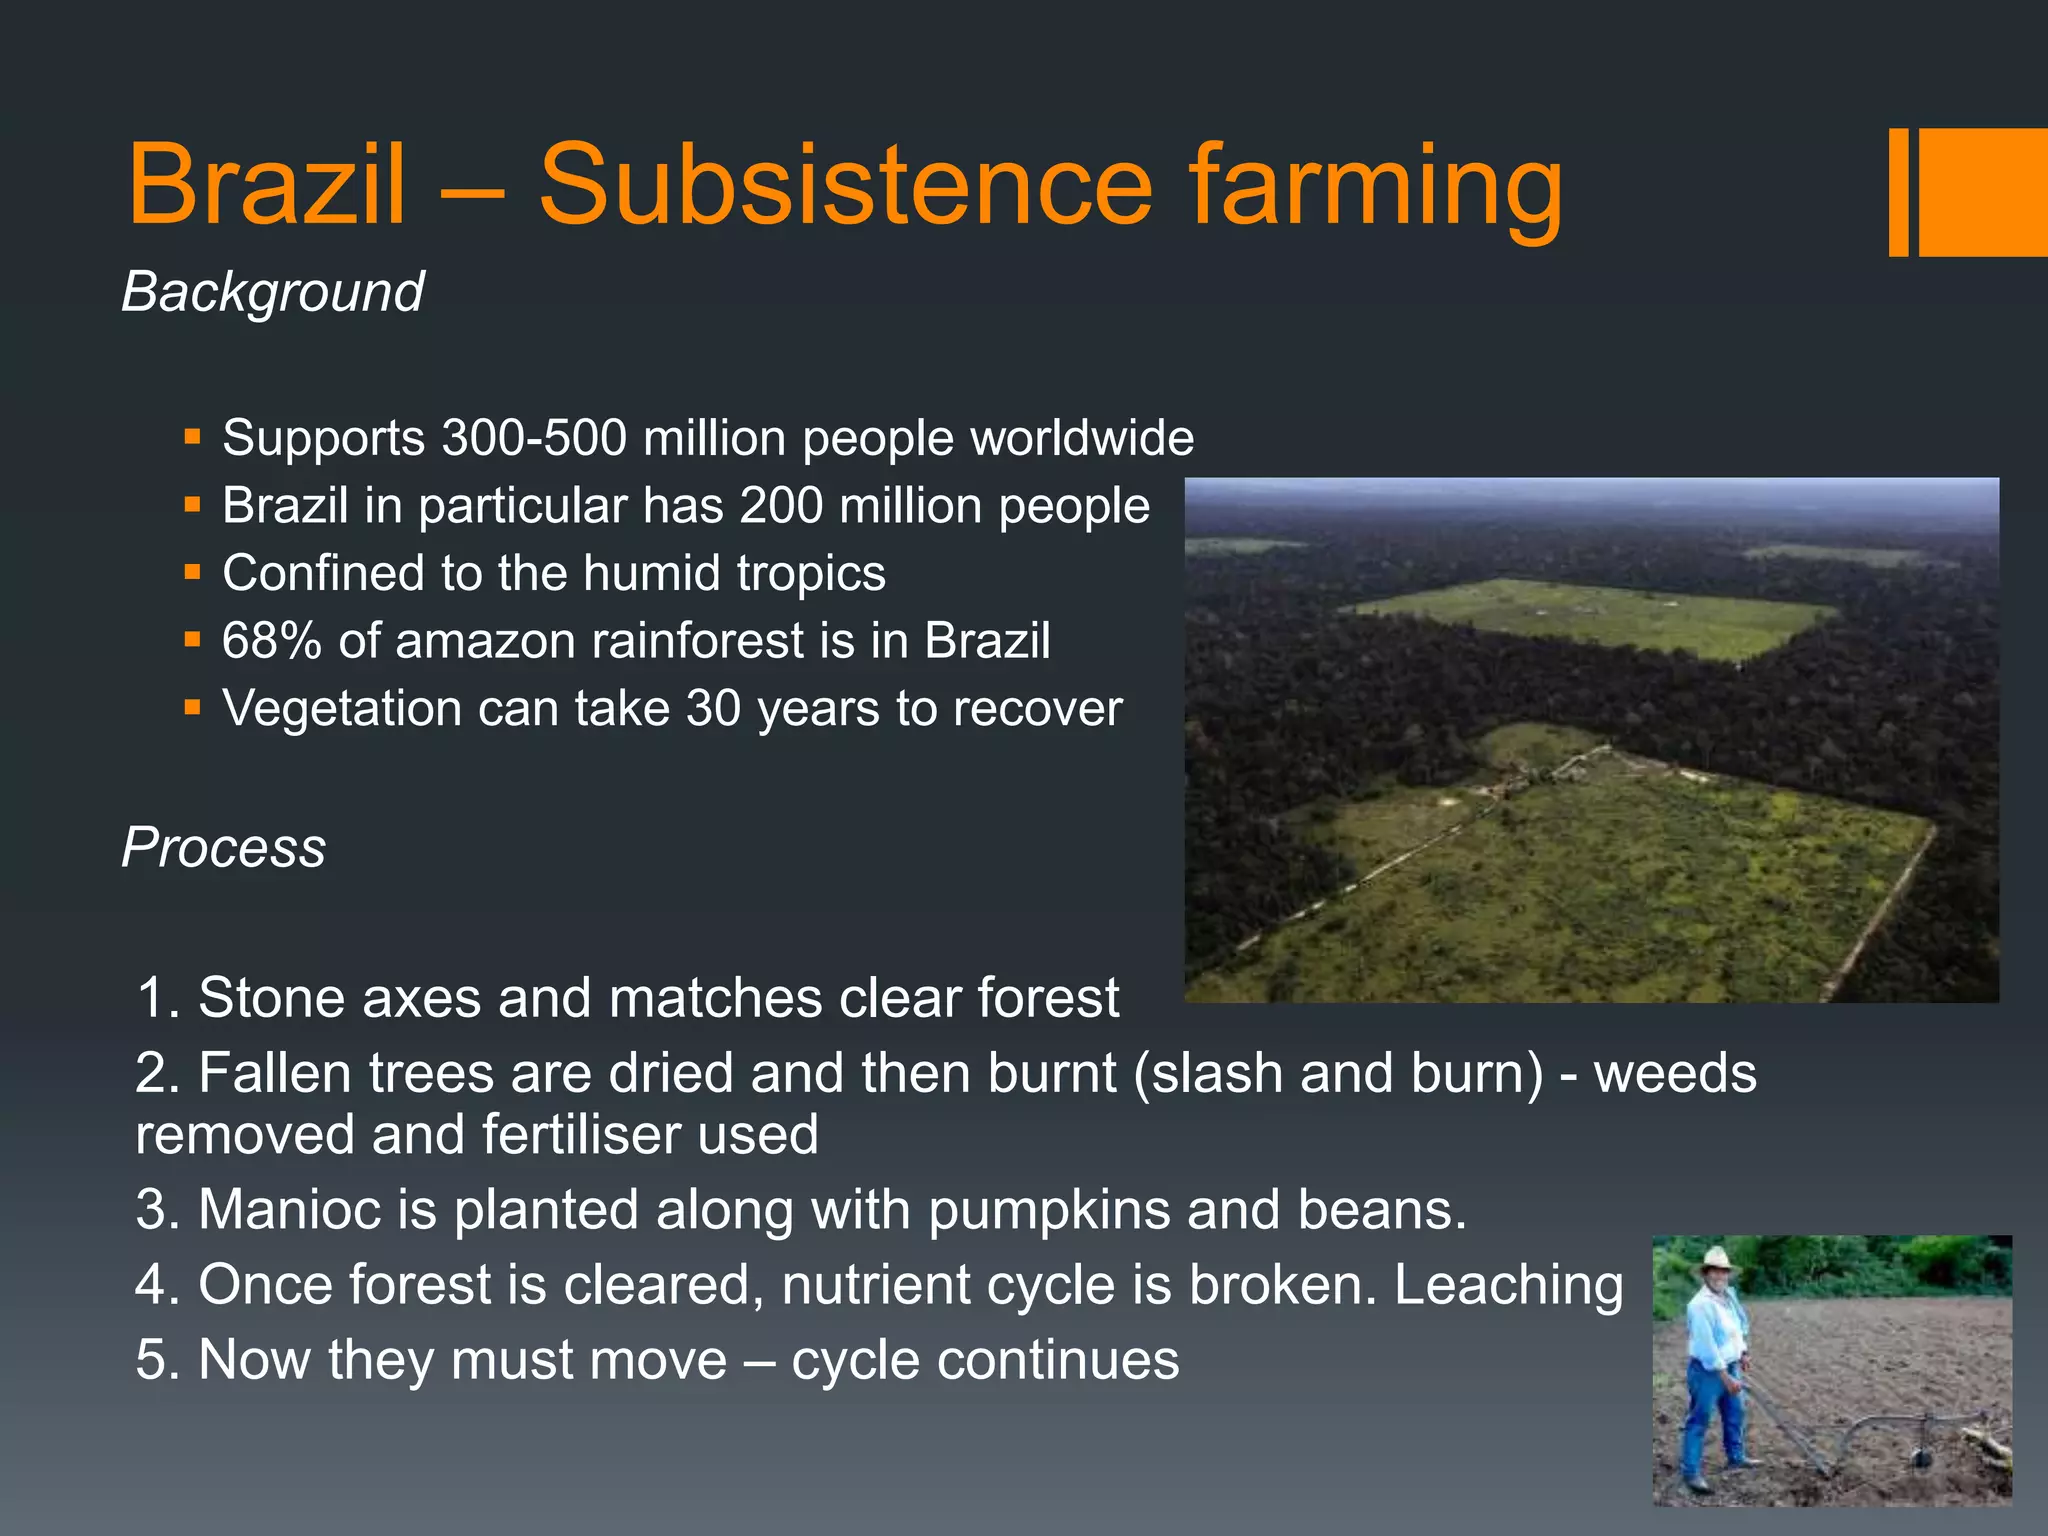
Brazil – Subsistencefarming
Background
Supports 300-500 million people worldwide
Brazil in particular has 200 million people
Confined to the humid tropics
68% of amazon rainforest is in Brazil
Vegetation can take 30 years to recover
Process
1. Stone axes and matches clear forest
2. Fallen trees are dried and then burnt (slash and burn) - weeds
removed and fertiliser used
3. Manioc is planted along with pumpkins and beans.
4. Once forest is cleared, nutrient cycle is broken. Leaching
5. Now they must move – cycle continues
28.
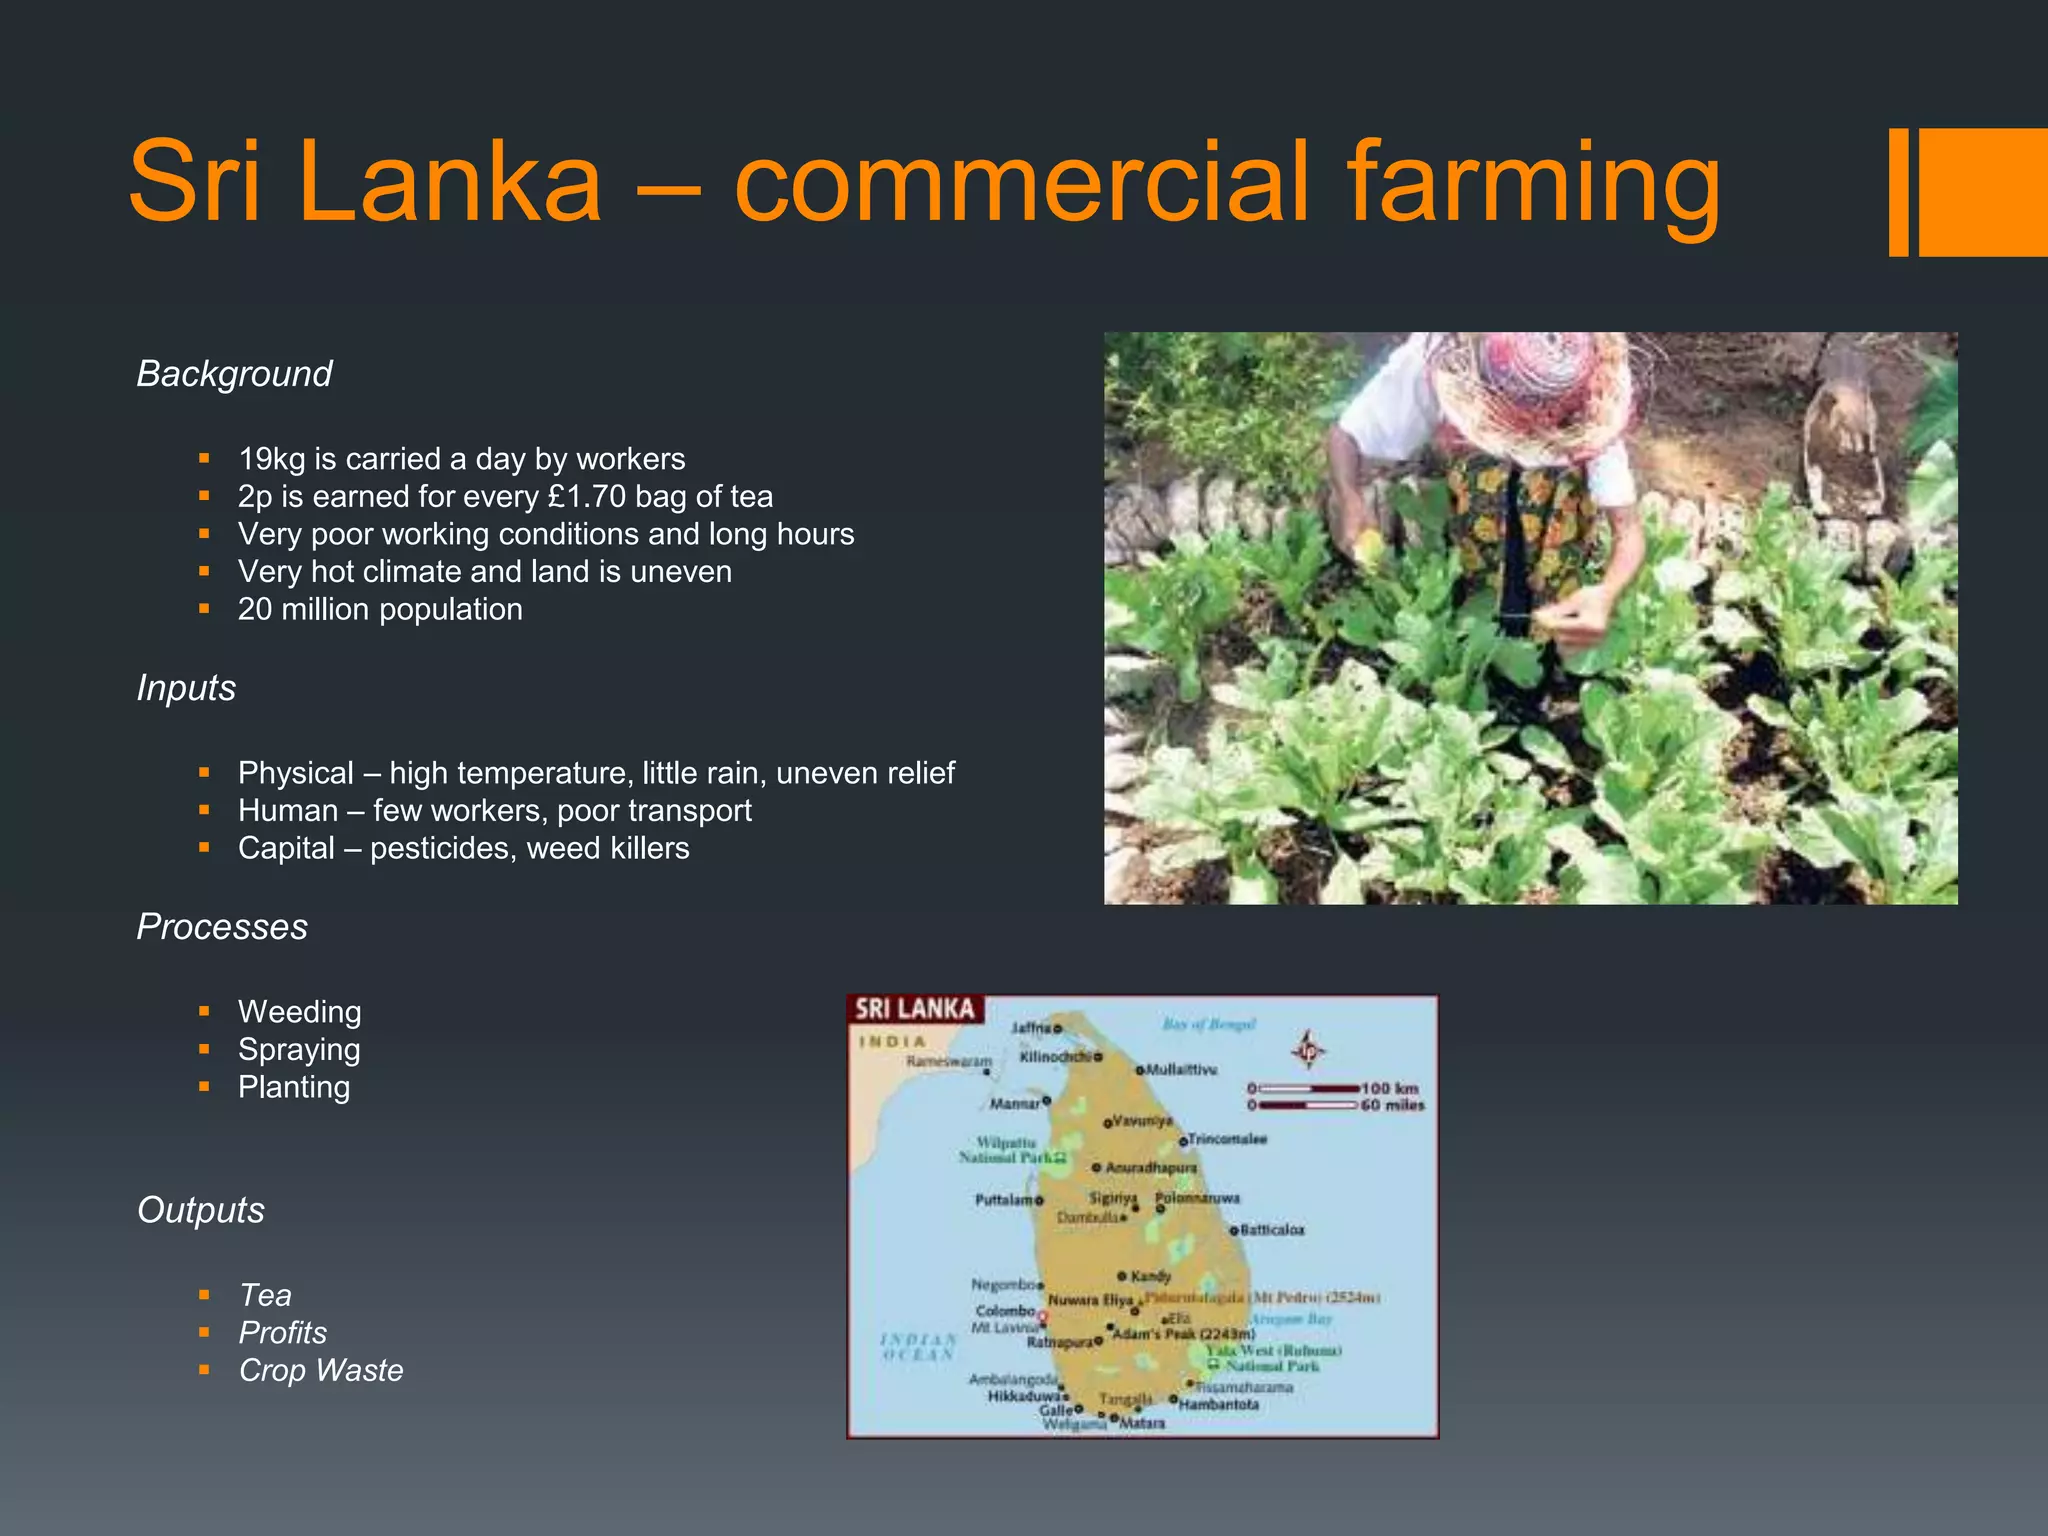
Sri Lanka –commercial farming
Background
19kg is carried a day by workers
2p is earned for every £1.70 bag of tea
Very poor working conditions and long hours
Very hot climate and land is uneven
20 million population
Inputs
Physical – high temperature, little rain, uneven relief
Human – few workers, poor transport
Capital – pesticides, weed killers
Processes
Weeding
Spraying
Planting
Outputs
Tea
Profits
Crop Waste
29.
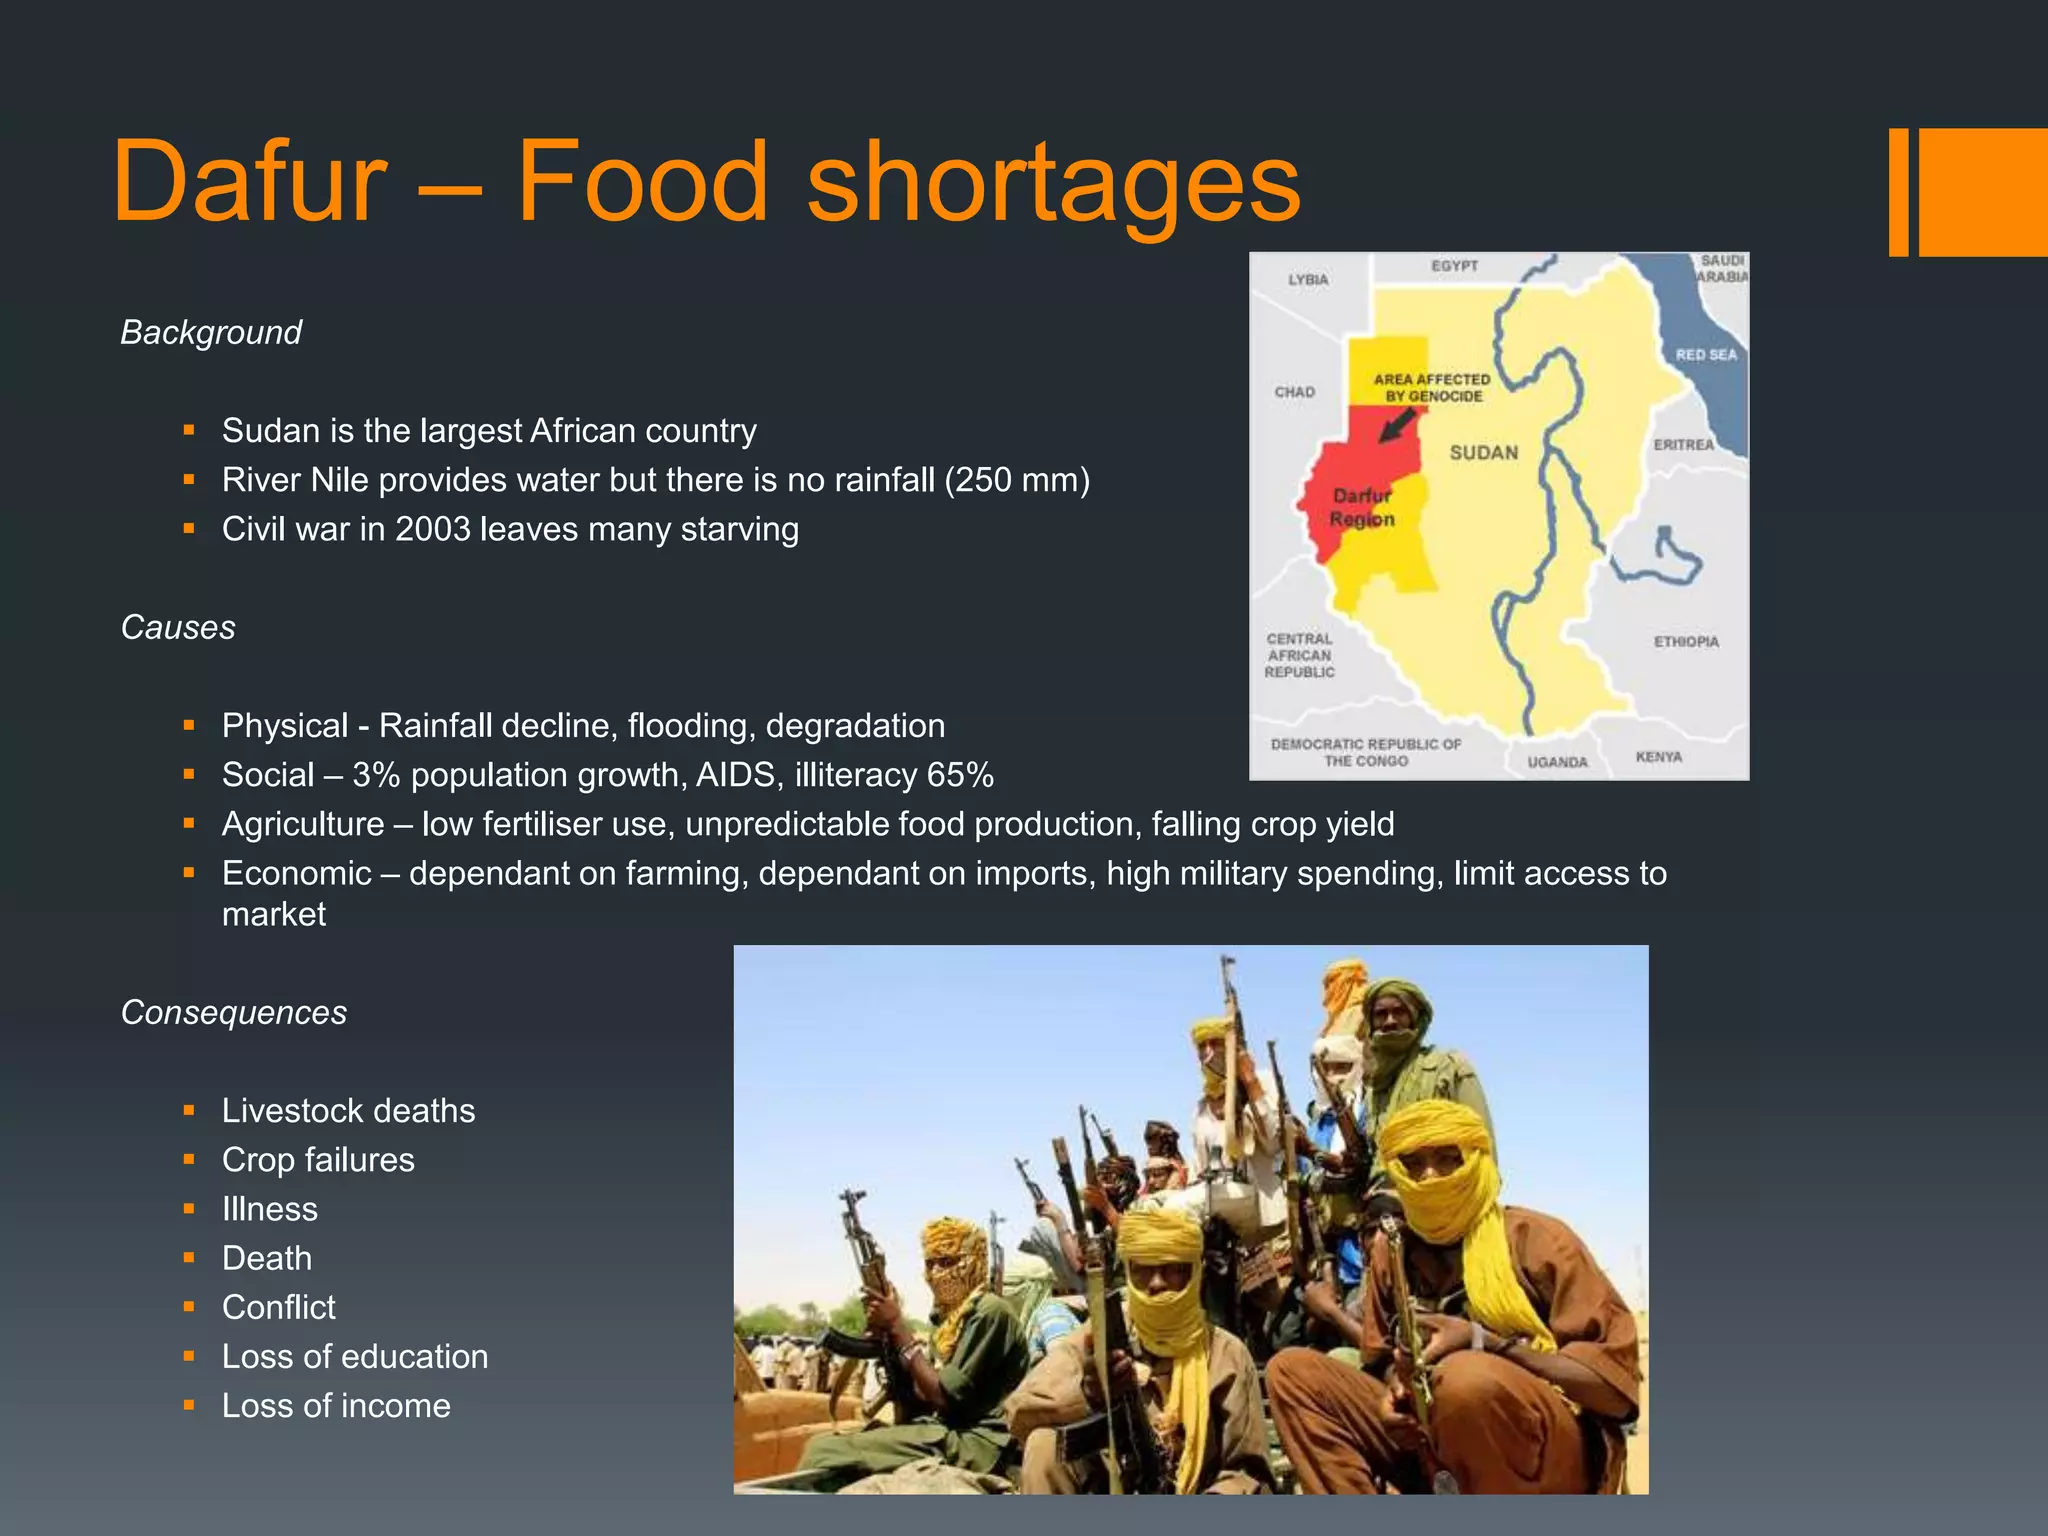
Dafur – Foodshortages
Background
Sudan is the largest African country
River Nile provides water but there is no rainfall (250 mm)
Civil war in 2003 leaves many starving
Causes
Physical - Rainfall decline, flooding, degradation
Social – 3% population growth, AIDS, illiteracy 65%
Agriculture – low fertiliser use, unpredictable food production, falling crop yield
Economic – dependant on farming, dependant on imports, high military spending, limit access to
market
Consequences
Livestock deaths
Crop failures
Illness
Death
Conflict
Loss of education
Loss of income
30.
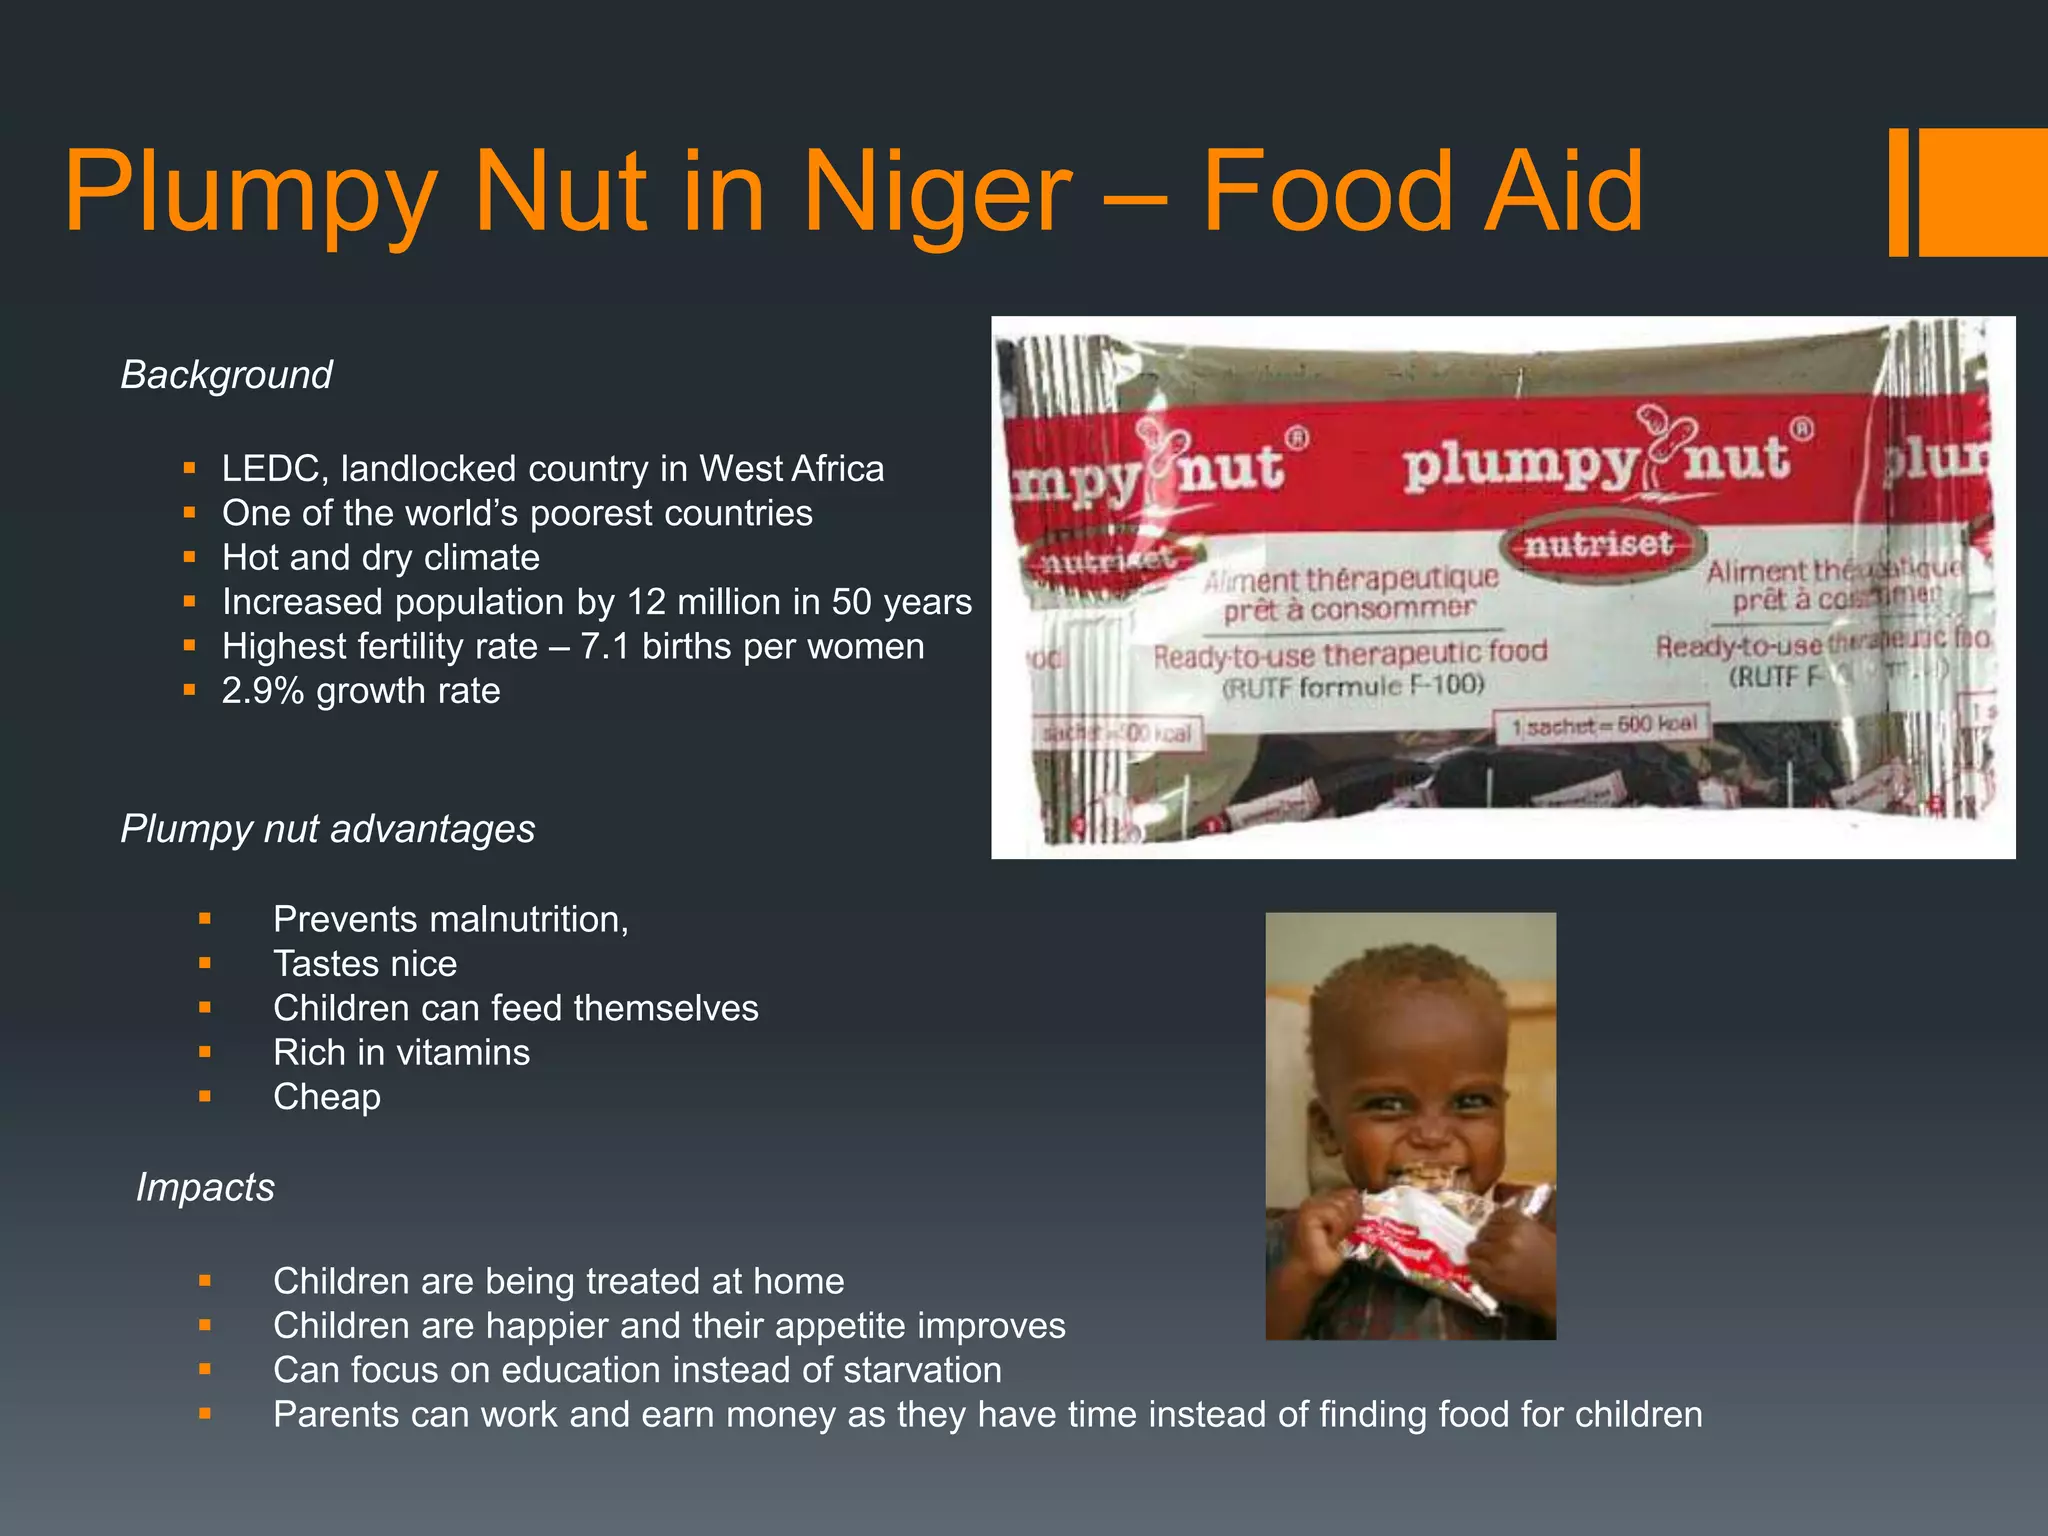
Plumpy Nut inNiger – Food Aid
Background
LEDC, landlocked country in West Africa
One of the world’s poorest countries
Hot and dry climate
Increased population by 12 million in 50 years
Highest fertility rate – 7.1 births per women
2.9% growth rate
Plumpy nut advantages
Prevents malnutrition,
Tastes nice
Children can feed themselves
Rich in vitamins
Cheap
Impacts
Children are being treated at home
Children are happier and their appetite improves
Can focus on education instead of starvation
Parents can work and earn money as they have time instead of finding food for children
31.
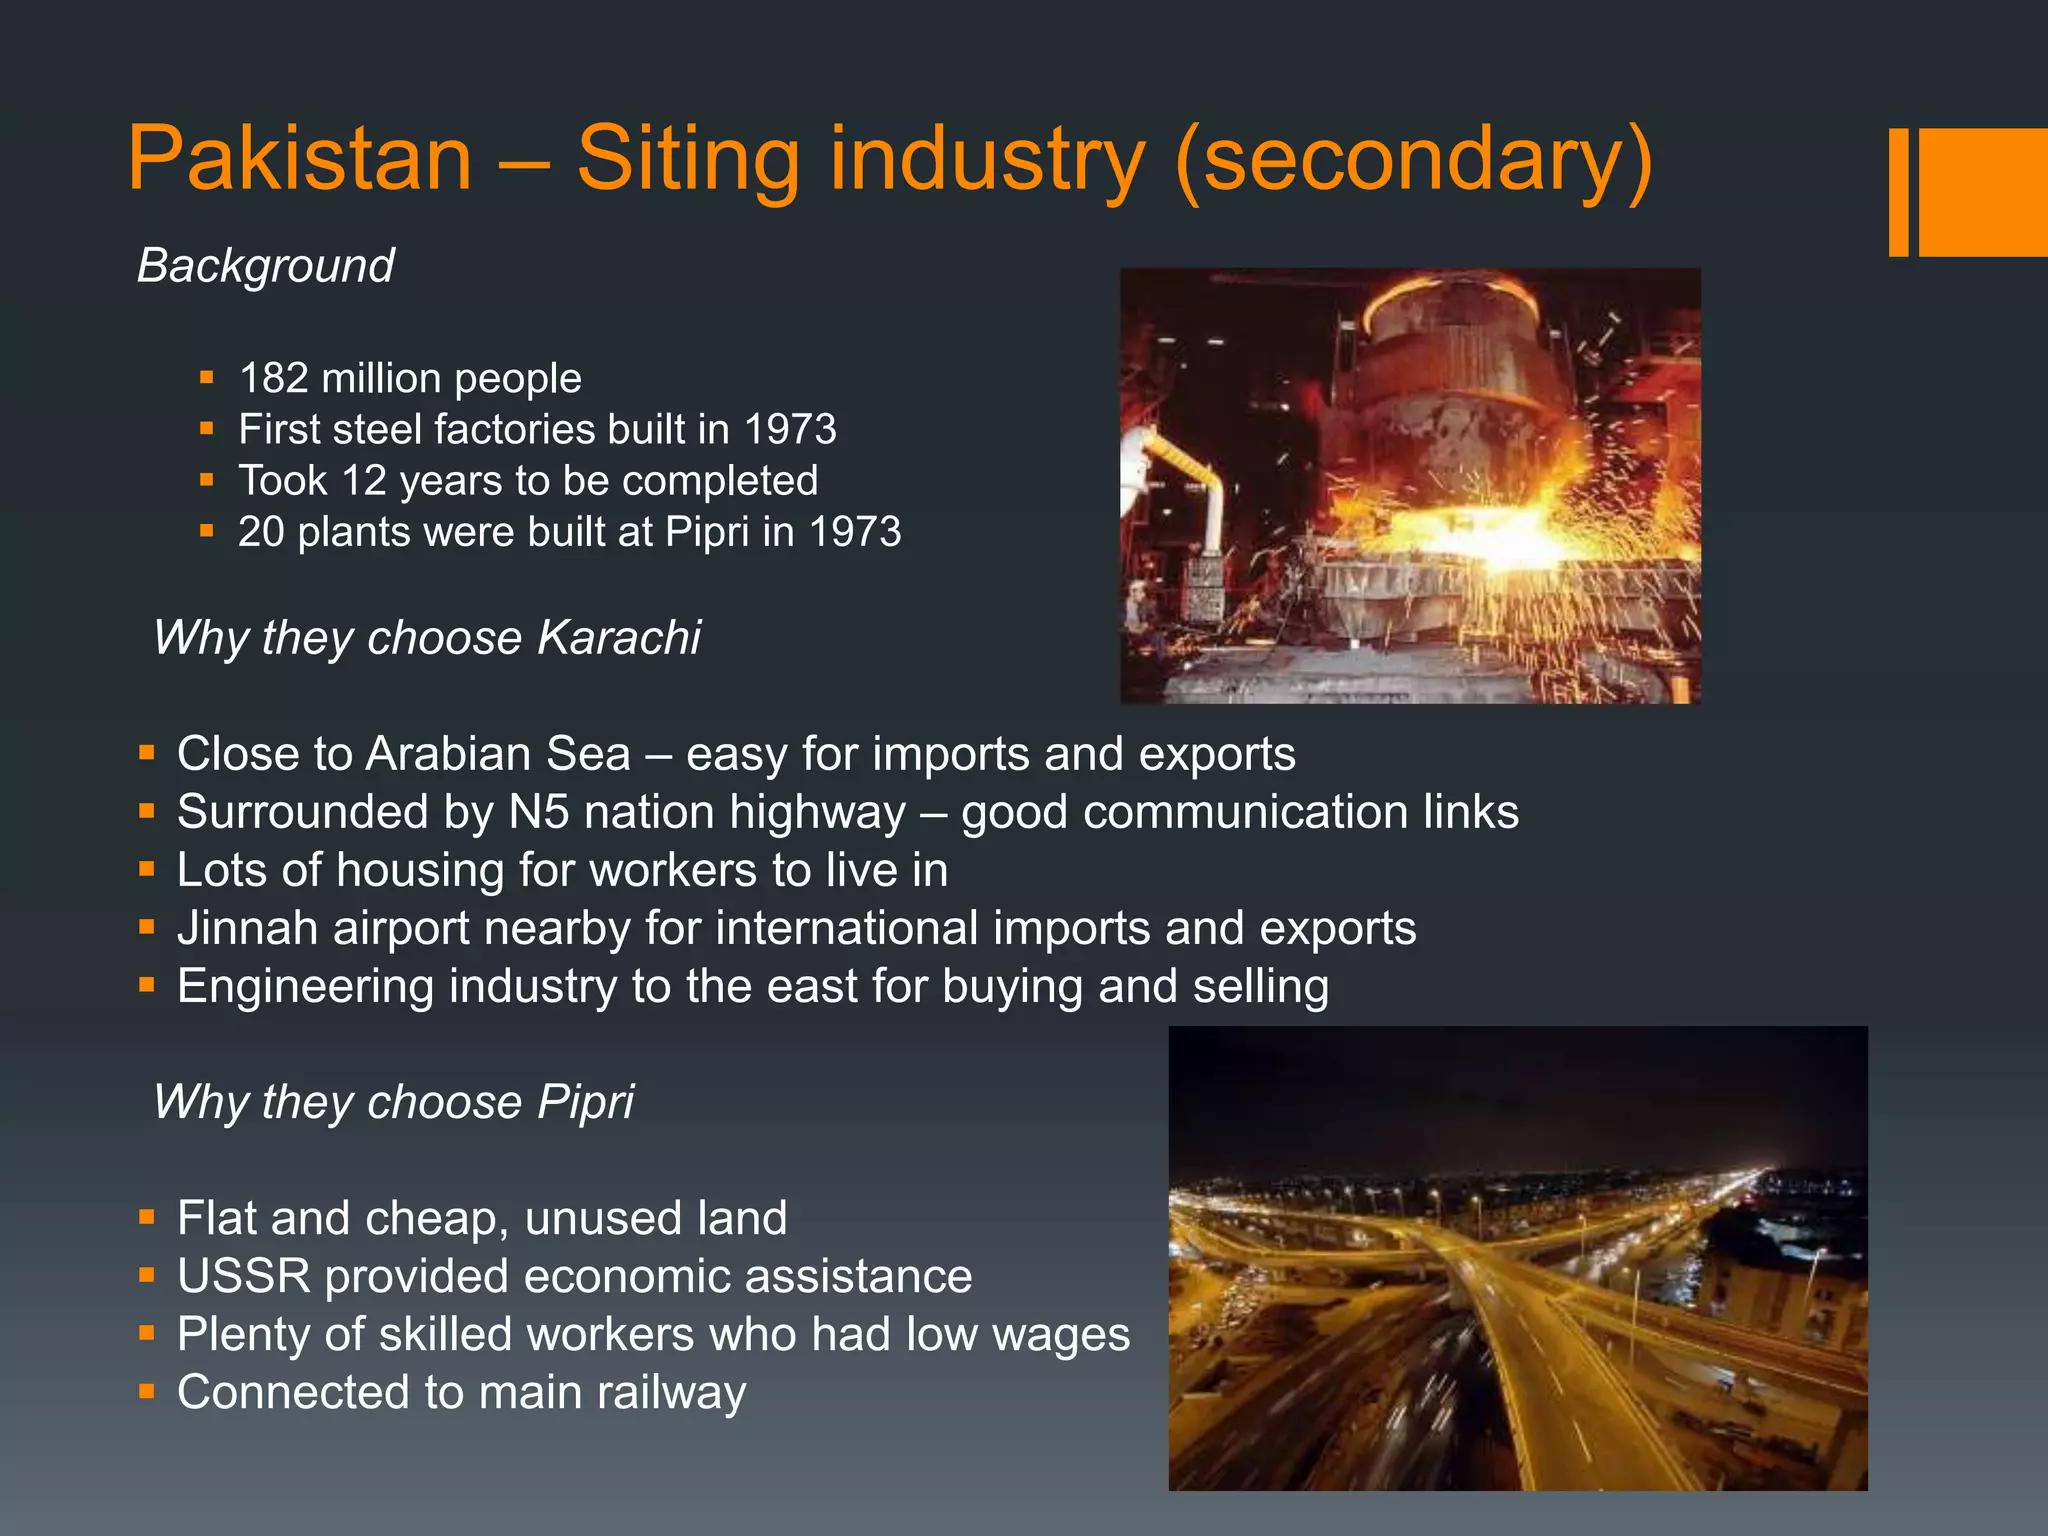
Pakistan – Sitingindustry (secondary)
Background
182 million people
First steel factories built in 1973
Took 12 years to be completed
20 plants were built at Pipri in 1973
Why they choose Karachi
Close to Arabian Sea – easy for imports and exports
Surrounded by N5 nation highway – good communication links
Lots of housing for workers to live in
Jinnah airport nearby for international imports and exports
Engineering industry to the east for buying and selling
Why they choose Pipri
Flat and cheap, unused land
USSR provided economic assistance
Plenty of skilled workers who had low wages
Connected to main railway
32.
Cambridge Science Park– High tech industry
Background
1.6 million square ft of buildings
Home to roughly 66 companies
Established by Trinity College in 1970
Choice of location
Companies – 66 on site e.g Worldpay, provides multi-currency
internet 1 card payment systems
Amenities – Landscaped and has facilities e.g health and fitness
centre
Infrastructure – used to be farmland, space for car parks and
expansion
Location – on rural-urban fringe, easily accessible on M11, not far
from Stanstead Airport
33.
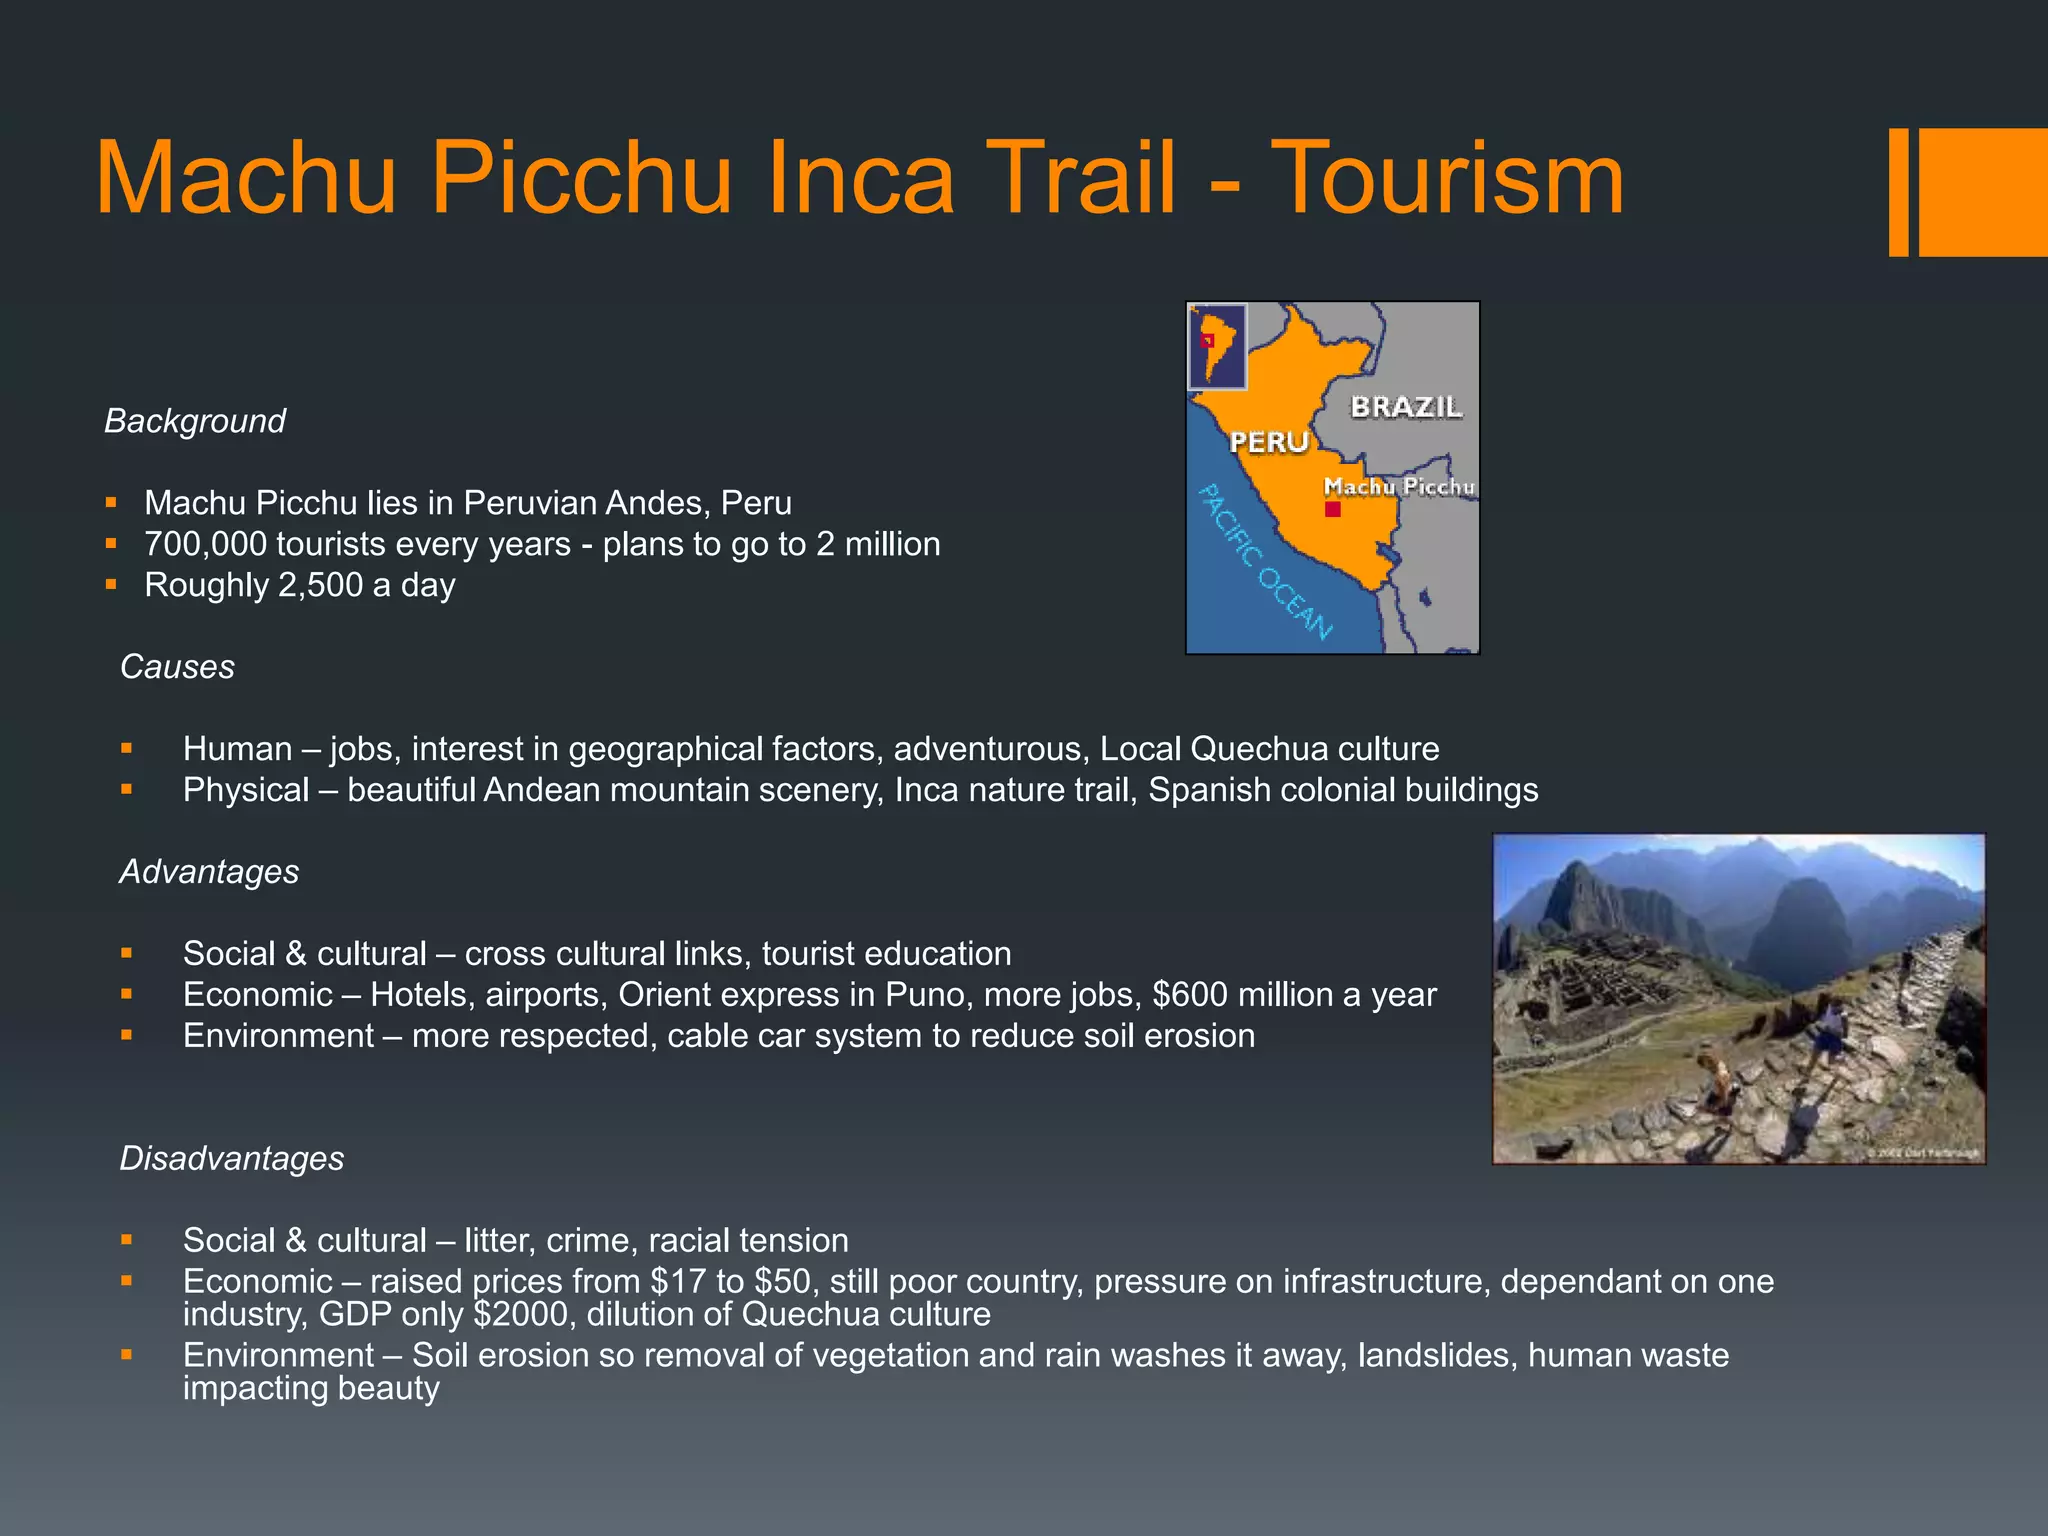
Machu Picchu IncaTrail - Tourism
Background
Machu Picchu lies in Peruvian Andes, Peru
700,000 tourists every years - plans to go to 2 million
Roughly 2,500 a day
Causes
Human – jobs, interest in geographical factors, adventurous, Local Quechua culture
Physical – beautiful Andean mountain scenery, Inca nature trail, Spanish colonial buildings
Advantages
Social & cultural – cross cultural links, tourist education
Economic – Hotels, airports, Orient express in Puno, more jobs, $600 million a year
Environment – more respected, cable car system to reduce soil erosion
Disadvantages
Social & cultural – litter, crime, racial tension
Economic – raised prices from $17 to $50, still poor country, pressure on infrastructure, dependant on one
industry, GDP only $2000, dilution of Quechua culture
Environment – Soil erosion so removal of vegetation and rain washes it away, landslides, human waste
impacting beauty
34.
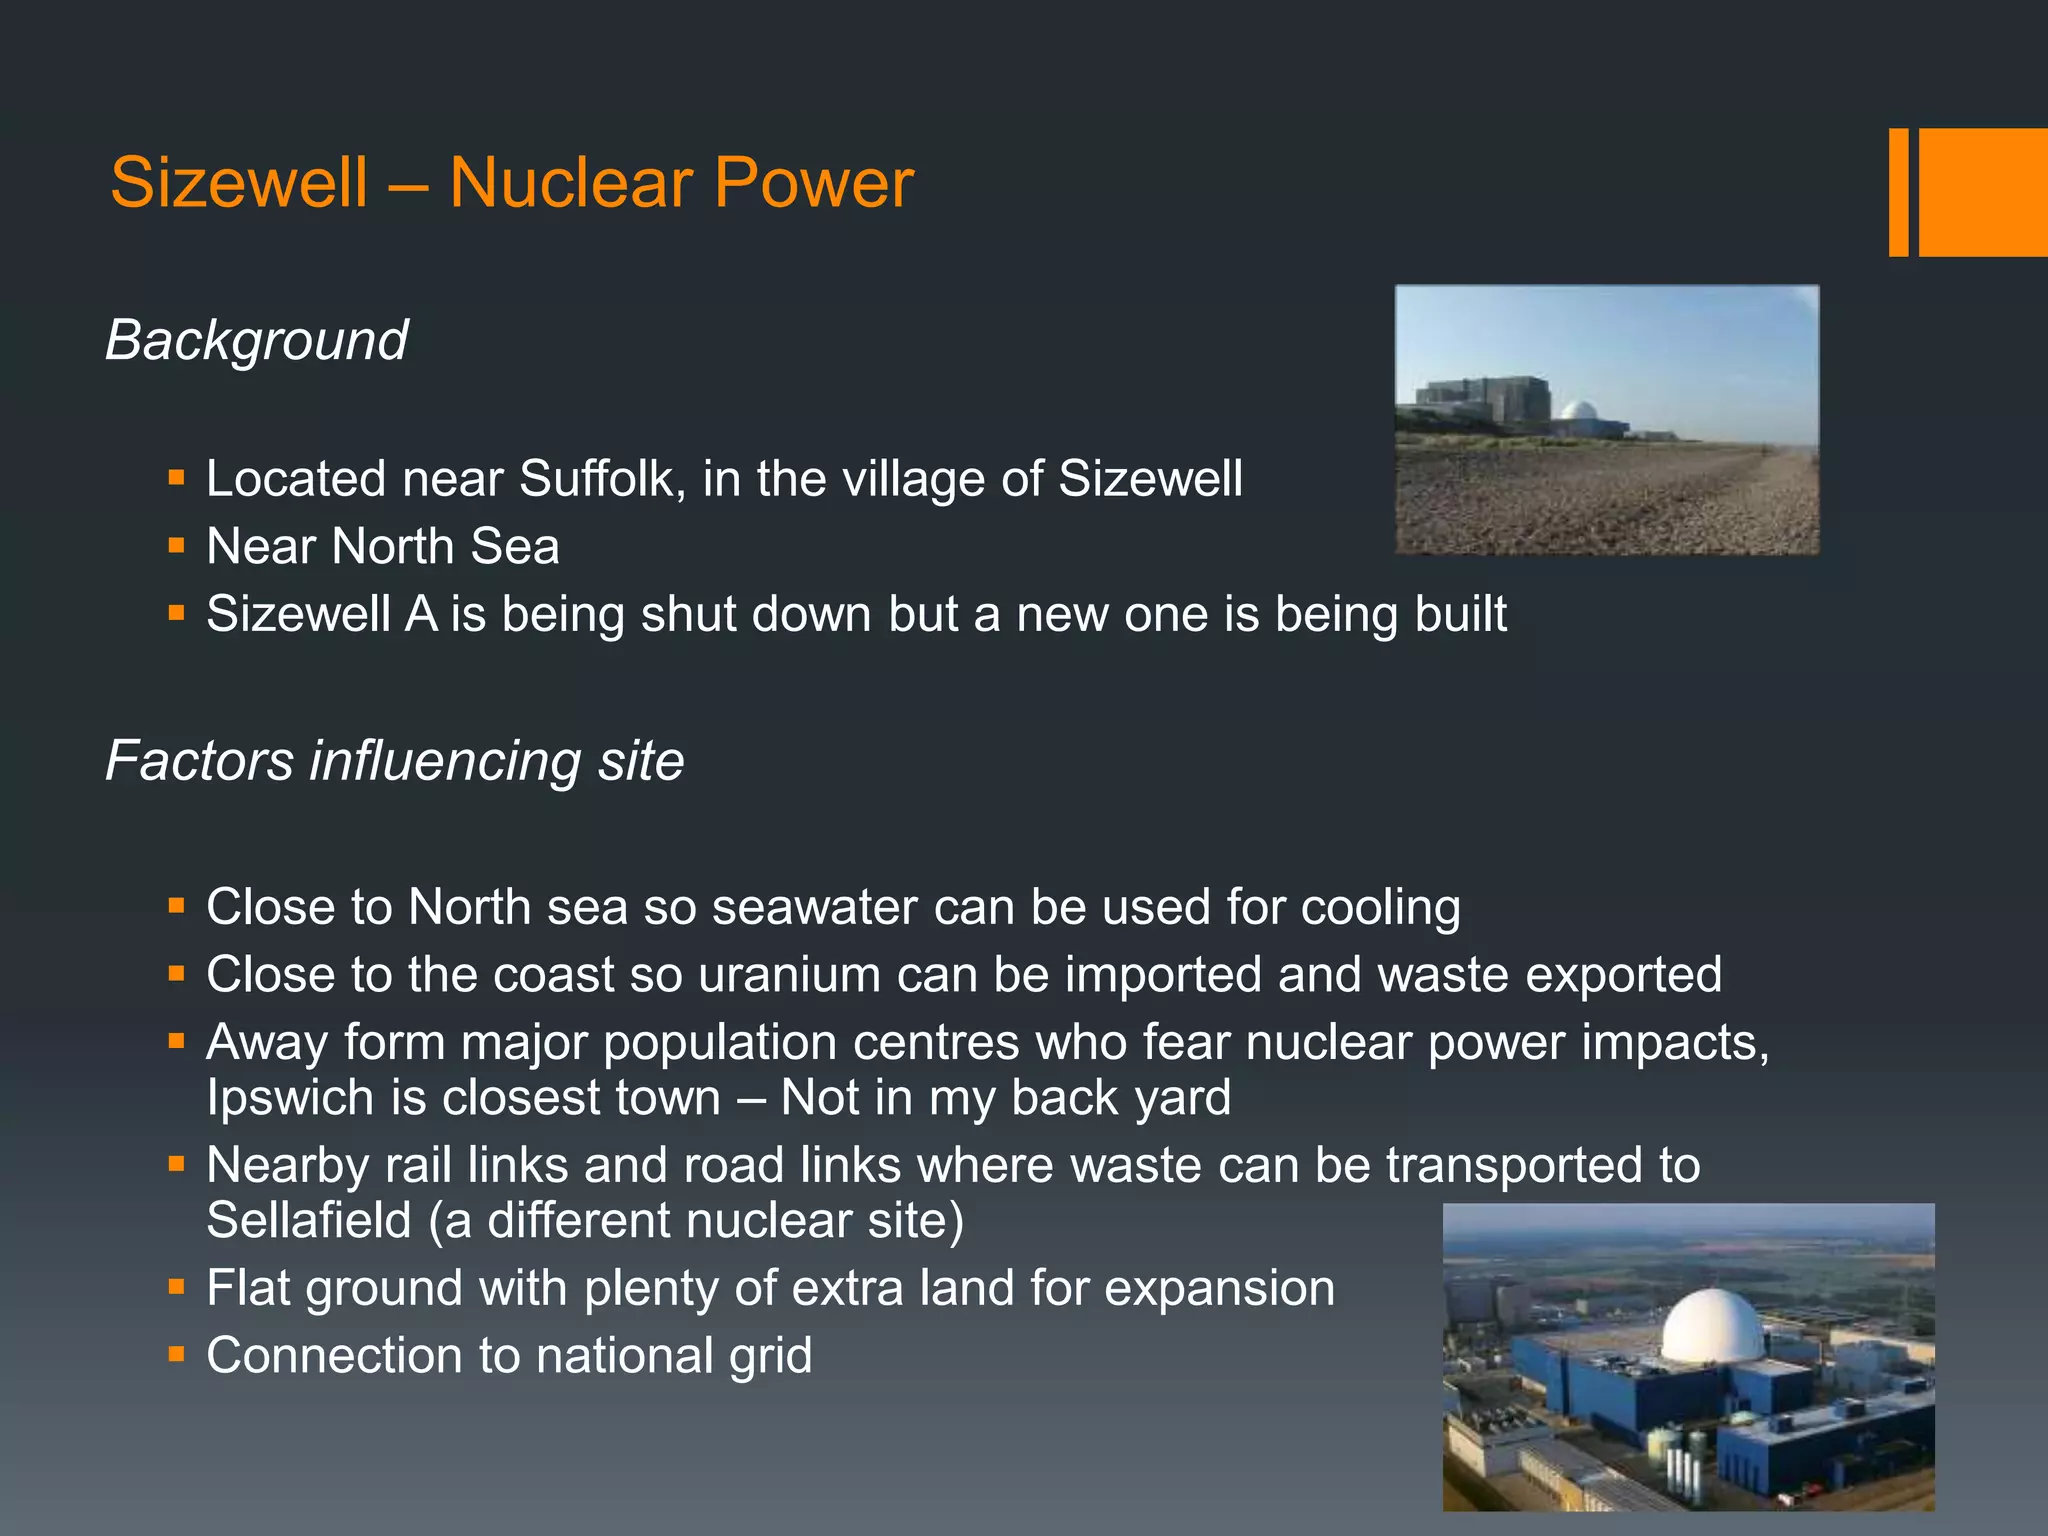
Sizewell – NuclearPower
Background
Located near Suffolk, in the village of Sizewell
Near North Sea
Sizewell A is being shut down but a new one is being built
Factors influencing site
Close to North sea so seawater can be used for cooling
Close to the coast so uranium can be imported and waste exported
Away form major population centres who fear nuclear power impacts,
Ipswich is closest town – Not in my back yard
Nearby rail links and road links where waste can be transported to
Sellafield (a different nuclear site)
Flat ground with plenty of extra land for expansion
Connection to national grid
35.
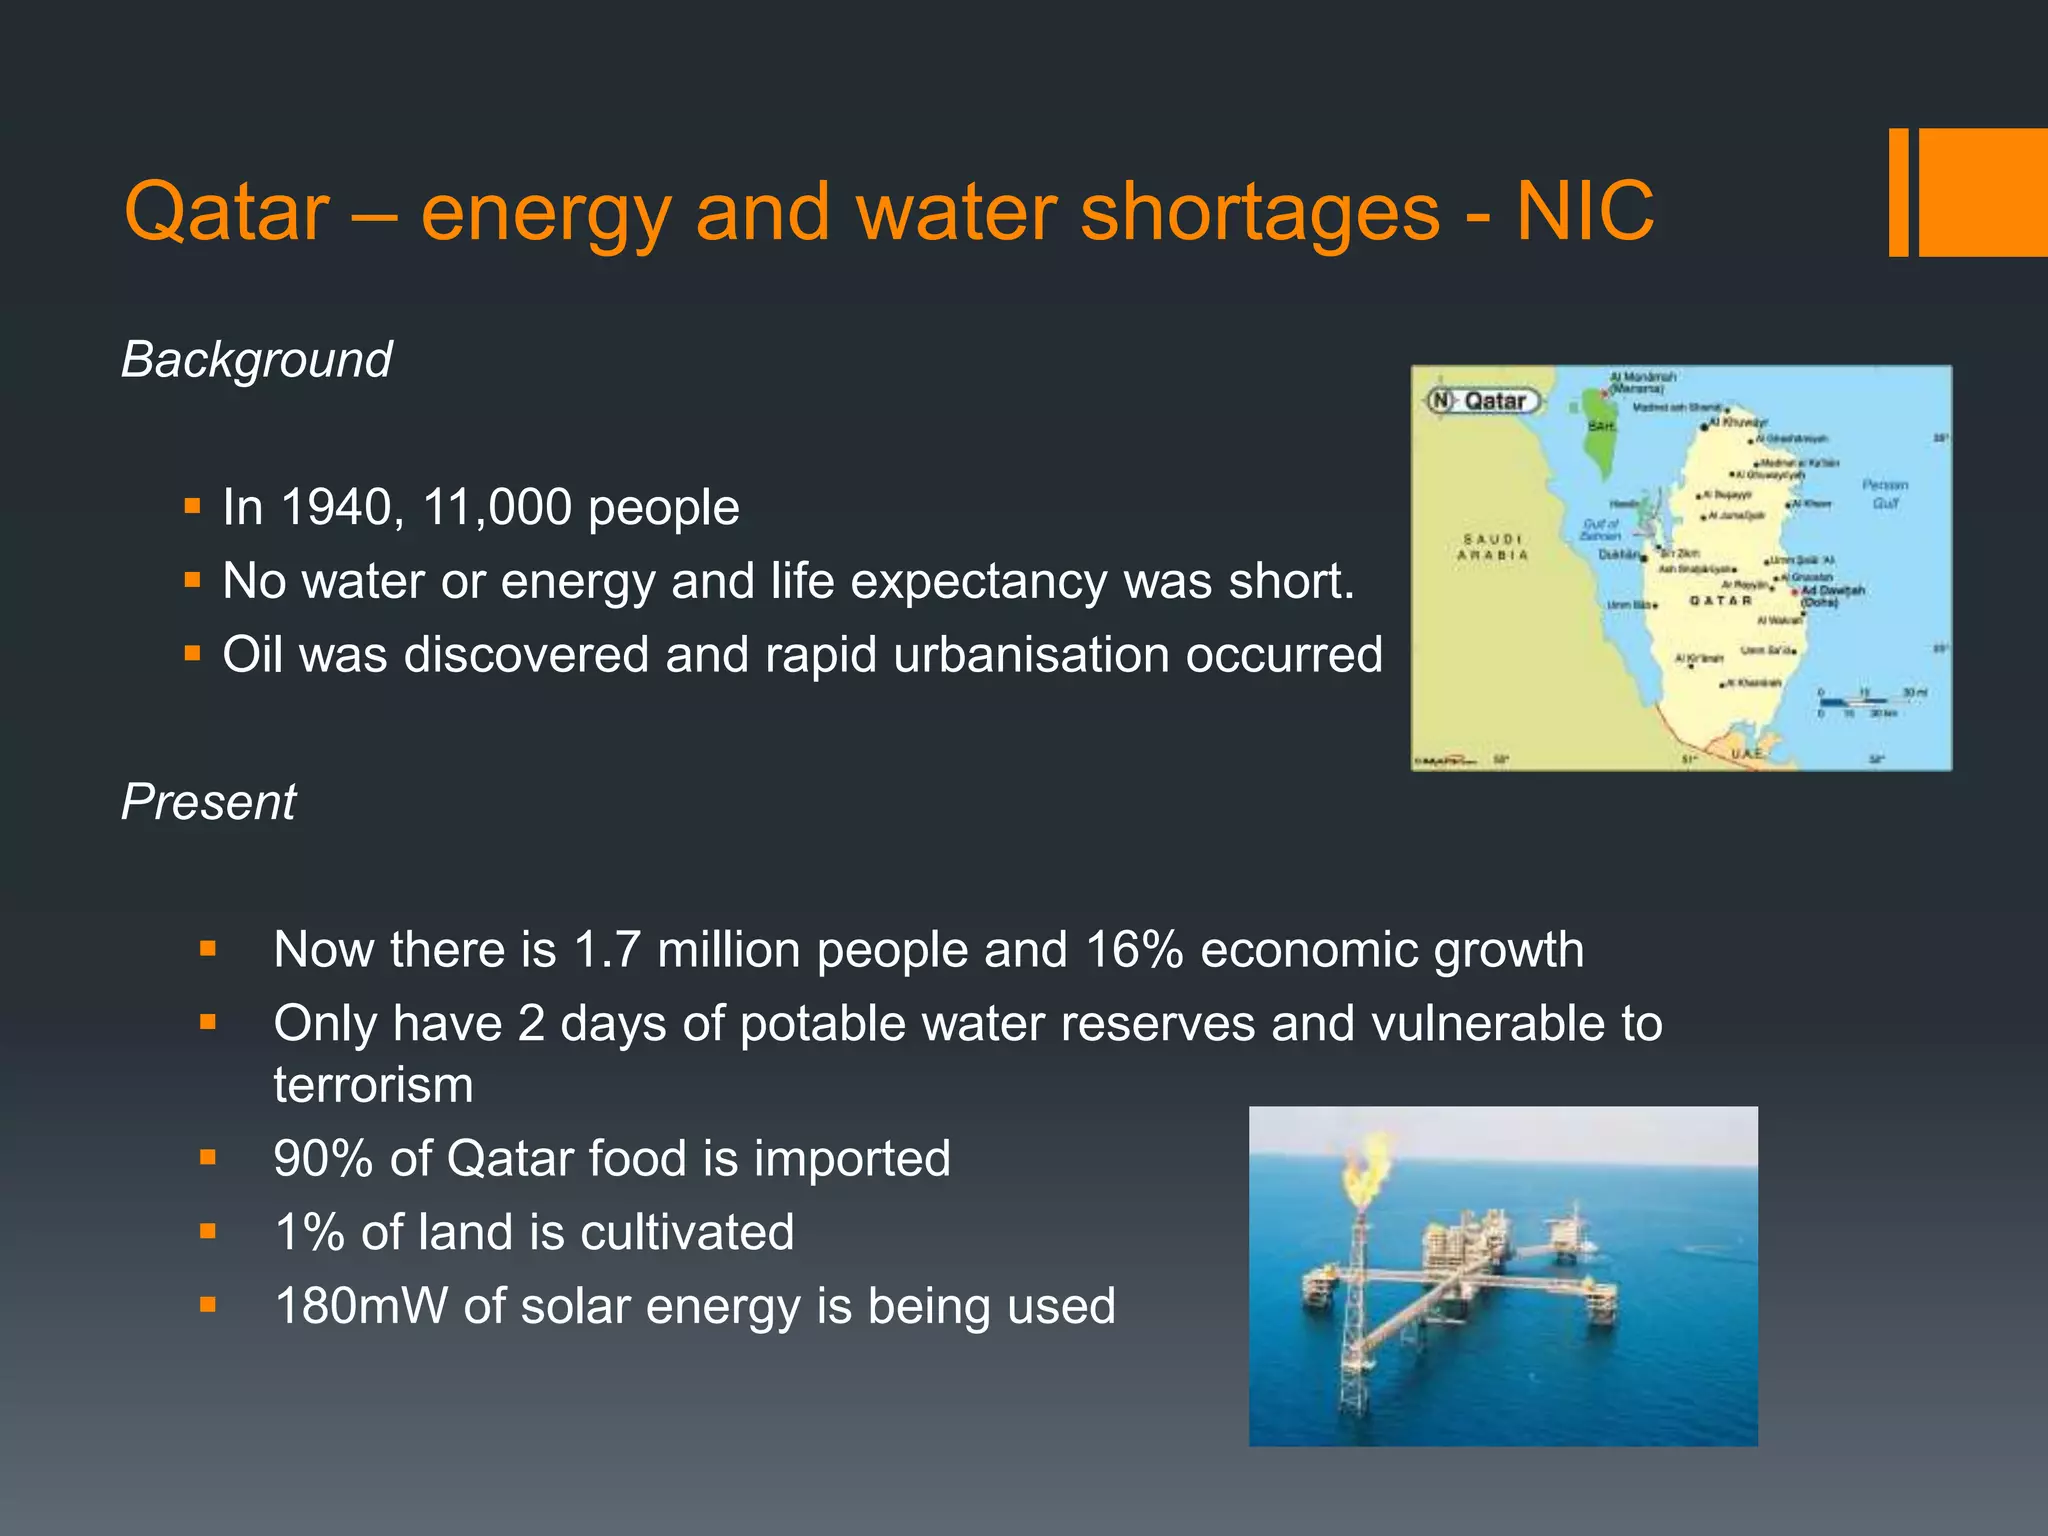
Qatar – energyand water shortages - NIC
Background
In 1940, 11,000 people
No water or energy and life expectancy was short.
Oil was discovered and rapid urbanisation occurred
Present
Now there is 1.7 million people and 16% economic growth
Only have 2 days of potable water reserves and vulnerable to
terrorism
90% of Qatar food is imported
1% of land is cultivated
180mW of solar energy is being used