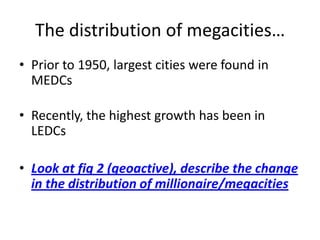
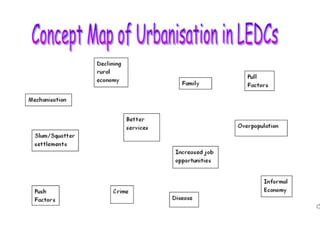
Urban environments are becoming increasingly populated as rates of urbanization rise globally. Some key points:
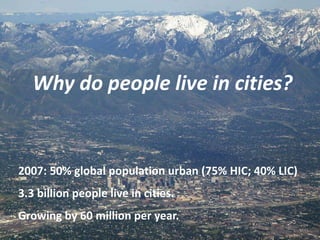
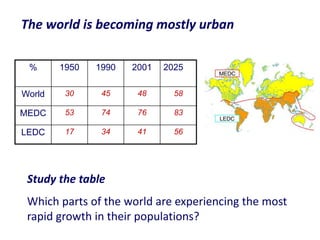
- By 2025, it is estimated that 58% of the world's population will live in urban areas, up from 30% in 1950. Urbanization is occurring most rapidly in less economically developed countries (LEDCs).
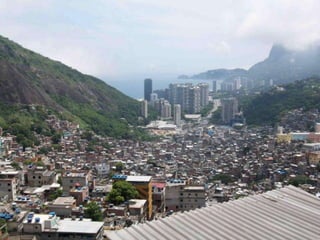
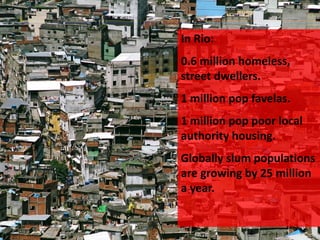
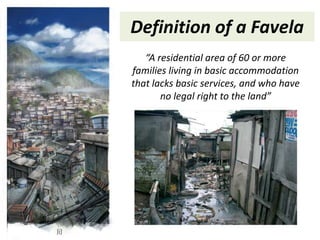
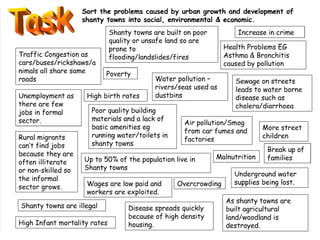
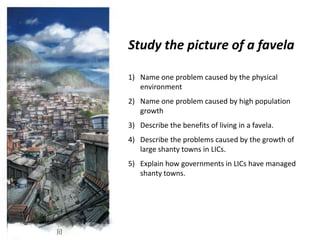
- Many LEDC cities face severe problems related to rapid urban growth, including lack of adequate housing, infrastructure, and services. Poor residents often live in slums and informal settlements that lack clean water, sanitation, and other basic amenities.
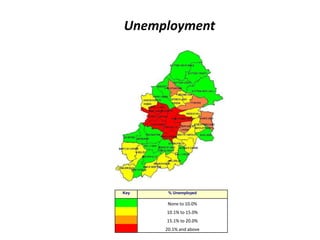
- Common issues in large urban areas in LEDCs include overcrowding, poor public health, traffic congestion, unemployment, and crime. Rising