CDG - Paris Charles De Gaulle Airport
•
0 likes•443 views

This article define the KPIs of airports, how to define and set targets, it is about CDG Airport

Recommended
Recommended
More Related Content
What's hot
What's hot (20)
Similar to CDG - Paris Charles De Gaulle Airport
Similar to CDG - Paris Charles De Gaulle Airport (20)
More from Mohammed Awad
More from Mohammed Awad (20)
Recently uploaded
Recently uploaded (20)
CDG - Paris Charles De Gaulle Airport
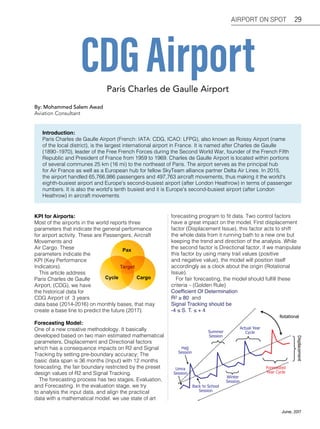
- 1. Introduction: Paris Charles de Gaulle Airport (French: IATA: CDG, ICAO: LFPG), also known as Roissy Airport (name of the local district), is the largest international airport in France. It is named after Charles de Gaulle (1890–1970), leader of the Free French Forces during the Second World War, founder of the French Fifth Republic and President of France from 1959 to 1969. Charles de Gaulle Airport is located within portions of several communes 25 km (16 mi) to the northeast of Paris. The airport serves as the principal hub for Air France as well as a European hub for fellow SkyTeam alliance partner Delta Air Lines. In 2015, the airport handled 65,766,986 passengers and 497,763 aircraft movements, thus making it the world's eighth-busiest airport and Europe's second-busiest airport (after London Heathrow) in terms of passenger numbers. It is also the world's tenth busiest and it is Europe's second-busiest airport (after London Heathrow) in aircraft movements. By: Mohammed Salem Awad Aviation Consultant KPI for Airports: Most of the airports in the world reports three parameters that indicate the general performance for airport activity. These are Passengers, Aircraft Movements and Air Cargo. These parameters indicate the KPI (Key Performance Indicators). This article address Paris Charles de Gaulle Airport, (CDG), we have the historical data for CDG Airport of 3 years data base (2014-2016) on monthly bases, that may create a base line to predict the future (2017). Forecasting Model: One of a new creative methodology. It basically developed based on two main estimated mathematical parameters, Displacement and Directional factors which has a consequence impacts on R2 and Signal Tracking by setting pre-boundary accuracy; The basic data span is 36 months (Input) with 12 months forecasting, the fair boundary restricted by the preset design values of R2 and Signal Tracking. The forecasting process has two stages, Evaluation, and Forecasting. In the evaluation stage, we try to analysis the input data, and align the practical data with a mathematical model. we use state of art forecasting program to fit data. Two control factors have a great impact on the model, First displacement factor (Displacement Issue), this factor acts to shift the whole data from it running bath to a new one but keeping the trend and direction of the analysis. While the second factor is Directional factor, if we manipulate this factor by using many trail values (positive and negative value), the model will position itself accordingly as a clock about the origin (Rotational Issue). For fair forecasting, the model should fulfill these criteria – (Golden Rule) Coefficient Of Determination R2 ≥ 80 and Signal Tracking should be -4 ≤ S. T. ≤ + 4 CDGAirportParis Charles de Gaulle Airport 29AIRPORT ON SPOT June, 2017 CargoCycle Pax Target Rotational Actual Year CycleSummer Session Hajj Session Umra Session Winter Session Back to School Session Displacement Forecasted Year Cycle
- 2. Passengers Forecast - 2017: Pax Forecast = 67,387,303 Pax R2 = 95.04%, Annual Growth = + 1.67% Errors Range = + 9.43 to -8.16 Air Transport Movement Forecast (Cycles) - 2017 Cycle Forecast = 471,599 cycle R2 = 91.53%, Annual Growth = + 0.36% Errors Range = + 8.47 to -7.22 Air Cargo Forecast - 2017: Cargo Forecast = 1,959,530 M.T. R2 = 71.21%, Annual Growth = + 1.27% Errors Range = + 8.21 to -6.46 Air Mail Forecast - 2017: Mail Forecast = 180,388 M.T. R2 = 94.66%, Annual Growth = - 1.90% Errors Range = + 3.19 to -2.53 Case Study: Air Traffic Forecasting 30 AIRPORT ON SPOT caa.gov.qa 35,847 33,751 37,813 38,934 41,571 41,740 43,985 43,919 38,972 41,311 36,399 37,358 8.47 7.22- -10 0 10 20 30 40 50 60 70 80 90 100 110 24,000 26,000 28,000 30,000 32,000 34,000 36,000 38,000 40,000 42,000 44,000 46,000 48,000 TotalCycles TIME (Month) CDG Airport 2017 Air transport Movement Forecast By : M. S. Awadh Forecast cycles (Column) Errors Forecast cycles (Line) Actual cycles Errors Percentage Cycle Forecast 2017 = 471,599 cycle R2 = 91.53 % , Annual Growth = + 0.36 % Errors Range = + 8.47 to -7.22 153,719 153,645 169,155 160,014 157,976 163,920 168,082 153,155 157,356 176,303 174,469 171,735 8.21 6.46- -10 0 10 20 30 40 50 60 70 80 90 100 80,000 90,000 100,000 110,000 120,000 130,000 140,000 150,000 160,000 170,000 180,000 190,000 AirCargo-MetricTonne TIME (Month) CDG Airport 2017 Air Cargo Forecast By : M. S. Awadh Forecast Cargo (Column) Errors Forecast Cargo (Line) Actual Cargo Errors Percentage Air Cargo (M.T.) Forecast 2017 = 1,959,530 M.T. R2 = 71.21 % , Annual Growth = + 1.27 % Errors Range = +8.21 to - 6.46 15,565 14,075 15,167 14,790 13,696 14,323 14,714 14,115 14,758 15,780 15,403 18,002 3.19 2.53- -10 -5 0 5 10 15 20 25 30 35 40 45 50 55 60 65 70 75 80 85 90 10,000 11,000 12,000 13,000 14,000 15,000 16,000 17,000 18,000 19,000 20,000 AirMail-MetricTonne TIME (Month) CDG Airport 2017 Air Mail Forecast By : M. S. Awadh Forecast Air Mail (Column) Errors Forecast Air Mail (Line) Actual Air Mail Errors Percentage Mail (M.T.) Forecast 2017 = 180,388 M.T. R2 = 94.66 % , Annual Growth = - 1.90 % Errors Range = +3.19 to - 2.53 4,808,772 4,522,042 5,234,830 5,602,618 5,909,309 6,159,927 6,688,721 6,866,607 5,626,697 5,970,111 4,858,540 5,139,129 9.43 8.16- -10 -5 0 5 10 15 20 25 30 35 40 45 50 55 60 65 70 75 0 500,000 1,000,000 1,500,000 2,000,000 2,500,000 3,000,000 3,500,000 4,000,000 4,500,000 5,000,000 5,500,000 6,000,000 6,500,000 7,000,000 7,500,000 8,000,000 8,500,000 TotalPassengers TIME (Month) CDG Airport 2017 Passengers Forecast By : M. S. Awadh Forecast Pax (Column) Errors Forecast Pax (Line) Actual Pax Pax Forecast 2017 = 67,387,303 Pax R2 = 95.04 % , Annual Growth = + 1.67 % Errors Range = + 9.43 to -8.16 Errors Percentage
- 3. Accuarcy Forecasting Matrix (0.50) (0.10) 0.10 0.30 (0.20) (0.30) - 0.50 1.00 1.50(1.00)(1.50) Cycle Cargo RelativeR2 Relative Signal Tracking Pax Mail 0.30 Factors Passengers Pax Aircraft Movements Cycle Air Cargo M. T. Air Mall M. T. 2017 Forecast 67,387,303 471,599 1,959,530 180,388 Annual Growth 1.67% 0.36% 1.27% -1.90% R-Square 95.04% 91.53% 71.21% 94.66% Errors Range +9.43 to -8.16 +8.47 to -7.22 +8.21 to -6.46 3.19 to -2.53 Mislead Poor Fair Unrelated Accuracy Forecasting Matrix: The best way to define the forecasting accuracy is to study the relations between R2 and Signal Tracking in the form of Accuracy Forecasting Matrix Most of analysis factors located in Mislead Region, As Signal Tracking values are greater than ± 4, but the Signal Tracking values are distributed on both sides of the basic trend line (also the errors) i.e, which means no effect of displacement issue. Resulting – Passengers, Aircraft Movement and Air Mail have a high forecasting accuracy which is consider a Fair Situation, while Air Cargo is more likely to be poor forecast level (R2 = 71.2 % and Signal Tracking = 6.01). Forecasting Results: The result of forecasting is almost fairs as R is very high except Cargo, Cargo forecast is not good for monthly target. However, it can be to annually forecast, using 12 month rolling method. For monthly targets, the Bar graphs represents the values of these targets for each (Passengers, Air Craft Movements, Air Cargo, and Air Mail.) while the corresponding errors written down in the same graph. Summary Three parameters will reflects the performance for airports, i.e Traffic Flow for Passengers, Aircraft Movements and Air cargo Activities (Air Cargo + Air Mail). That create the base for KPIs performance system for the airport. So by developing targets, and setting the company policy to define the threshold values for KPIs levels we can measure the airport performance. In this article we address Air traffic activity of CDG airport, the basic analysis reflects 3 years database. The seasonality models are well defined When we compare the actual data with the model values. The models are fairly fitted with coefficient of determinations are more likely greater than (91 %) except air cargo model which shows a lower level of coefficient of determination (71.21%) So 2017 Traffic Passengers = 67,387,303 Pax, at expect growth = 1.67%, 2017 Air craft Movement = 471,599 Cycle at expected growth = 0.36 %, 2017 Air Cargo = 1,959,530 M.T. at expected growth = 1.27%, 2017 Air Mail = 180,388 M.T. at expected growth = -1.90% 31AIRPORT ON SPOT June, 2017 Factors Coefficient of Determination + Signal Tracking Passengers 0.9504 4.98 A/C Movement 0.9153 5.40 Air Cargo 0.7121 6.01 Air Mail 0.9466 4.61