Xiy airport 2docx
•
1 like•199 views

Xi’an Xianyang International Airport, airport code: XIY, Xian Xianyang Airport is the international gateway to Xian City, capital of Shaanxi province and one of the world’s most populous areas. Hosting domestic, regional and international passenger and cargo services, Xianyang Airport is a major hub for airlines including China Eastern, China Southern and Hainan Airlines.

Recommended
More Related Content
Similar to Xiy airport 2docx
Similar to Xiy airport 2docx (20)
More from Mohammed Awad
More from Mohammed Awad (20)
Recently uploaded
Recently uploaded (20)
Xiy airport 2docx
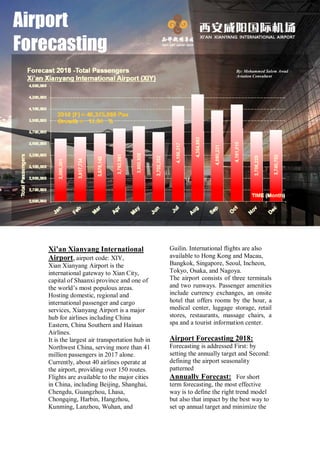
- 1. Xi’an Xianyang International Airport, airport code: XIY, Xian Xianyang Airport is the international gateway to Xian City, capital of Shaanxi province and one of the world’s most populous areas. Hosting domestic, regional and international passenger and cargo services, Xianyang Airport is a major hub for airlines including China Eastern, China Southern and Hainan Airlines. It is the largest air transportation hub in Northwest China, serving more than 41 million passengers in 2017 alone. Currently, about 40 airlines operate at the airport, providing over 150 routes. Flights are available to the major cities in China, including Beijing, Shanghai, Chengdu, Guangzhou, Lhasa, Chongqing, Harbin, Hangzhou, Kunming, Lanzhou, Wuhan, and Guilin. International flights are also available to Hong Kong and Macau, Bangkok, Singapore, Seoul, Incheon, Tokyo, Osaka, and Nagoya. The airport consists of three terminals and two runways. Passenger amenities include currency exchanges, an onsite hotel that offers rooms by the hour, a medical center, luggage storage, retail stores, restaurants, massage chairs, a spa and a tourist information center. Airport Forecasting 2018: Forecasting is addressed First: by setting the annually target and Second: defining the airport seasonality patterned Annually Forecast: For short term forecasting, the most effective way is to define the right trend model but also that impact by the best way to set up annual target and minimize the Airport Forecasting By: Mohammed Salem Awad Aviation Consultant
- 2. data discrepancy. Therefore, we address the data by two trend models Using the concept of 12 rolling months and a state of art – Addin function of XLS utility First – General Trend Model using the concept of Straight Line equation – defining general trend. Second – Most Recent Data Trend Model Using a Polynomial Model – Second-degree equation. This reflects the impact of most recent data on the path of general trend. The mid-point is the most convenient forecast annual result at Dec 2018. So as long as the gap between the two models is small, the more accurate approaching value for setting annual target otherwise we have to select the half way distance between two extreme targets of these two models (Dec 2018 = 46,375,869 Pax ) provided that Dec 2018 > Dec 2017. Monthly Forecast – we define the monthly targets that fulfill the condition of the first point (annual traffic setting forecast 2018 = 46,375,869 Pax) with minimum errors. Which shows a fair result in the second graph, at R-squared = 96.89 %, Annual Growth = 11.94 % and a clear picture about the seasonality pattern of the airport is defined as shown in table and graph. Results: Forecast 2018 = 46,375,869 Pax Growth : 11.94 % R-square : 96.89 %