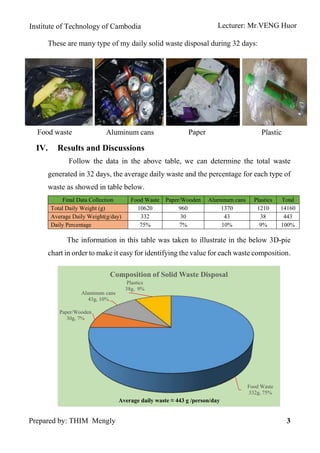
WASTE WATER TREATMENT
REPORT: SURVEY OFDAILY SOLID WASTE DISPOSAL
Lecturer : Mr.VENG Huor
Student : THIM Mengly
ID : e20120734
Group : I5B
Academic Year
2016-2017
INSTITUTE OF TECHNOLOGY OF CAMBODIA
DEPARTMENT OF RURALENGINEERING
Table of Contents
I. Introduction...................................................................................................1
II. Objective.....................................................................................................1
III. Data collection............................................................................................1
IV. Results and Discussions.............................................................................3
V. Conclusion..................................................................................................4
1
Lecturer: Mr.VENG HuorInstitute of Technology of Cambodia
Prepared by: THIM Mengly
I. Introduction
Solid wastes are the materials or substances which are discarded or
disposed by people after usage. Solid Wastes can come from many sources such
as: home, school, hospitals, industries, farms and other sources.
Since the industrial revolution, Solid wastes have been a major
environmental issue in everywhere. The disposal of solid waste is a problem that
continues to grow with the growth of population. There are many environmental
and human impacts which are caused by the careless of solid waste disposal. For
example: Air, soil and source of water at the damping site where the wastes are
disposed will be polluted due to the poor wastes management. Survey of daily
solid waste disposal is an important factor of best solid waste management that
everyone has to consider about.
II. Objective
The objective of this report is to estimate the average daily waste that a
person generates per day by collecting the data of daily solid waste disposal
during 32days.
III. Data collection
The solid waste that I have disposed in daily were recorded from 21st
October 2016 to 21st
November 2016. The collected solid wastes were separated
in two types: Organics (Food waste and Paper/Wooden) and Inorganics
(Aluminum cans and Plastic). This separation is aim to know the amount for each
type of waste that is present in total daily wastes.
SURVEY OF DAILY SOLID WASTE DISPOSAL
2
Lecturer: Mr.VENG HuorInstitute of Technology of Cambodia
Prepared by: THIM Mengly
Table 3.1: Data Collection
Data of Waste Disposal
Organic waste Inorganic waste
Food waste (g) Paper/Wooden (g) Aluminum cans (g) Plastic (g)
21-Oct-16 340 0 0 30
22-Oct-16 240 0 0 25
23-Oct-16 270 0 0 10
24-Oct-16 300 0 220 10
25-Oct-16 370 200 0 10
26-Oct-16 360 0 0 10
27-Oct-16 300 0 0 10
28-Oct-16 400 0 0 10
29-Oct-16 470 0 0 40
30-Oct-16 330 210 350 200
31-Oct-16 300 0 0 70
1-Nov-16 250 0 0 10
2-Nov-16 400 0 0 40
3-Nov-16 250 0 0 40
4-Nov-16 400 100 300 10
5-Nov-16 250 0 0 50
6-Nov-16 300 0 0 90
7-Nov-16 400 0 0 10
8-Nov-16 200 0 0 150
9-Nov-16 350 250 250 10
10-Nov-16 270 0 0 10
11-Nov-16 400 0 0 40
12-Nov-16 450 0 0 20
13-Nov-16 520 0 0 25
14-Nov-16 350 0 0 30
15-Nov-16 250 200 0 100
16-Nov-16 300 0 0 15
17-Nov-16 450 0 0 10
18-Nov-16 350 0 0 20
19-Nov-16 300 0 250 50
20-Nov-16 200 0 0 45
21-Nov-16 300 0 0 10
Total Weight (g) 10620 960 1370 1210
Average Daily Weight(g) 332 30 43 38
Daily Percentage 75% 7% 10% 9%
3
Lecturer: Mr.VENG HuorInstitute of Technology of Cambodia
Prepared by: THIM Mengly
These are many type of my daily solid waste disposal during 32 days:
IV. Results and Discussions
Follow the data in the above table, we can determine the total waste
generated in 32 days, the average daily waste and the percentage for each type of
waste as showed in table below.
Final Data Collection Food Waste Paper/Wooden Aluminum cans Plastics Total
Total Daily Weight (g) 10620 960 1370 1210 14160
Average Daily Weight(g/day) 332 30 43 38 443
Daily Percentage 75% 7% 10% 9% 100%
The information in this table was taken to illustrate in the below 3D-pie
chart in order to make it easy for identifying the value for each waste composition.
Food Waste
332g, 75%
Paper/Wooden
30g, 7%
Aluminum cans
43g, 10%
Plastics
38g, 9%
Composition of Solid Waste Disposal
Aluminum cans Paper PlasticFood waste
Average daily waste ≈ 443 g /person/day
4
Lecturer: Mr.VENG HuorInstitute of Technology of Cambodia
Prepared by: THIM Mengly
The result obtained from this survey shows that the total average daily solid
waste that were generated by a person per day is approximately 443g. Moreover,
we found that the Food waste (75%) is the biggest component in the average daily
solid waste generation. This was followed by the Paper with an overall average
of 7%. For plastics wastes overall average of 8% and aluminum overall average
of 10%.
Since the food waste is the majority component in the daily waste disposal,
it is recommended that the food waste can take to create the compost which is so
rich in nutrients that it improves the fertility of the soil to make plants healthier.
On the other hand, the food waste can also generate the biogas which is a
renewable source and also environmental friendly. Moreover, the other waste like:
paper/wooden, plastic and aluminum cans are the materials that can be recycled.
Anyways, before throwing them away, we should reuse them as possible as we
can in order to reduce the environmental impacts from these materials.
V. Conclusion
In conclusion , this survey found that the daily disposed waste is about
443 g/person/day. Moreover, the percentage of each component in the daily
waste were also determined. This information is very useful for improving the
waste management in our country. Separate waste collection method should be
selected for solid waste management since it is an efficiency method. When the
wastes are separated, it is easy for recycling process. Therefore, the amount of
waste is also decreased before disposing into landfill. Hence, the separate waste
collection is best way to preserve and maintain natural resources to not only our
benefit but also future generation’s benefit.

Report Daily Solid Waste Disposal

  • 1.
    WASTE WATER TREATMENT REPORT:SURVEY OFDAILY SOLID WASTE DISPOSAL Lecturer : Mr.VENG Huor Student : THIM Mengly ID : e20120734 Group : I5B Academic Year 2016-2017 INSTITUTE OF TECHNOLOGY OF CAMBODIA DEPARTMENT OF RURALENGINEERING
  • 2.
    Table of Contents I.Introduction...................................................................................................1 II. Objective.....................................................................................................1 III. Data collection............................................................................................1 IV. Results and Discussions.............................................................................3 V. Conclusion..................................................................................................4
  • 3.
    1 Lecturer: Mr.VENG HuorInstituteof Technology of Cambodia Prepared by: THIM Mengly I. Introduction Solid wastes are the materials or substances which are discarded or disposed by people after usage. Solid Wastes can come from many sources such as: home, school, hospitals, industries, farms and other sources. Since the industrial revolution, Solid wastes have been a major environmental issue in everywhere. The disposal of solid waste is a problem that continues to grow with the growth of population. There are many environmental and human impacts which are caused by the careless of solid waste disposal. For example: Air, soil and source of water at the damping site where the wastes are disposed will be polluted due to the poor wastes management. Survey of daily solid waste disposal is an important factor of best solid waste management that everyone has to consider about. II. Objective The objective of this report is to estimate the average daily waste that a person generates per day by collecting the data of daily solid waste disposal during 32days. III. Data collection The solid waste that I have disposed in daily were recorded from 21st October 2016 to 21st November 2016. The collected solid wastes were separated in two types: Organics (Food waste and Paper/Wooden) and Inorganics (Aluminum cans and Plastic). This separation is aim to know the amount for each type of waste that is present in total daily wastes. SURVEY OF DAILY SOLID WASTE DISPOSAL
  • 4.
    2 Lecturer: Mr.VENG HuorInstituteof Technology of Cambodia Prepared by: THIM Mengly Table 3.1: Data Collection Data of Waste Disposal Organic waste Inorganic waste Food waste (g) Paper/Wooden (g) Aluminum cans (g) Plastic (g) 21-Oct-16 340 0 0 30 22-Oct-16 240 0 0 25 23-Oct-16 270 0 0 10 24-Oct-16 300 0 220 10 25-Oct-16 370 200 0 10 26-Oct-16 360 0 0 10 27-Oct-16 300 0 0 10 28-Oct-16 400 0 0 10 29-Oct-16 470 0 0 40 30-Oct-16 330 210 350 200 31-Oct-16 300 0 0 70 1-Nov-16 250 0 0 10 2-Nov-16 400 0 0 40 3-Nov-16 250 0 0 40 4-Nov-16 400 100 300 10 5-Nov-16 250 0 0 50 6-Nov-16 300 0 0 90 7-Nov-16 400 0 0 10 8-Nov-16 200 0 0 150 9-Nov-16 350 250 250 10 10-Nov-16 270 0 0 10 11-Nov-16 400 0 0 40 12-Nov-16 450 0 0 20 13-Nov-16 520 0 0 25 14-Nov-16 350 0 0 30 15-Nov-16 250 200 0 100 16-Nov-16 300 0 0 15 17-Nov-16 450 0 0 10 18-Nov-16 350 0 0 20 19-Nov-16 300 0 250 50 20-Nov-16 200 0 0 45 21-Nov-16 300 0 0 10 Total Weight (g) 10620 960 1370 1210 Average Daily Weight(g) 332 30 43 38 Daily Percentage 75% 7% 10% 9%
  • 5.
    3 Lecturer: Mr.VENG HuorInstituteof Technology of Cambodia Prepared by: THIM Mengly These are many type of my daily solid waste disposal during 32 days: IV. Results and Discussions Follow the data in the above table, we can determine the total waste generated in 32 days, the average daily waste and the percentage for each type of waste as showed in table below. Final Data Collection Food Waste Paper/Wooden Aluminum cans Plastics Total Total Daily Weight (g) 10620 960 1370 1210 14160 Average Daily Weight(g/day) 332 30 43 38 443 Daily Percentage 75% 7% 10% 9% 100% The information in this table was taken to illustrate in the below 3D-pie chart in order to make it easy for identifying the value for each waste composition. Food Waste 332g, 75% Paper/Wooden 30g, 7% Aluminum cans 43g, 10% Plastics 38g, 9% Composition of Solid Waste Disposal Aluminum cans Paper PlasticFood waste Average daily waste ≈ 443 g /person/day
  • 6.
    4 Lecturer: Mr.VENG HuorInstituteof Technology of Cambodia Prepared by: THIM Mengly The result obtained from this survey shows that the total average daily solid waste that were generated by a person per day is approximately 443g. Moreover, we found that the Food waste (75%) is the biggest component in the average daily solid waste generation. This was followed by the Paper with an overall average of 7%. For plastics wastes overall average of 8% and aluminum overall average of 10%. Since the food waste is the majority component in the daily waste disposal, it is recommended that the food waste can take to create the compost which is so rich in nutrients that it improves the fertility of the soil to make plants healthier. On the other hand, the food waste can also generate the biogas which is a renewable source and also environmental friendly. Moreover, the other waste like: paper/wooden, plastic and aluminum cans are the materials that can be recycled. Anyways, before throwing them away, we should reuse them as possible as we can in order to reduce the environmental impacts from these materials. V. Conclusion In conclusion , this survey found that the daily disposed waste is about 443 g/person/day. Moreover, the percentage of each component in the daily waste were also determined. This information is very useful for improving the waste management in our country. Separate waste collection method should be selected for solid waste management since it is an efficiency method. When the wastes are separated, it is easy for recycling process. Therefore, the amount of waste is also decreased before disposing into landfill. Hence, the separate waste collection is best way to preserve and maintain natural resources to not only our benefit but also future generation’s benefit.