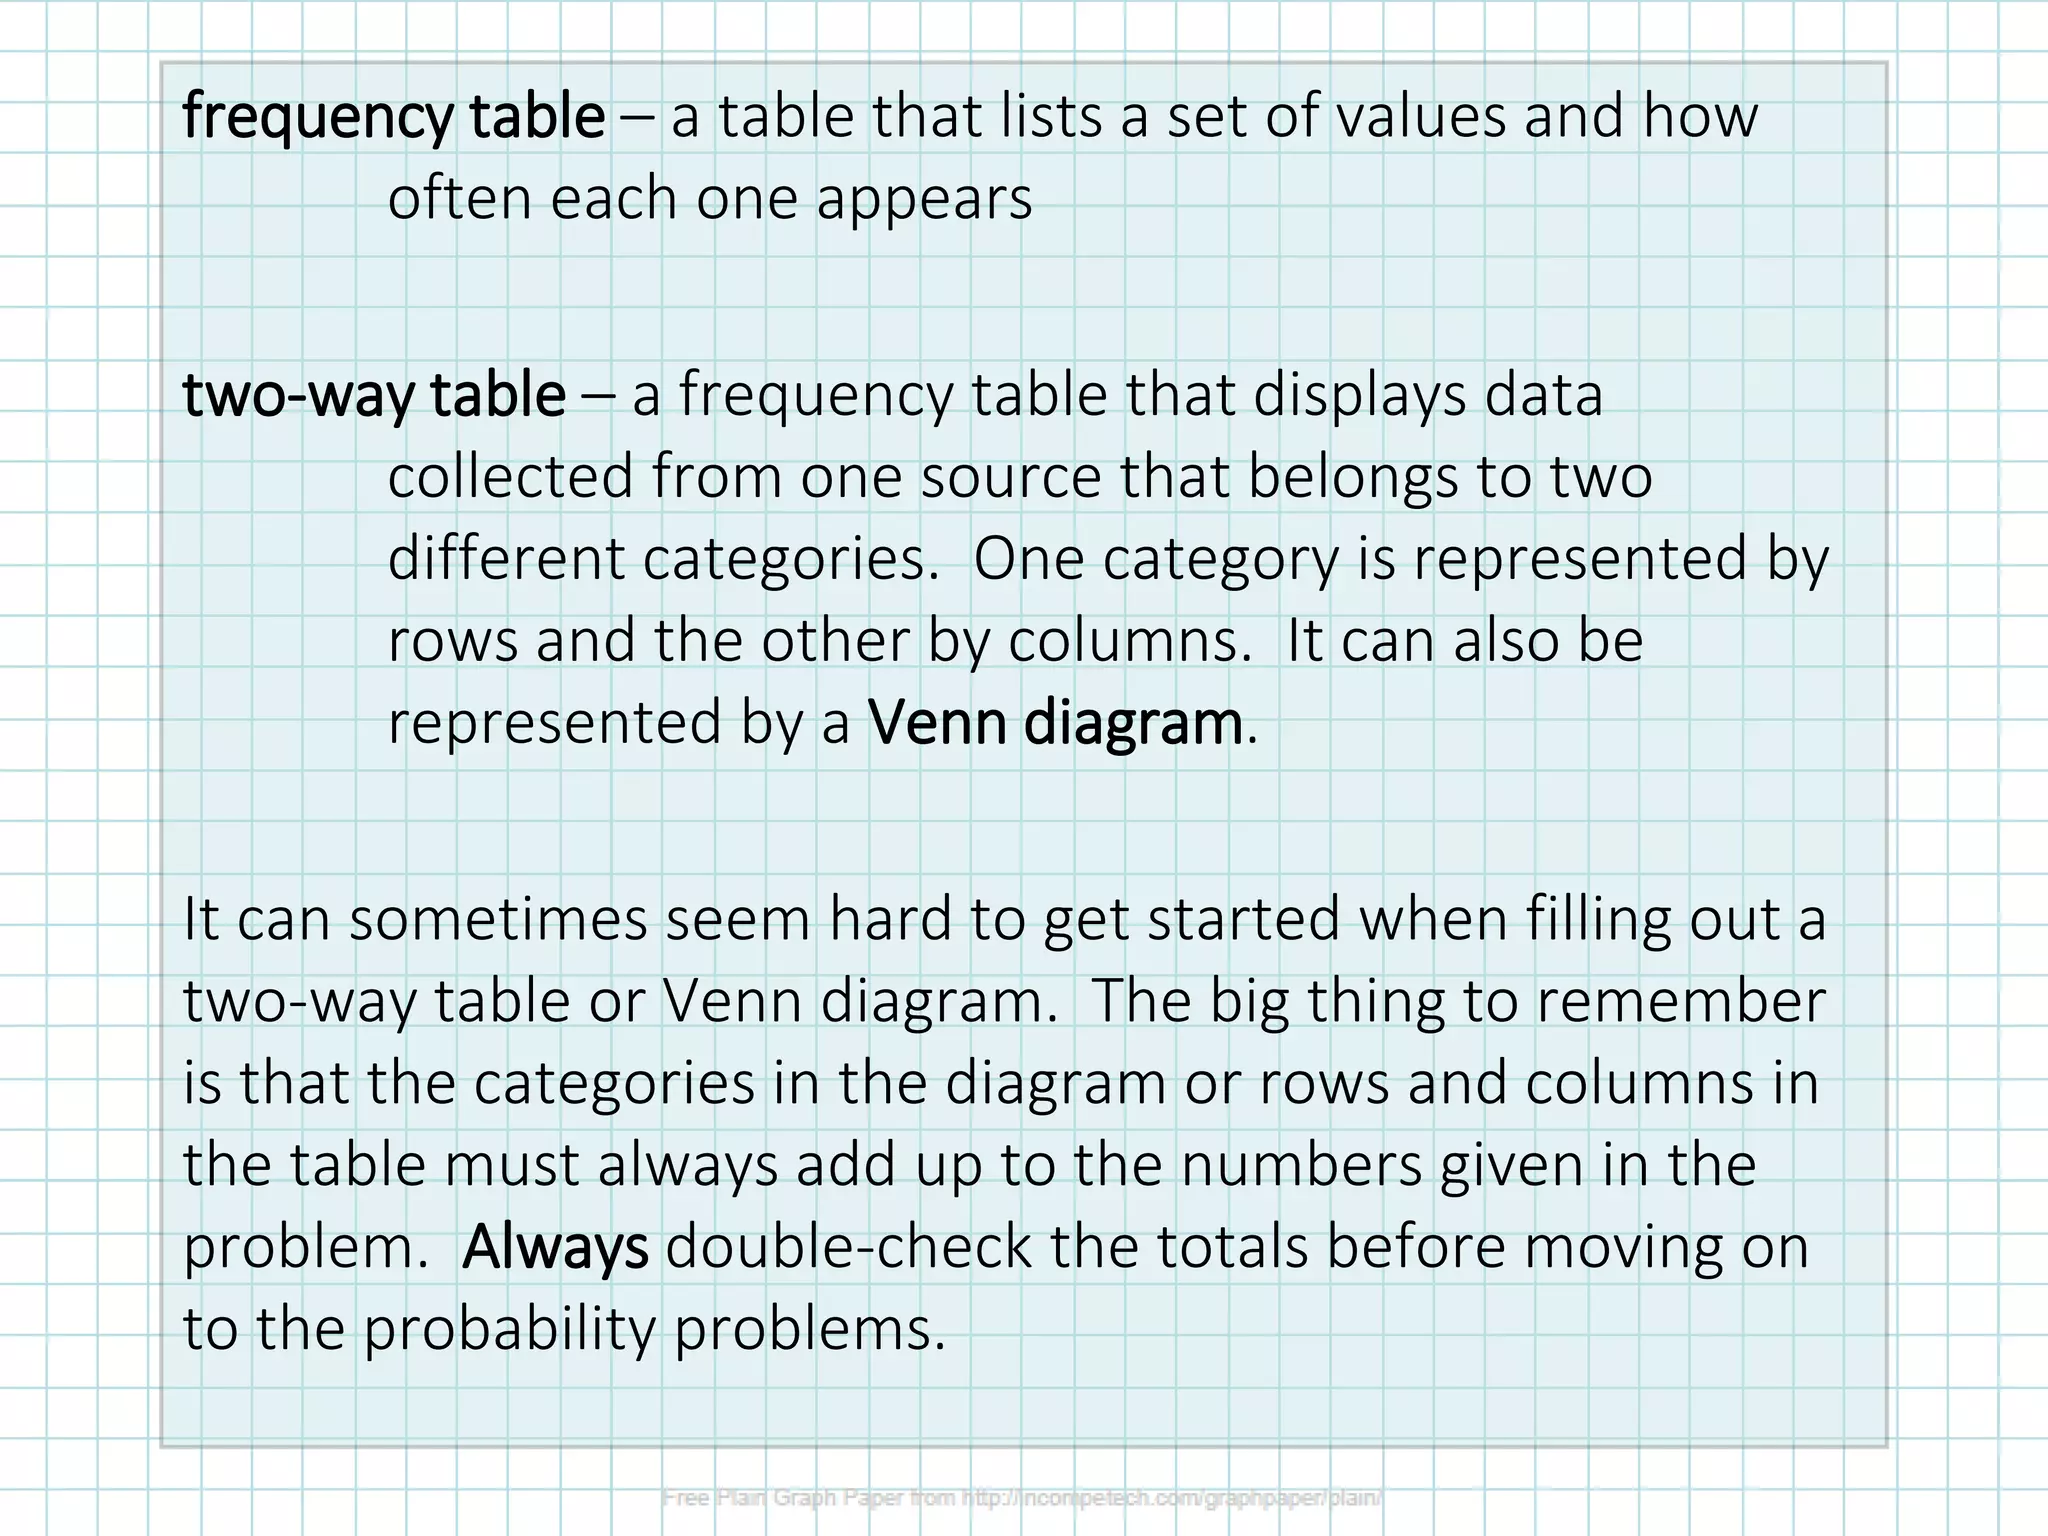
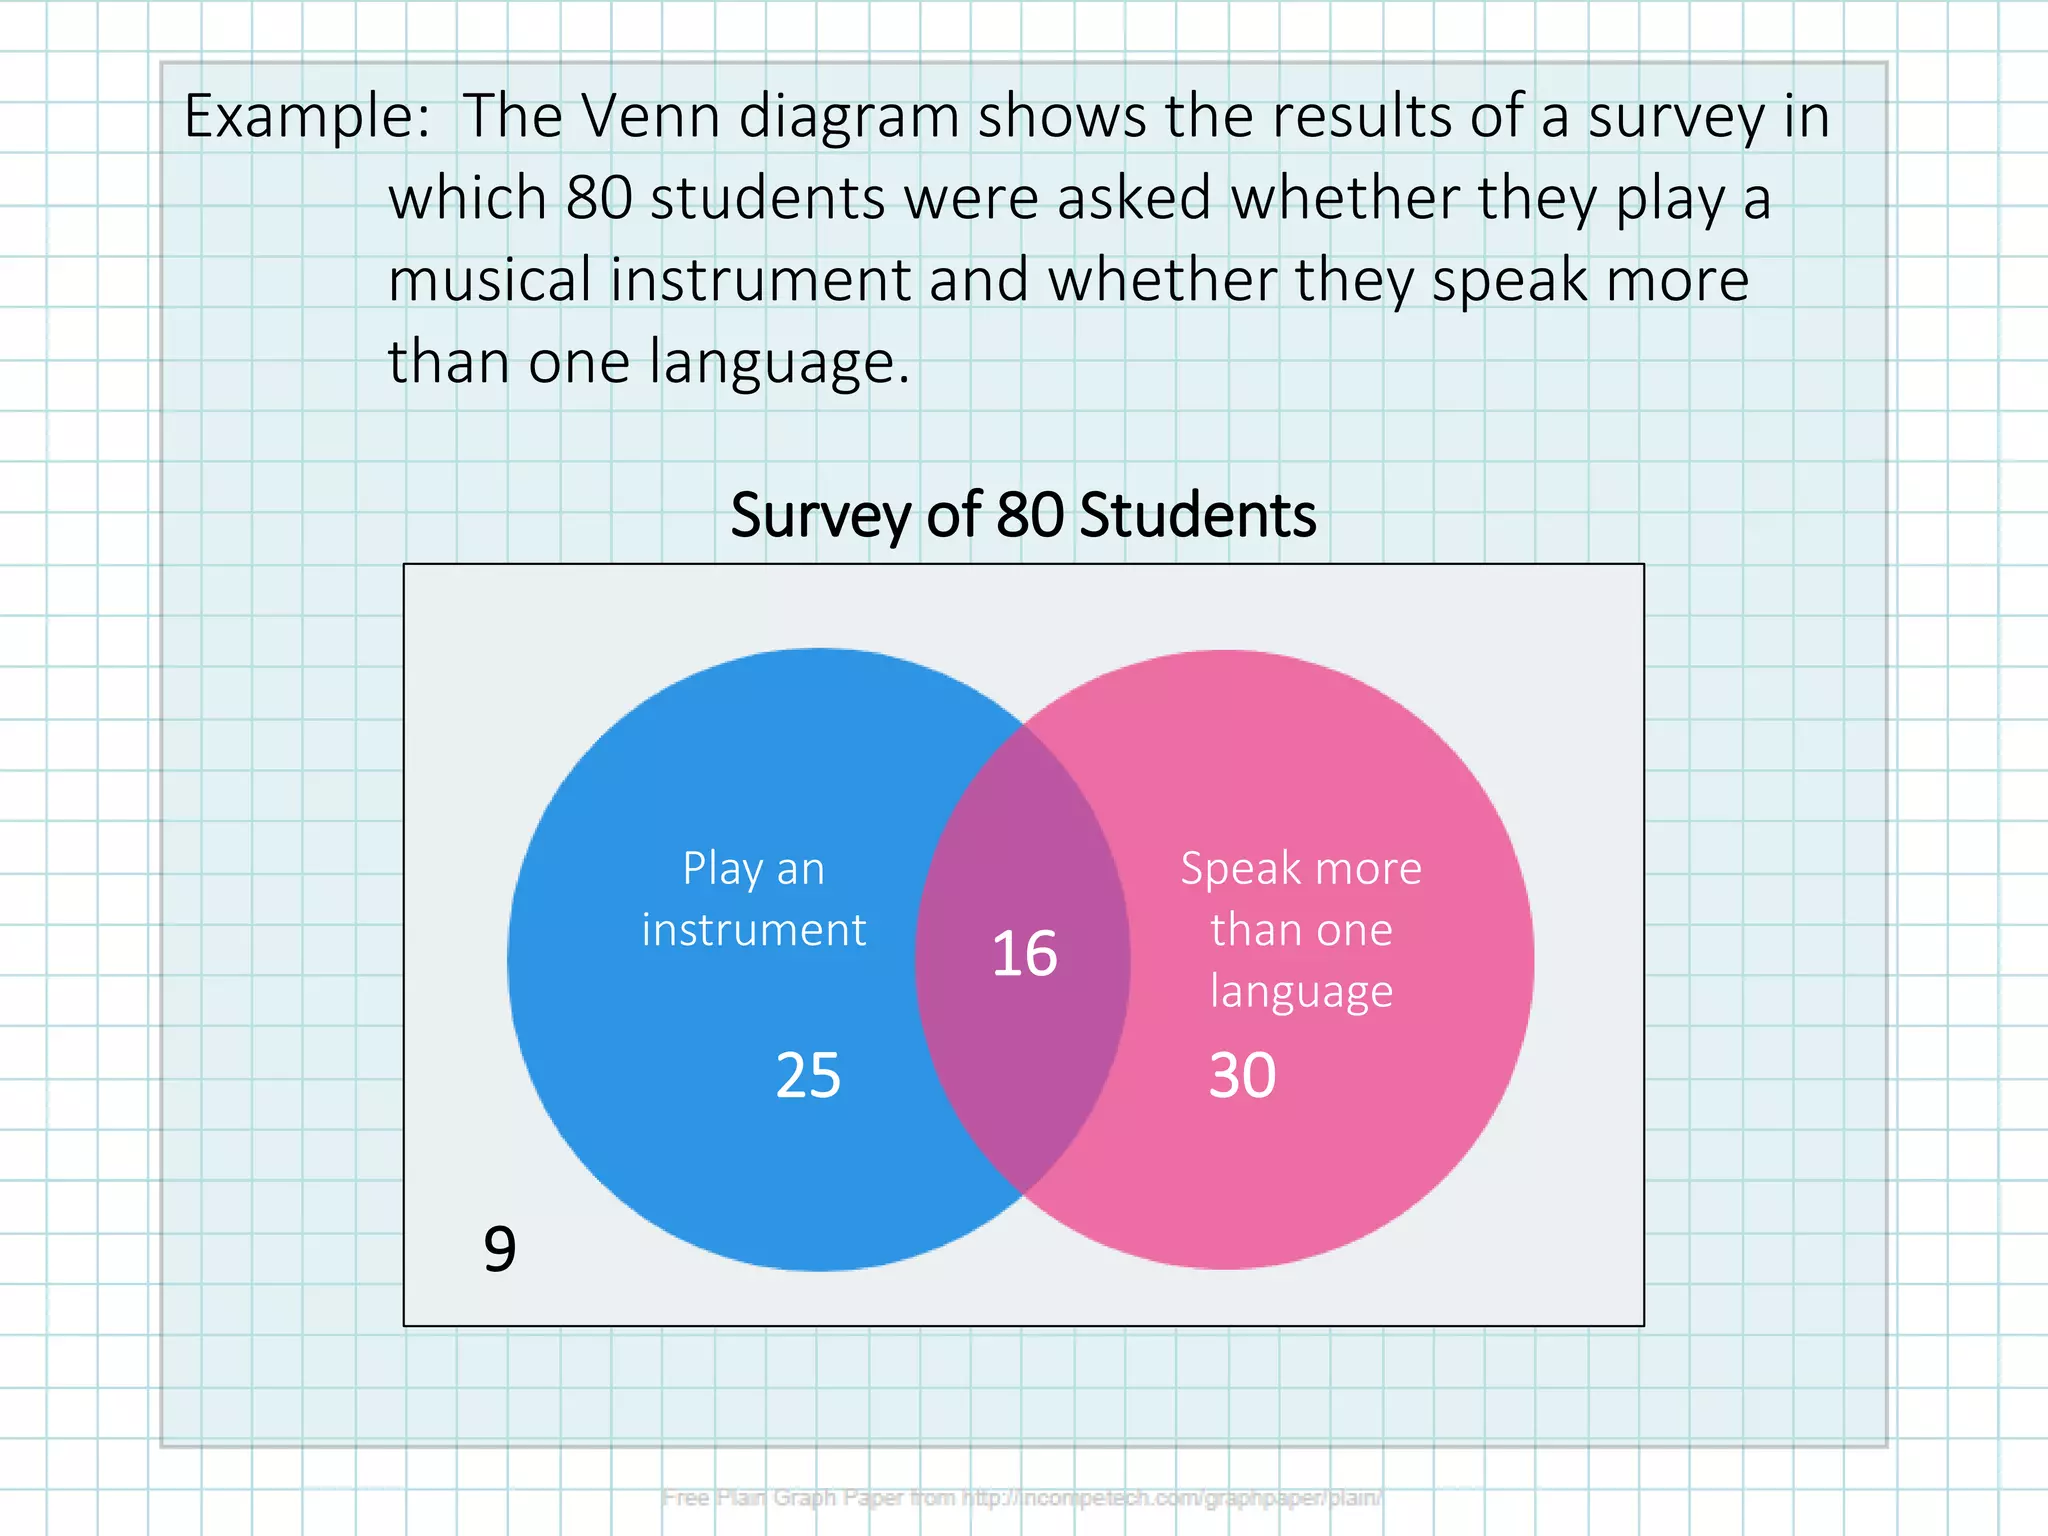
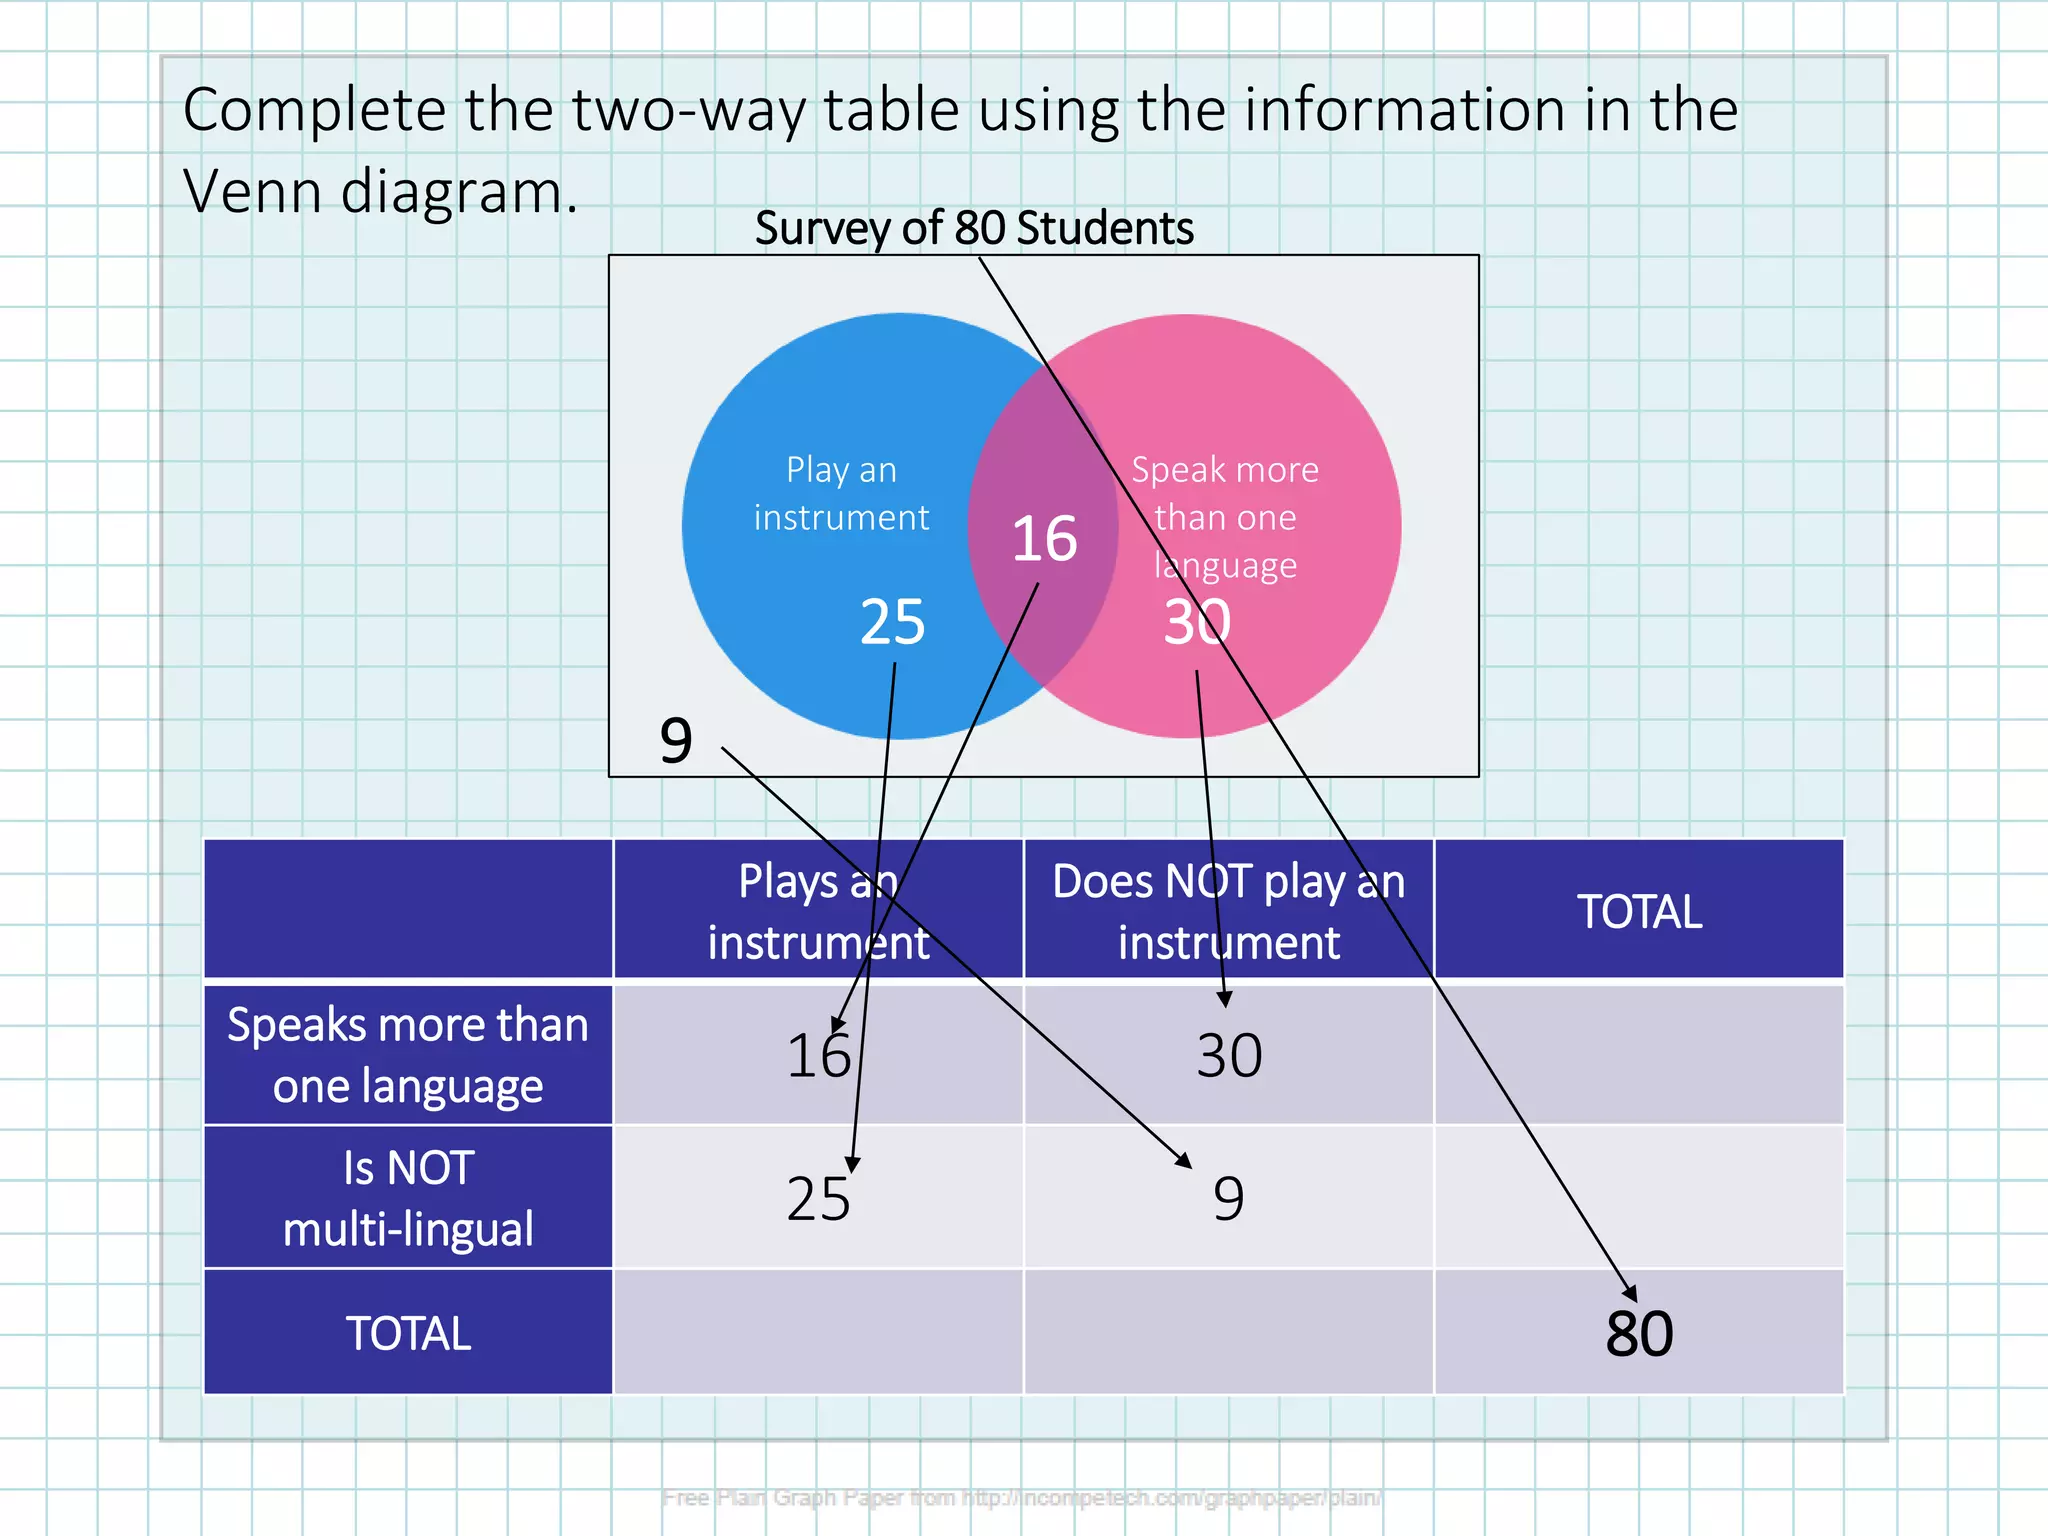
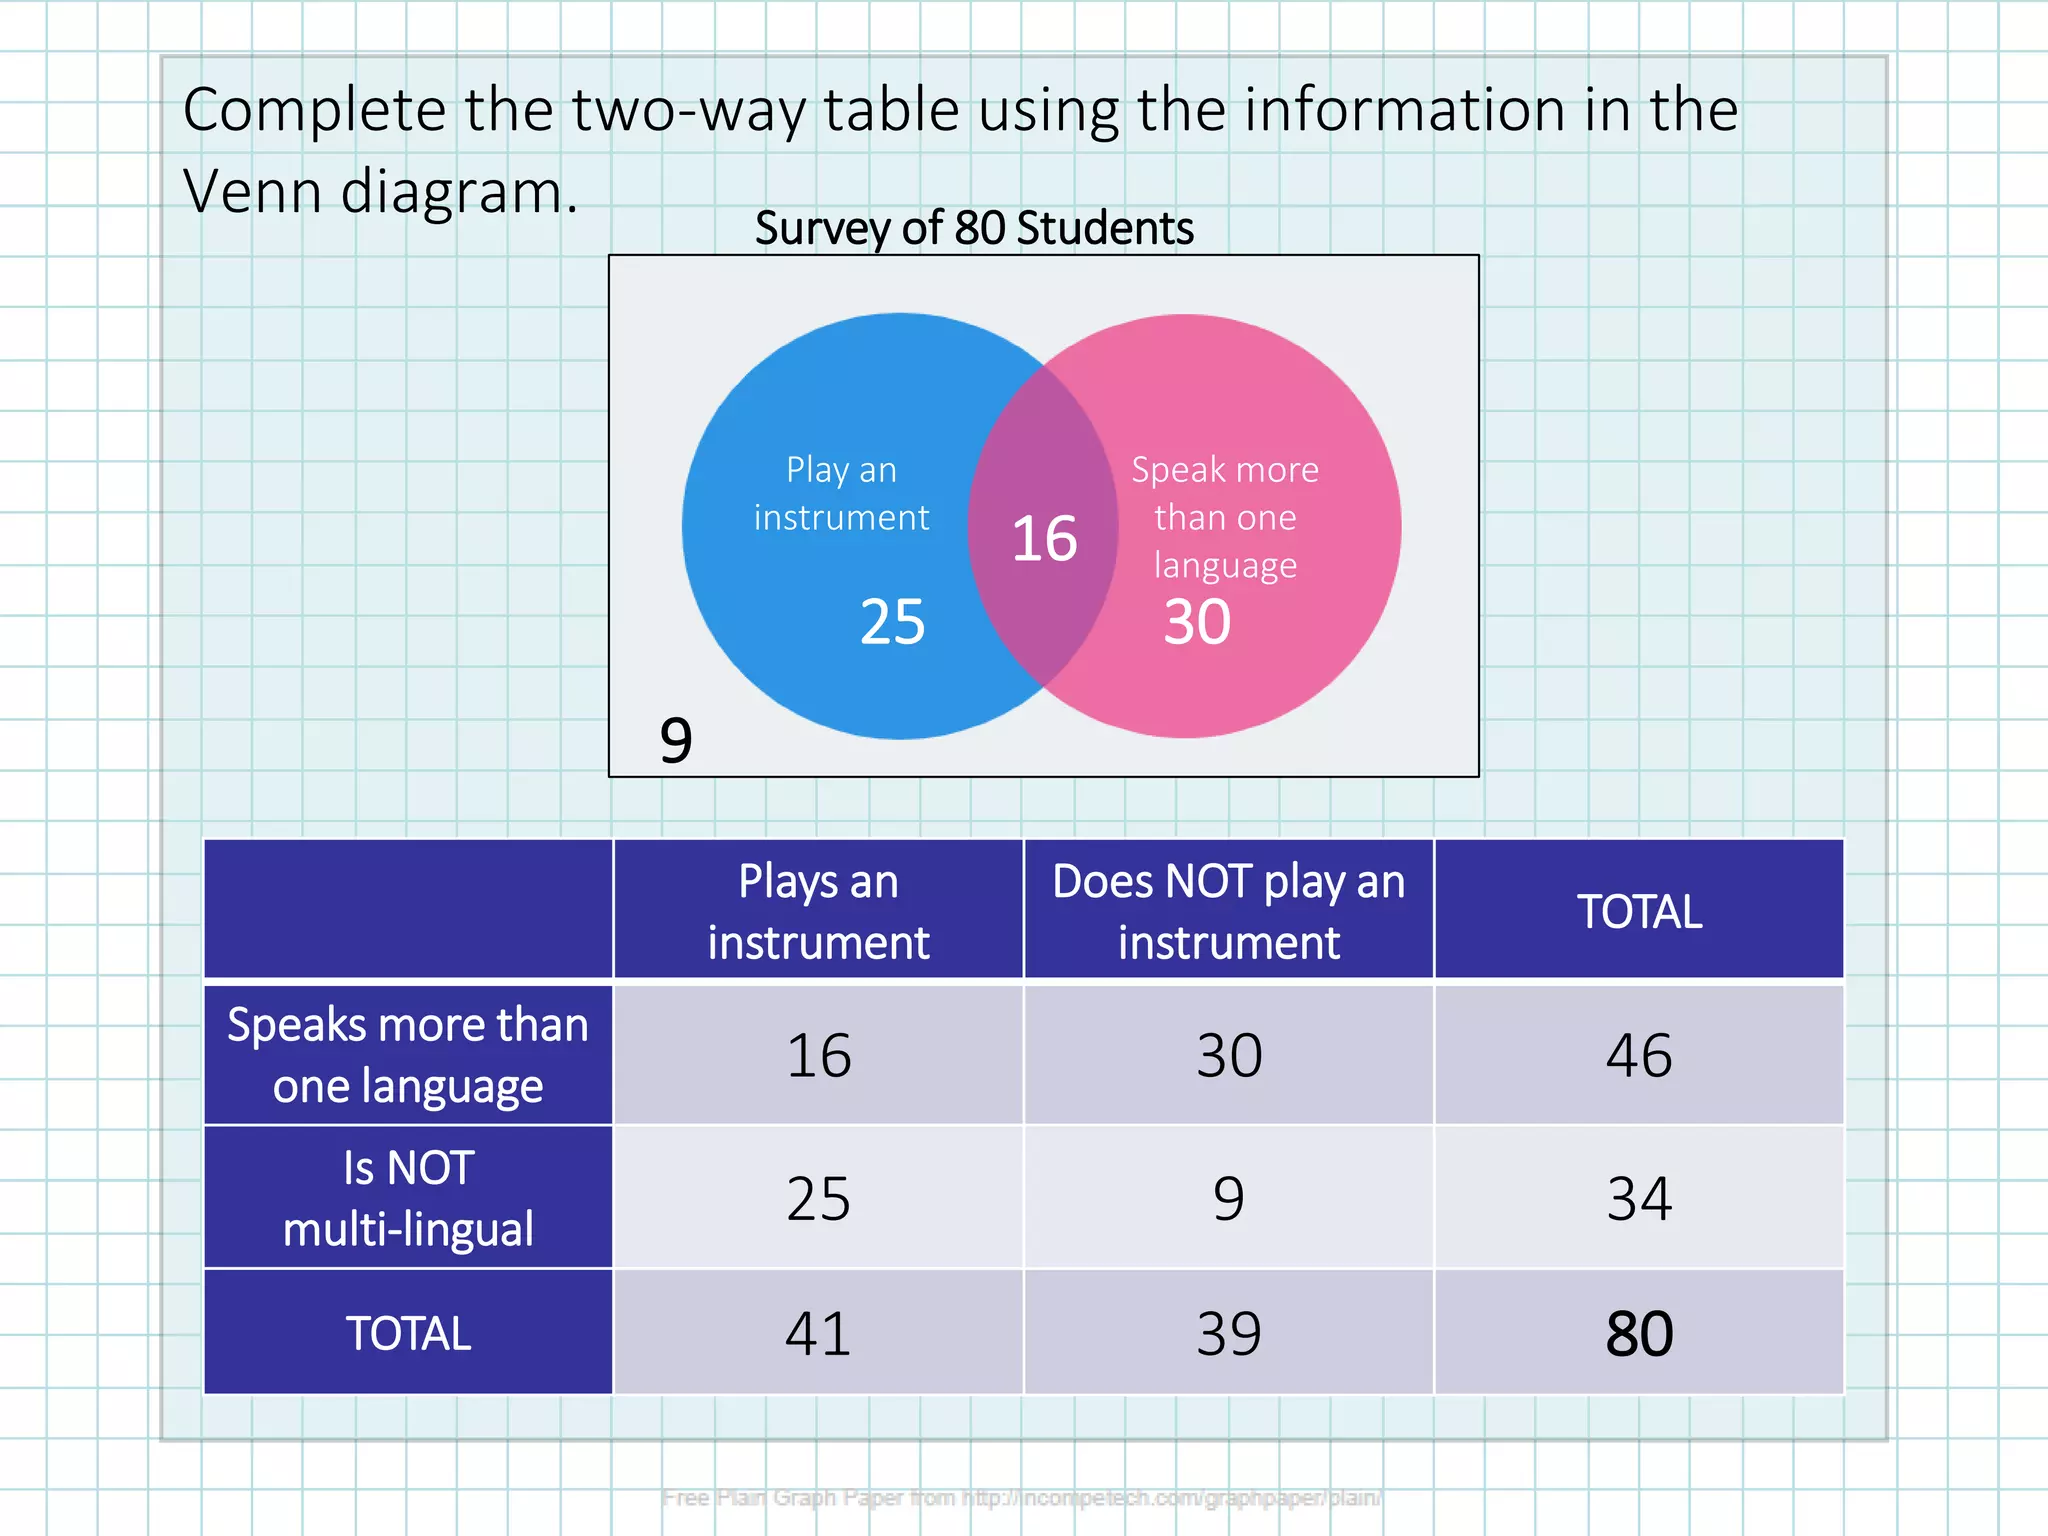
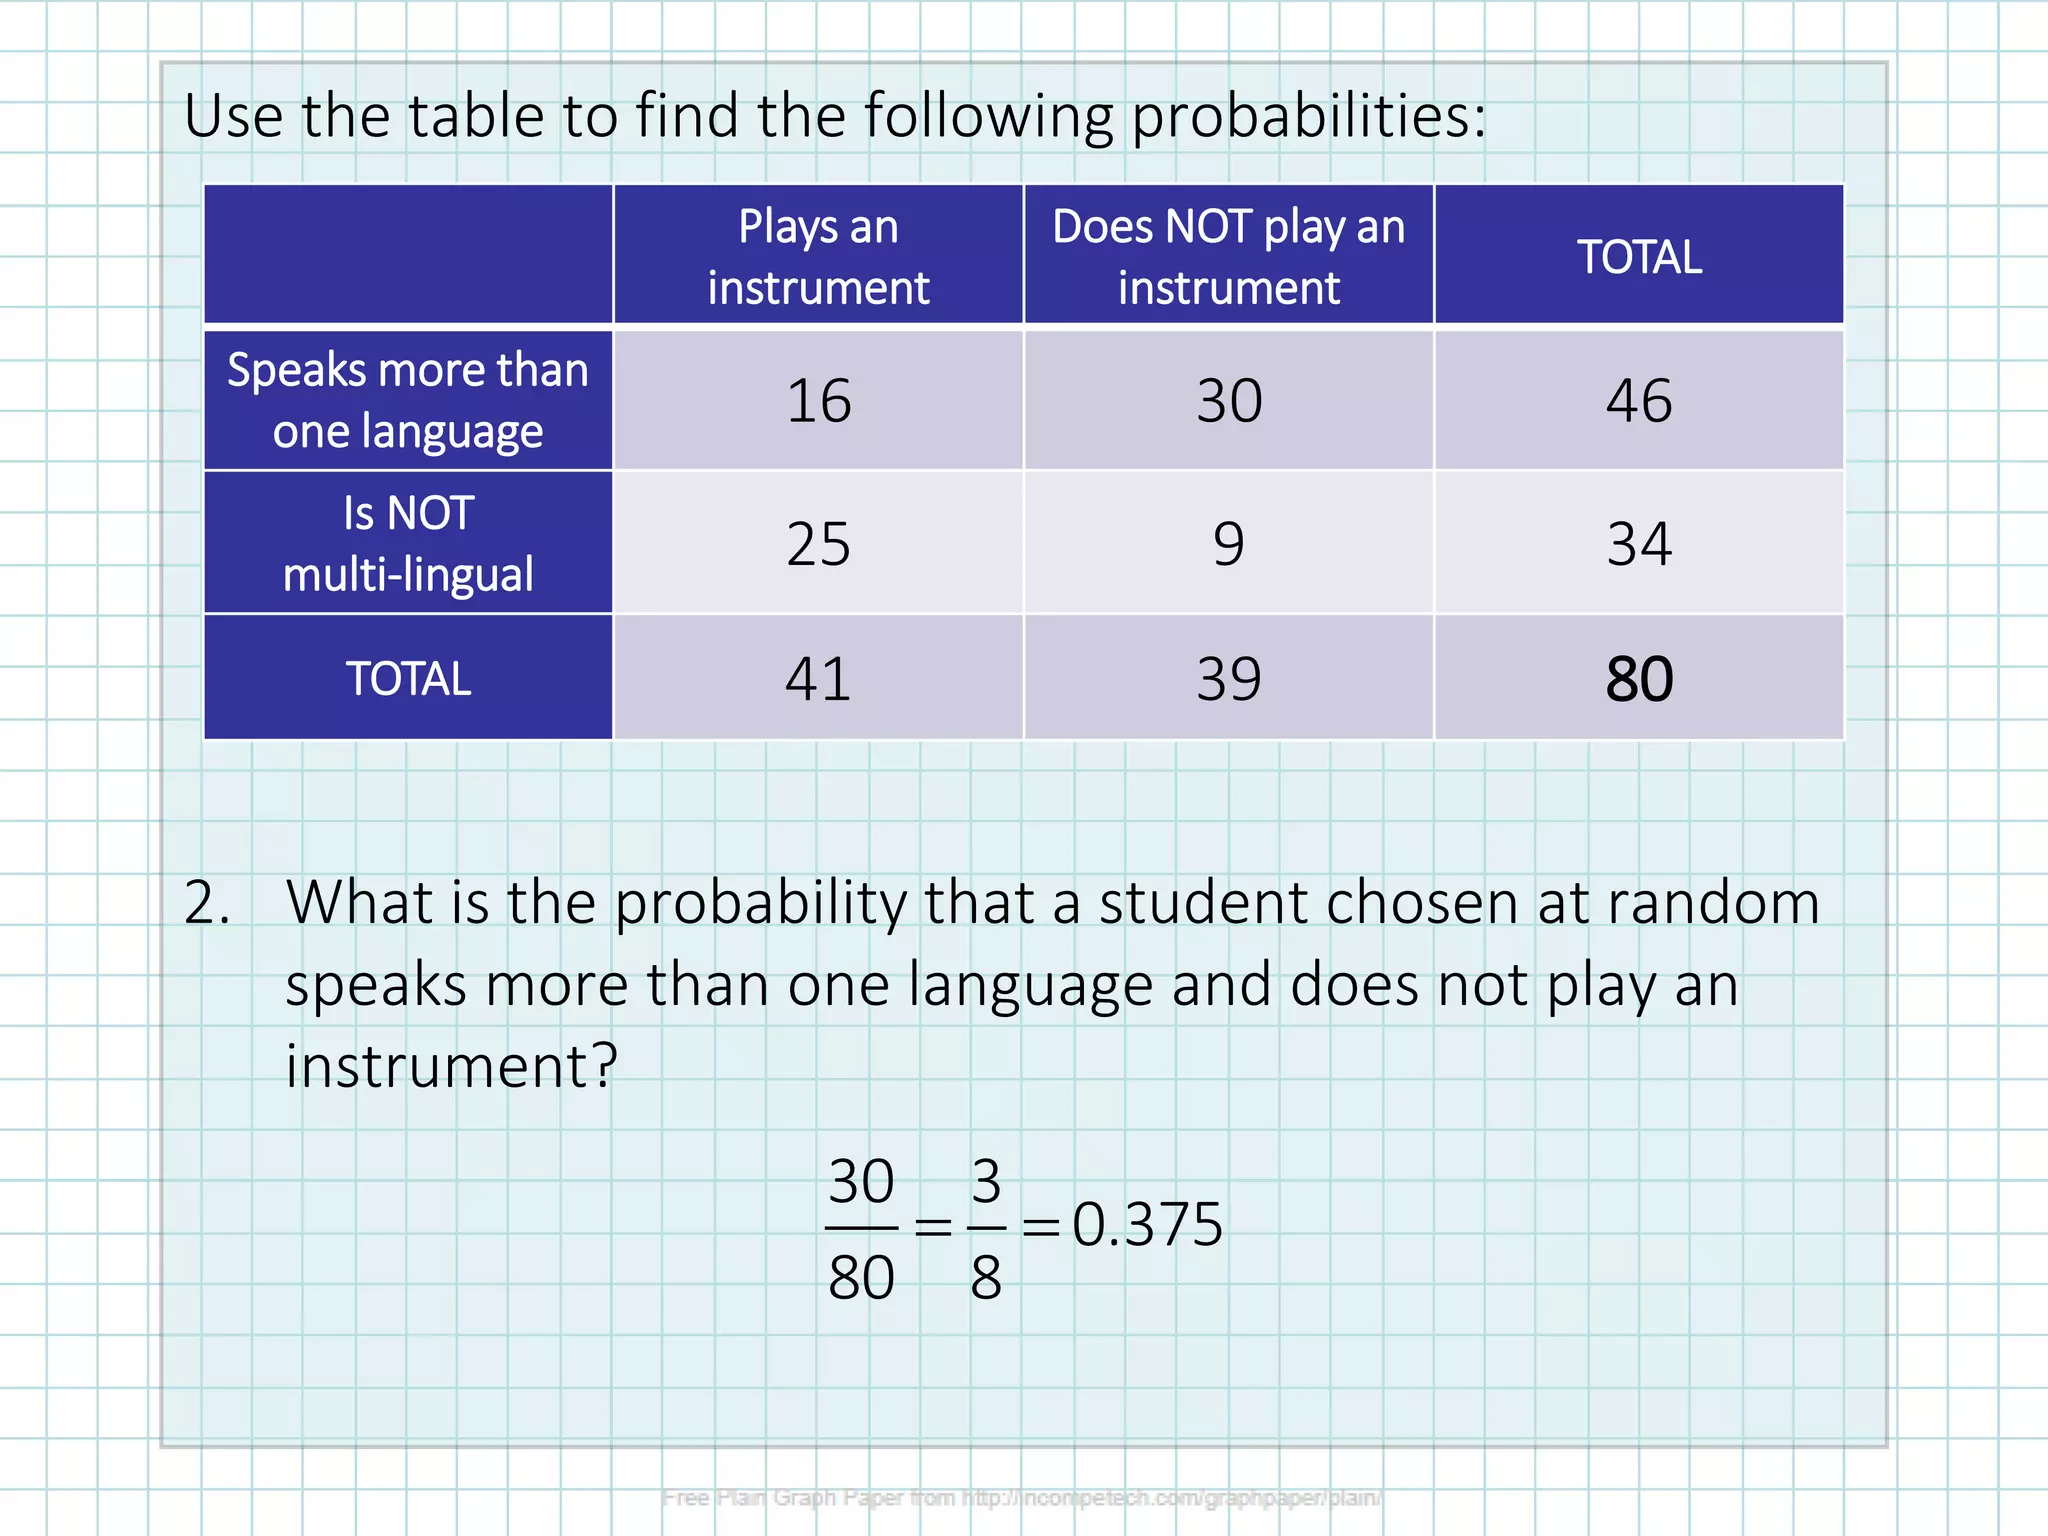
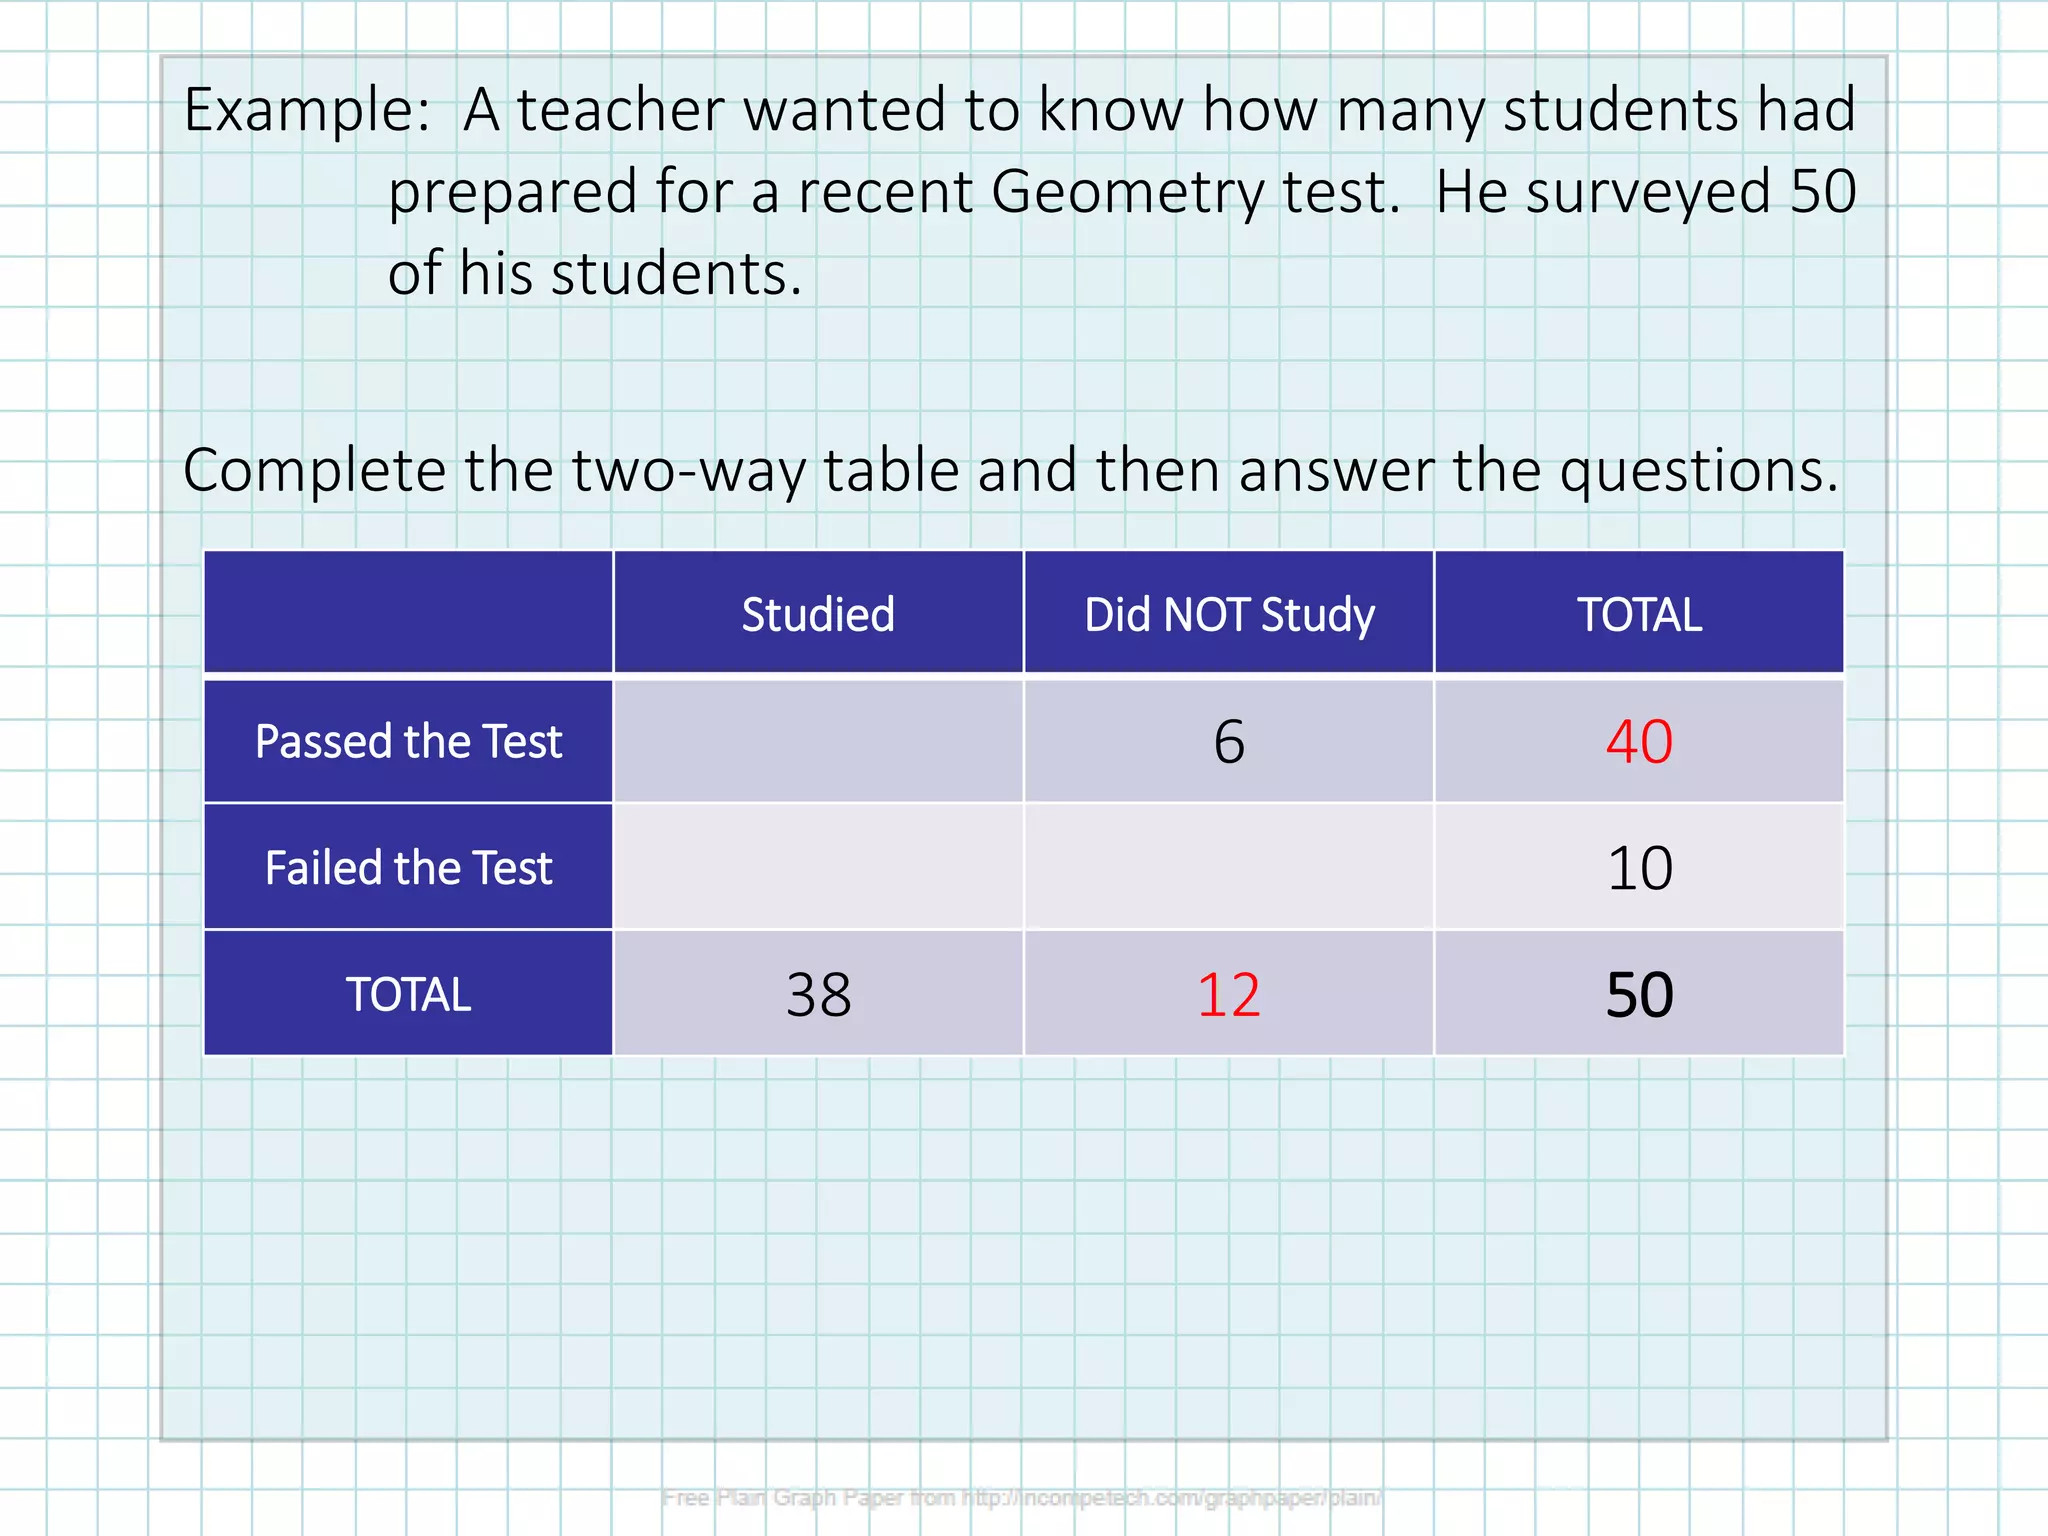
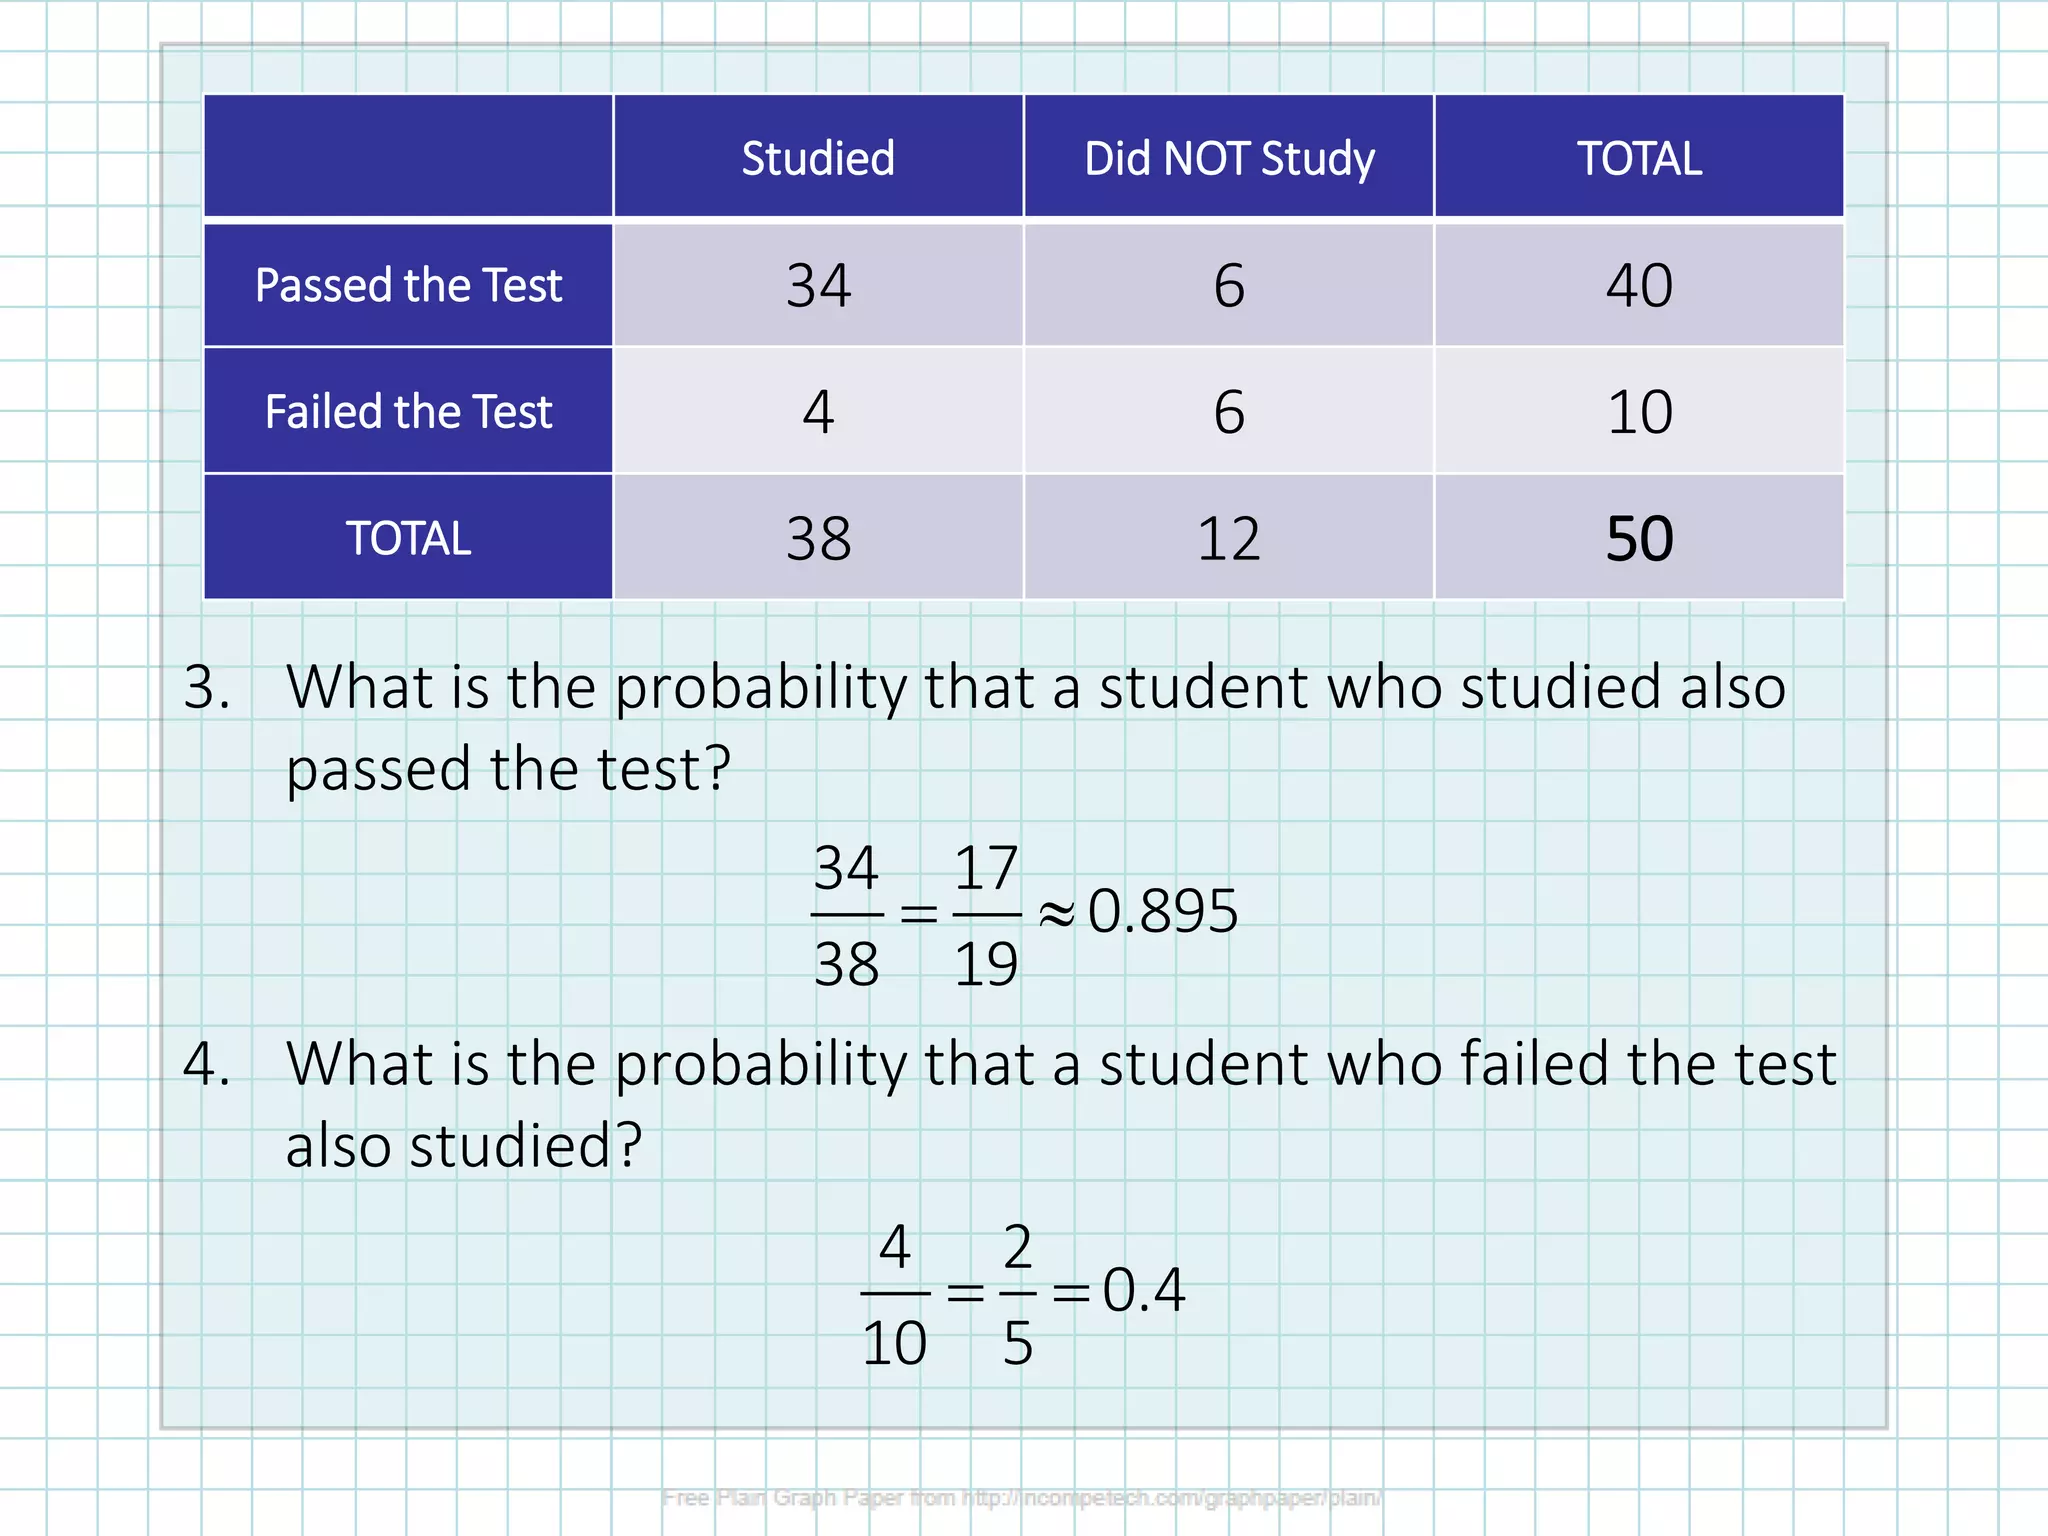
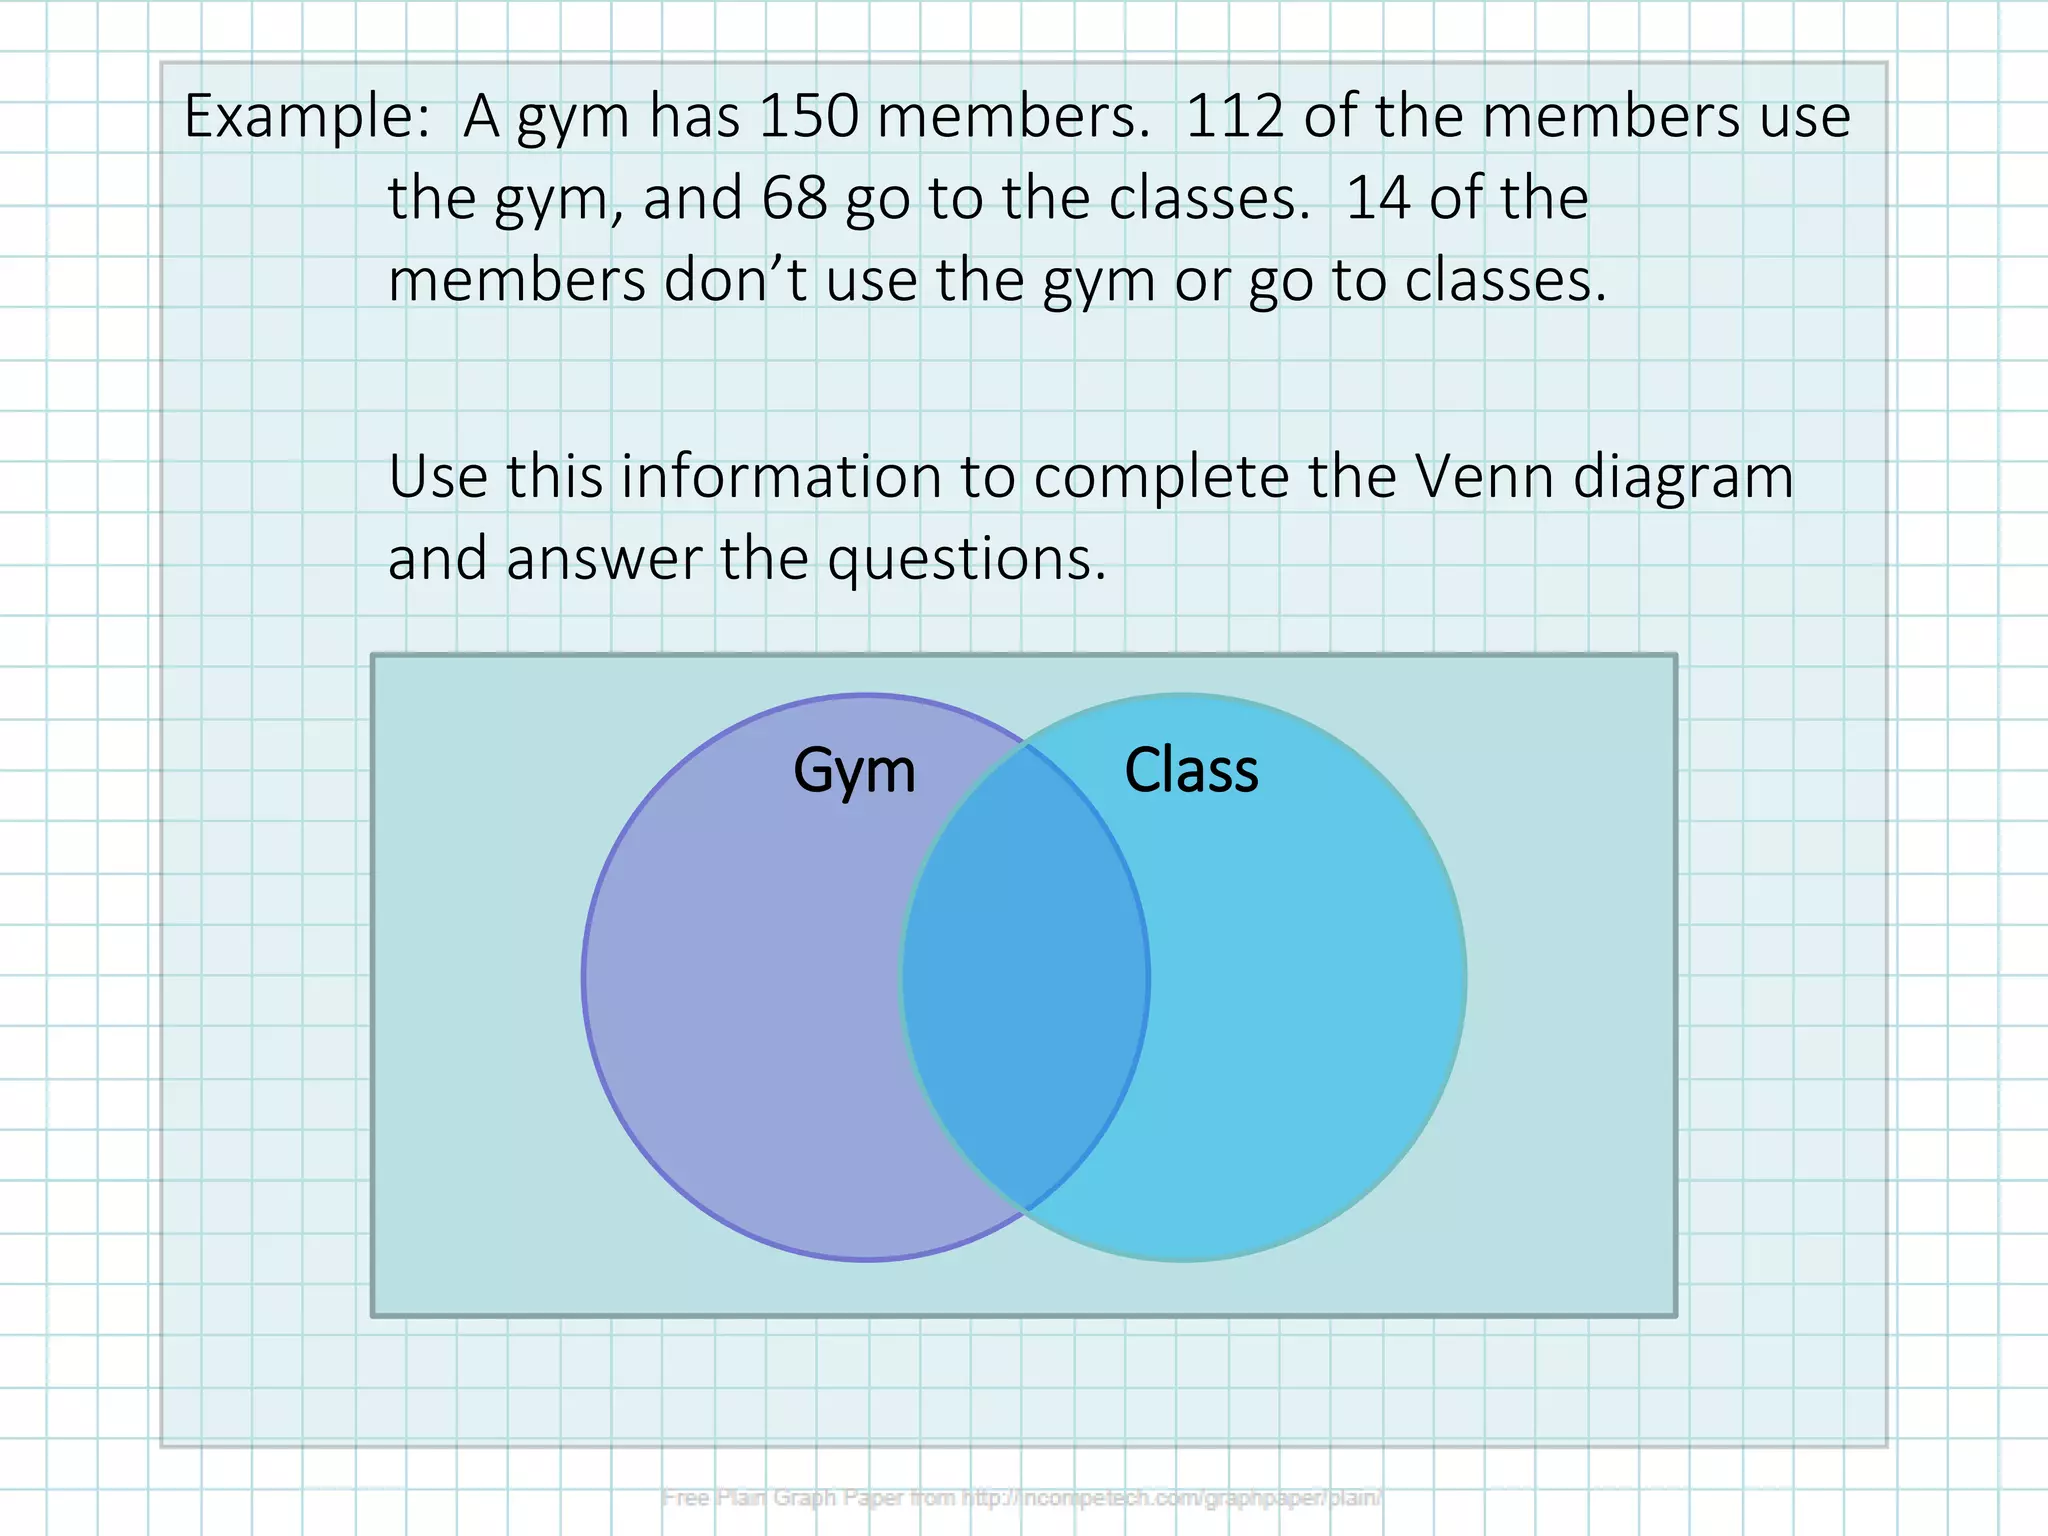
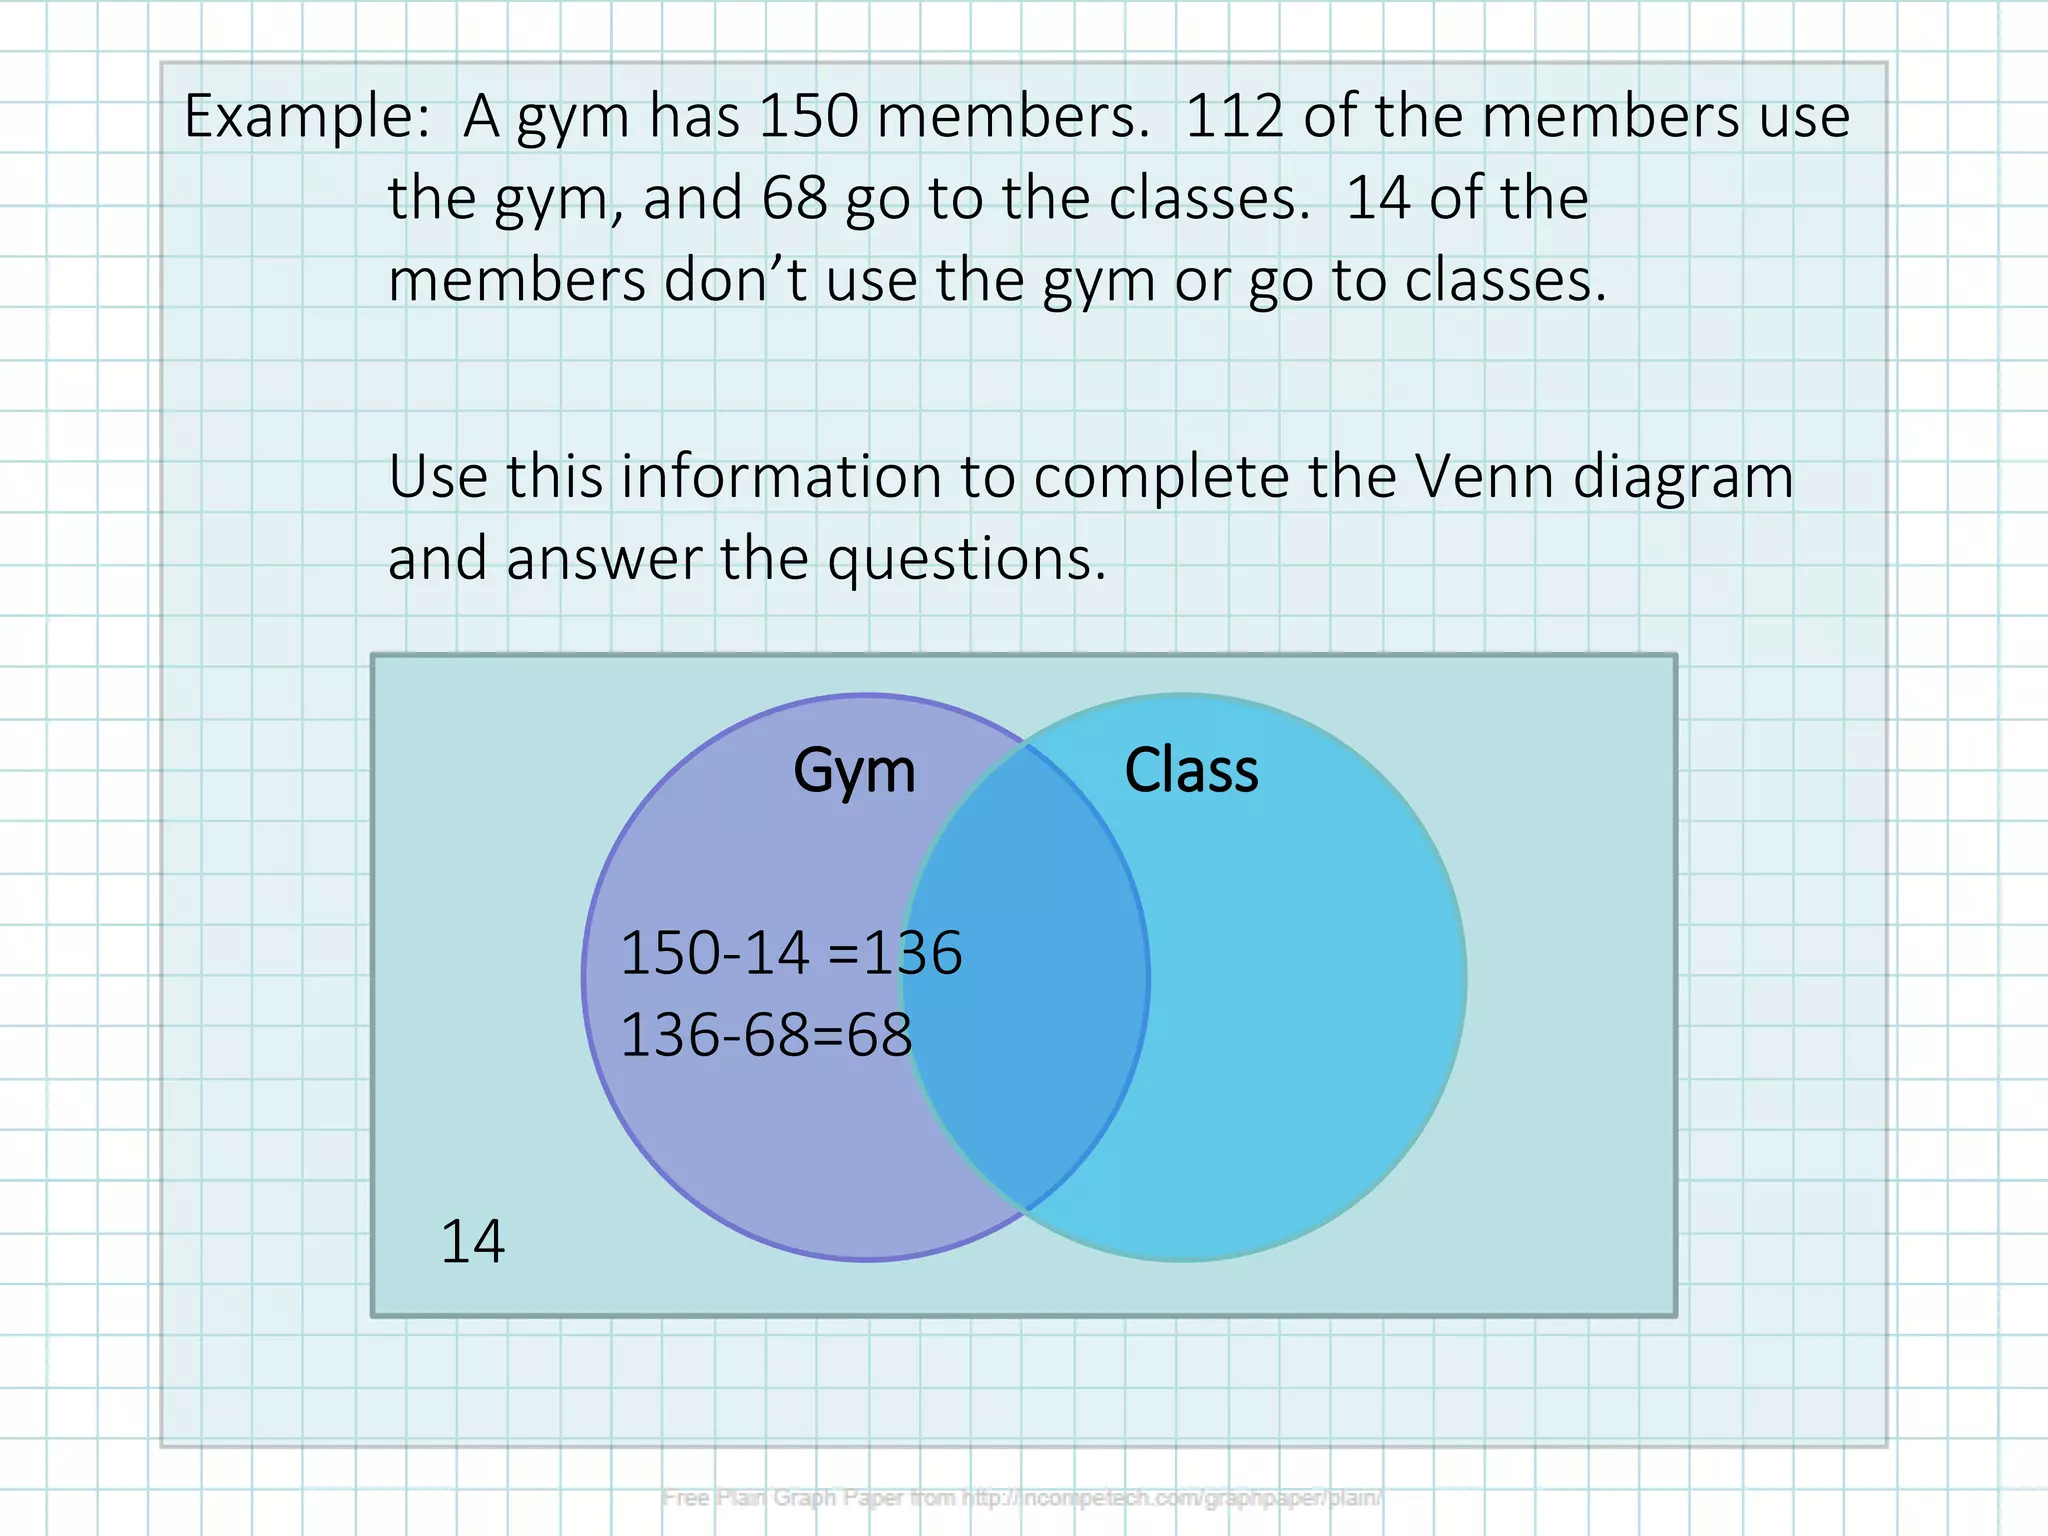
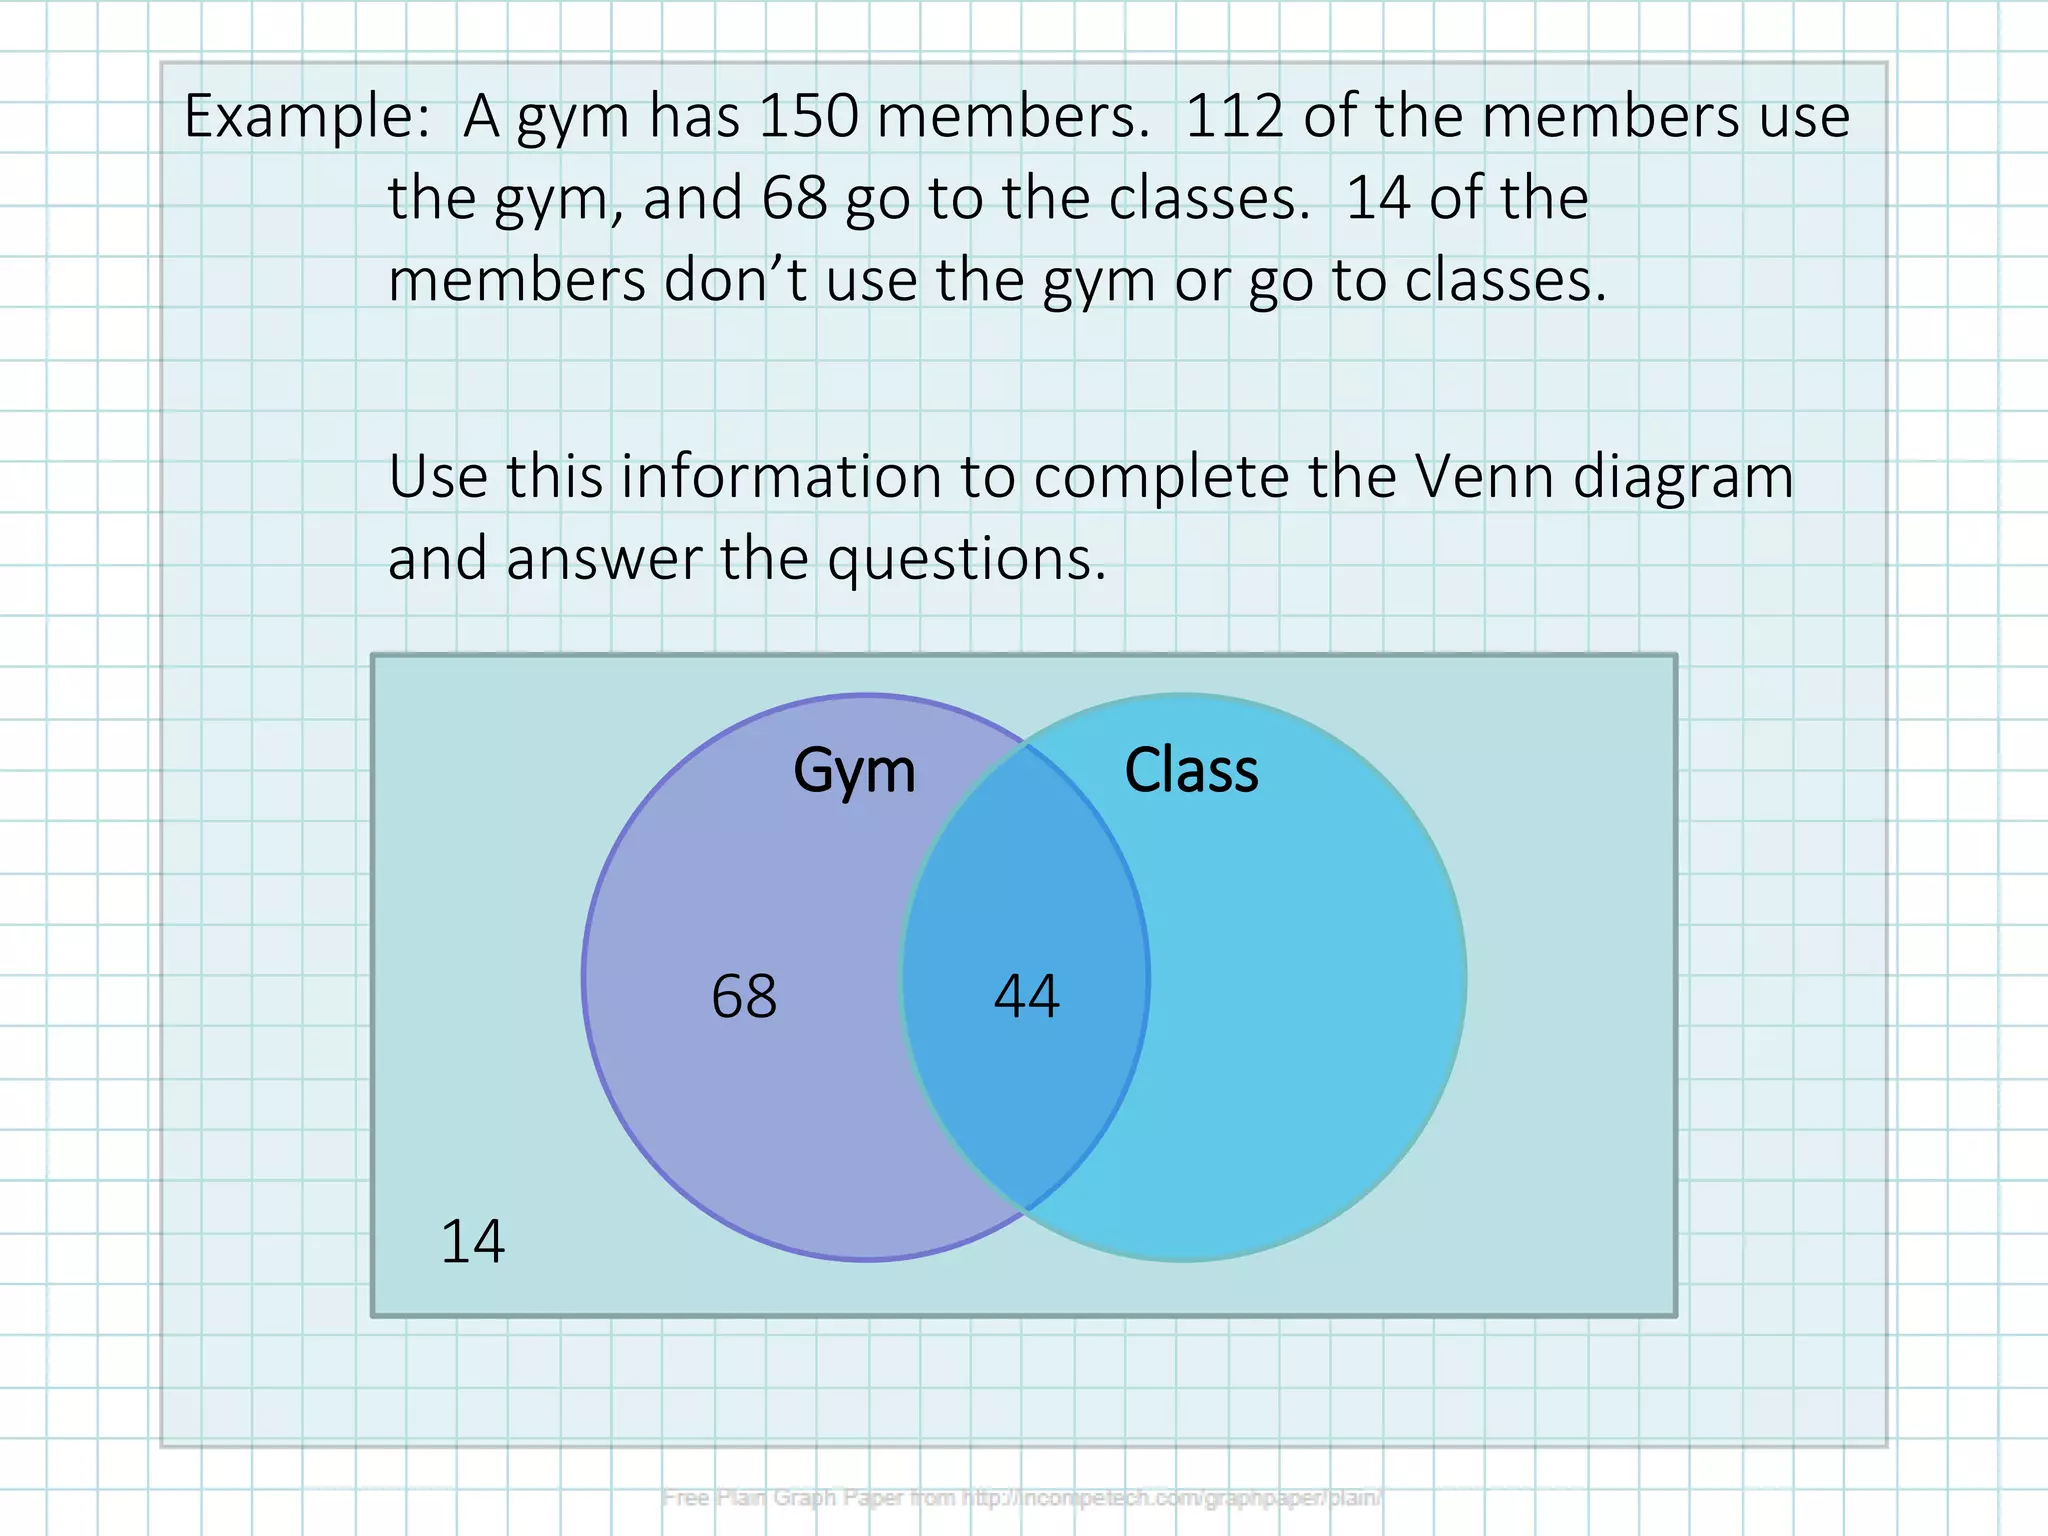
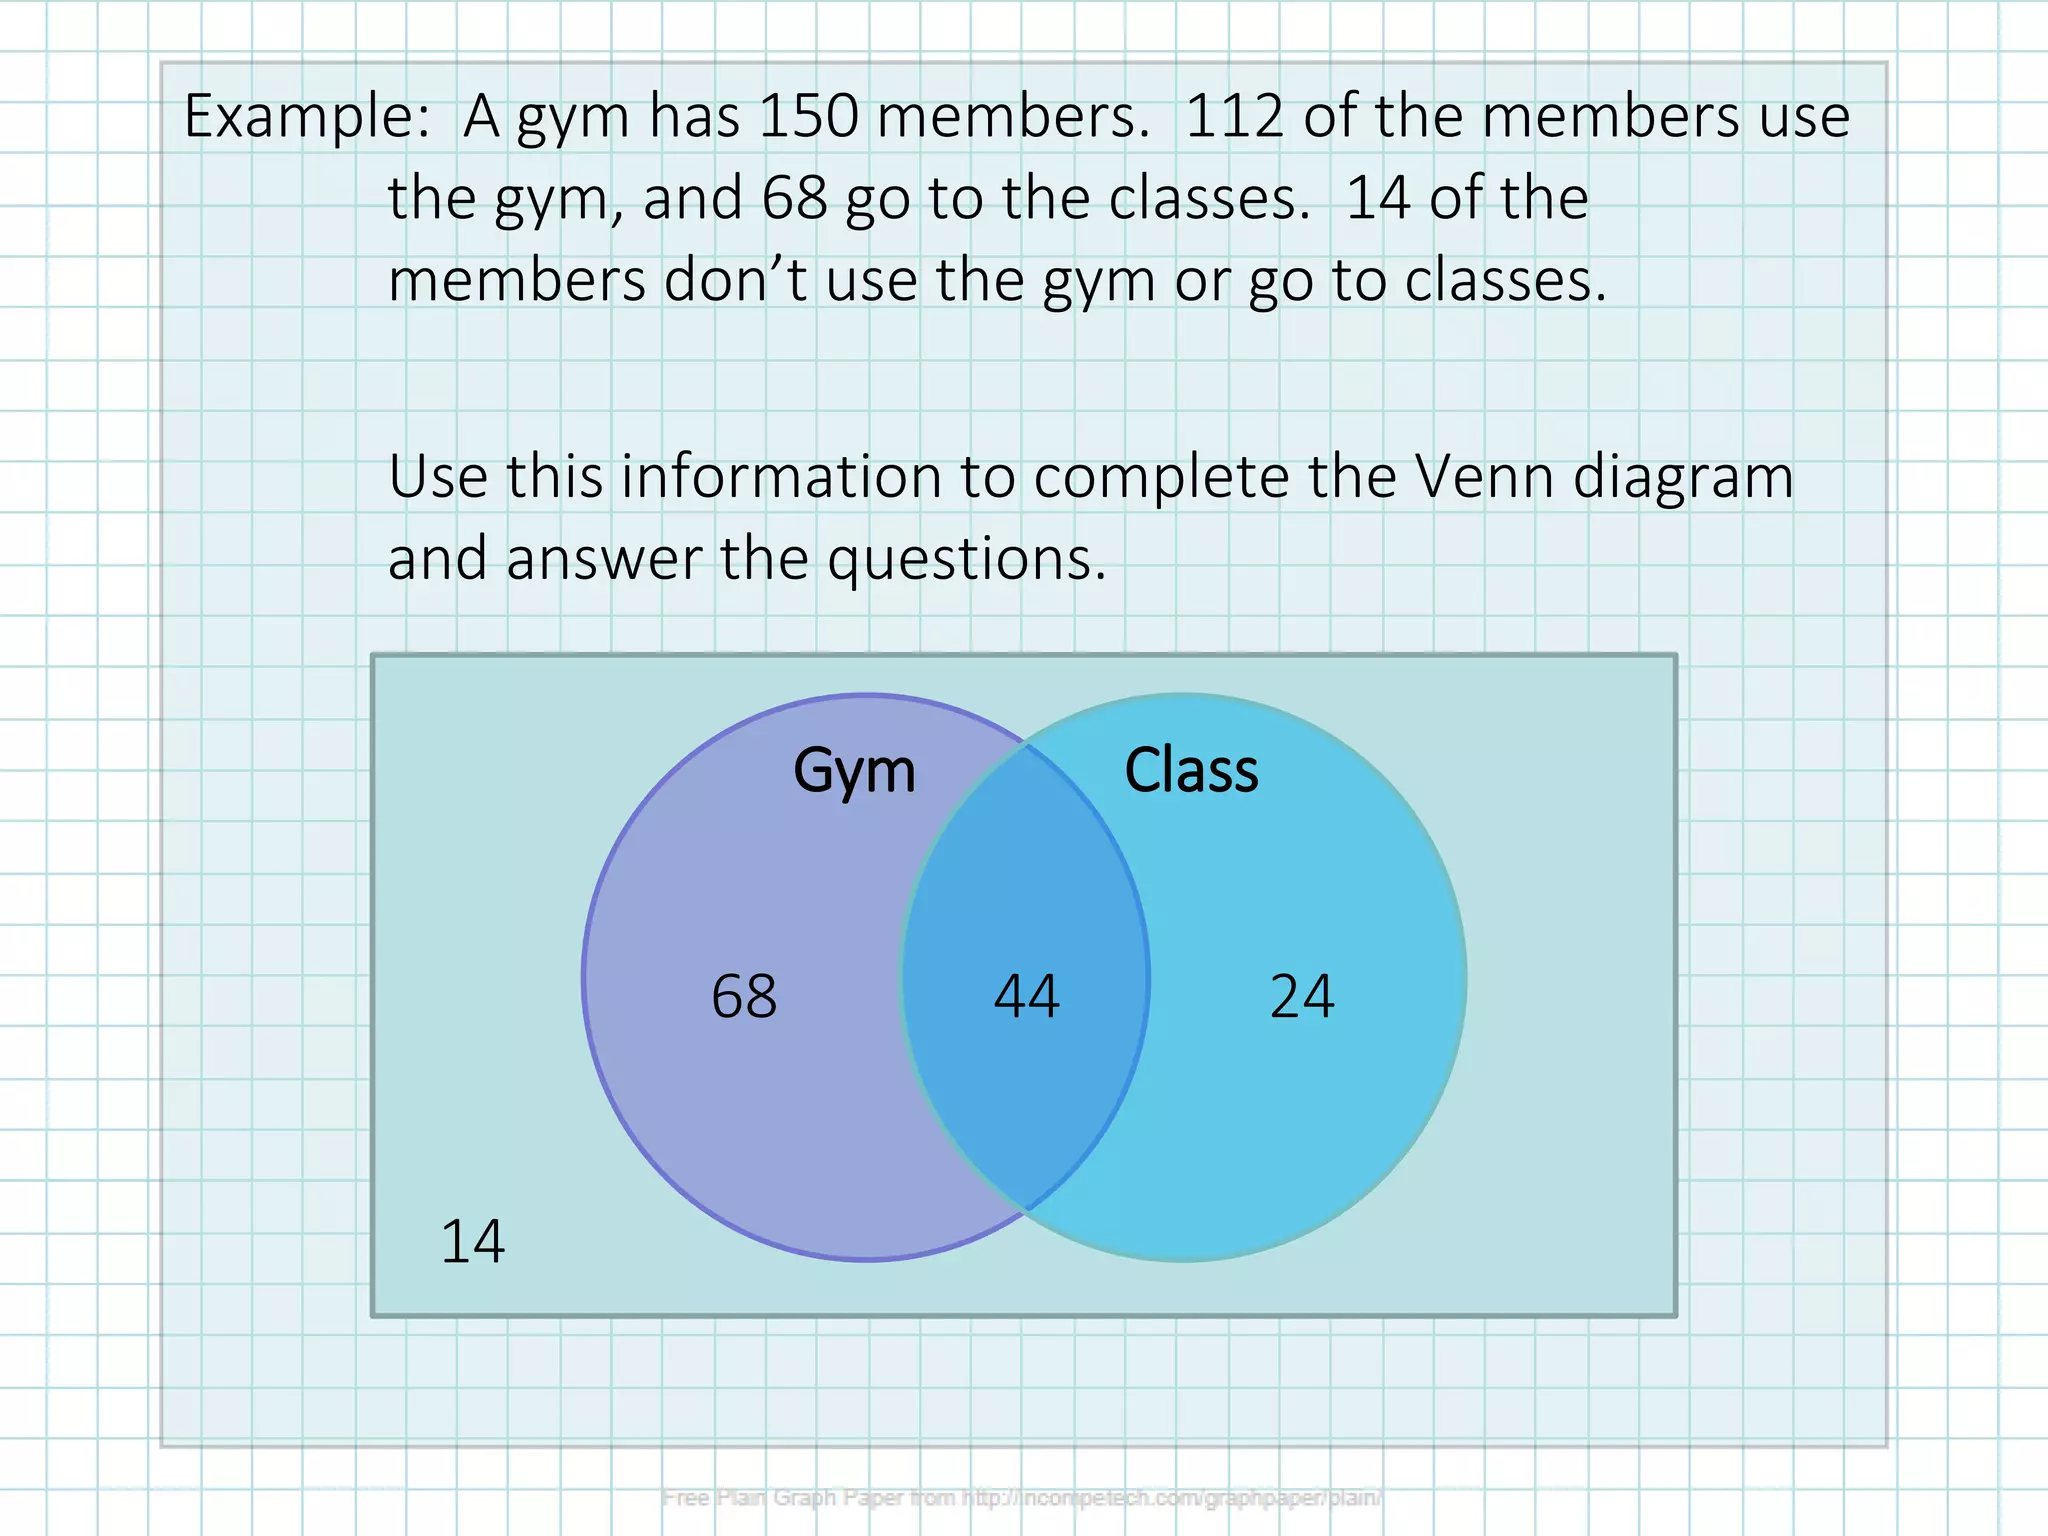
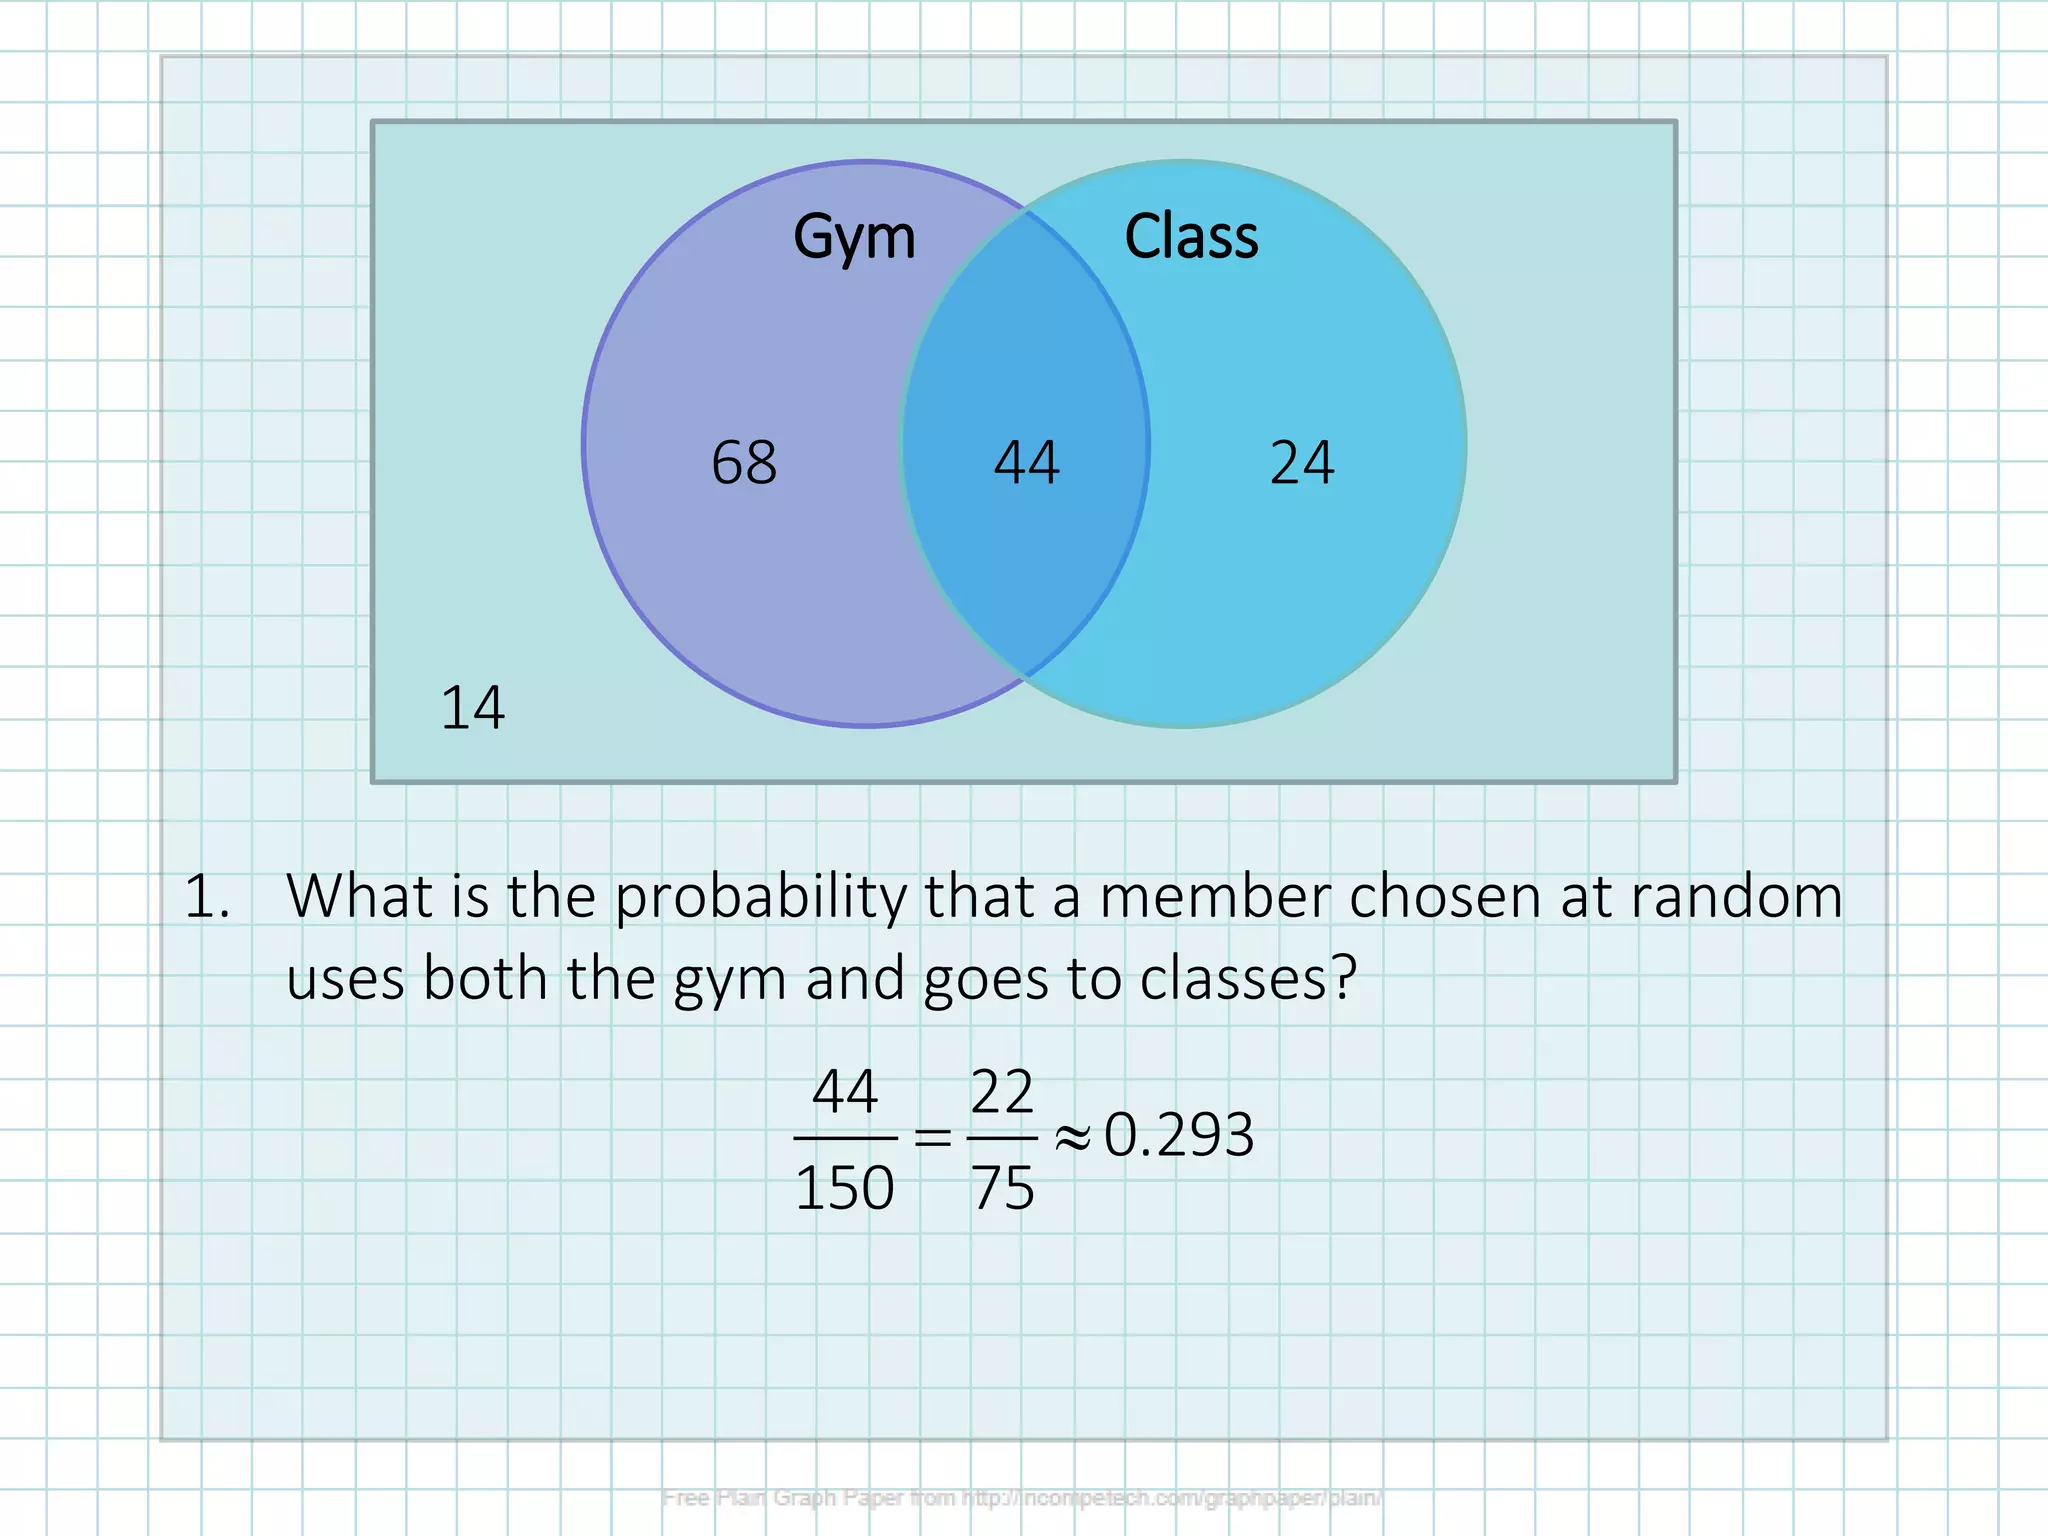
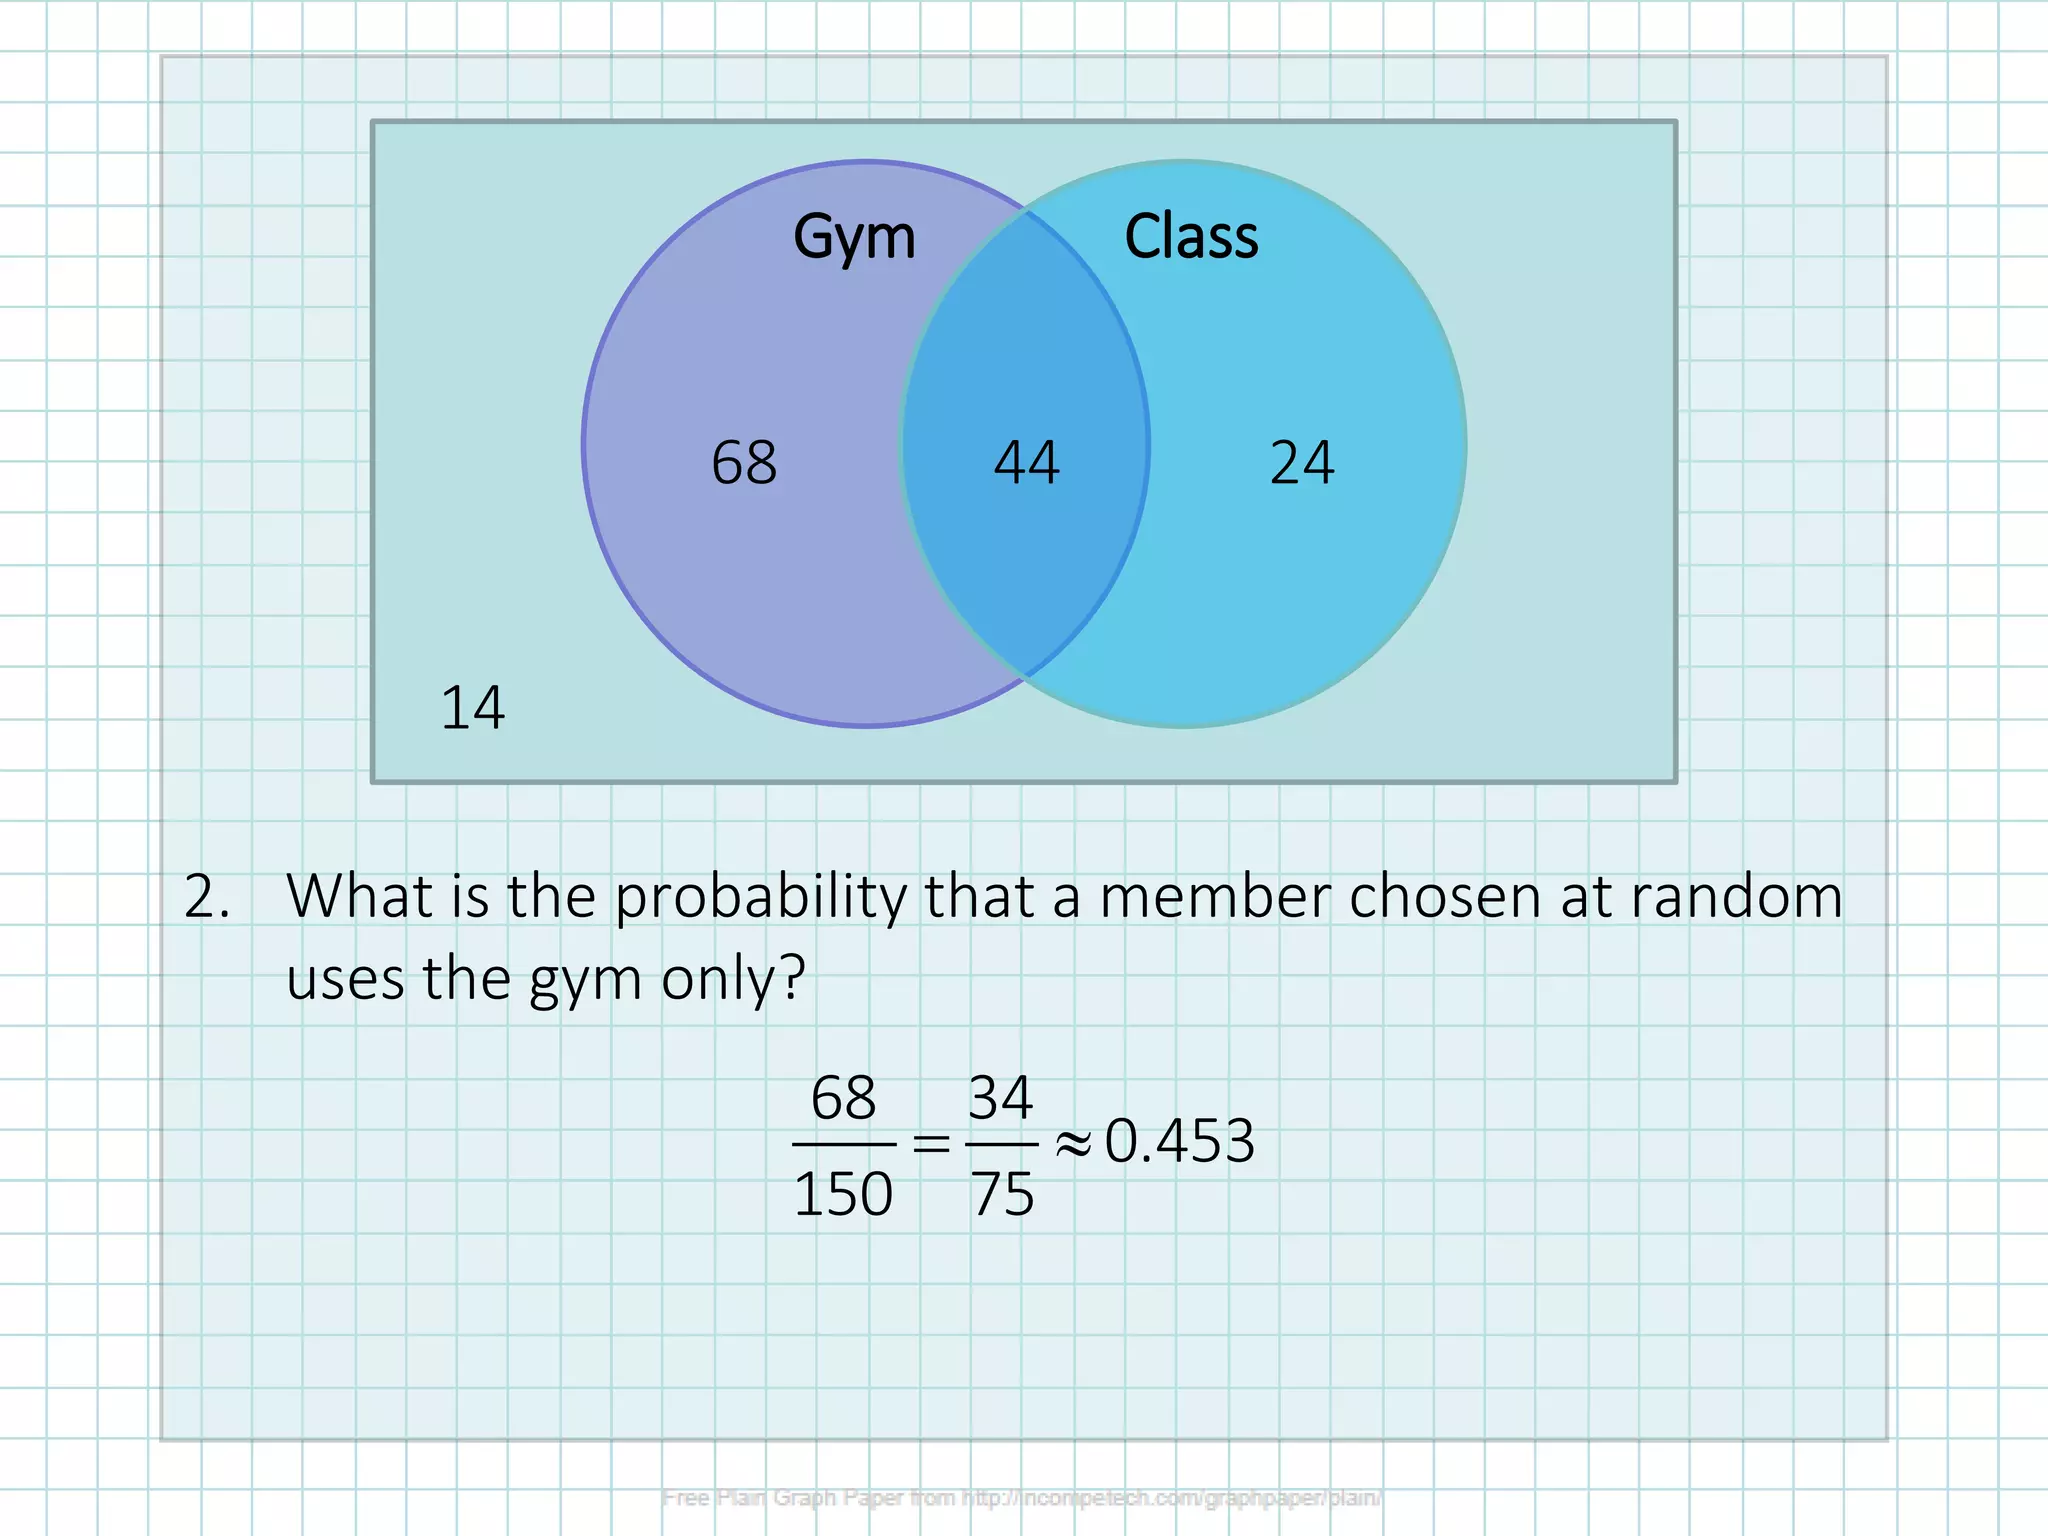
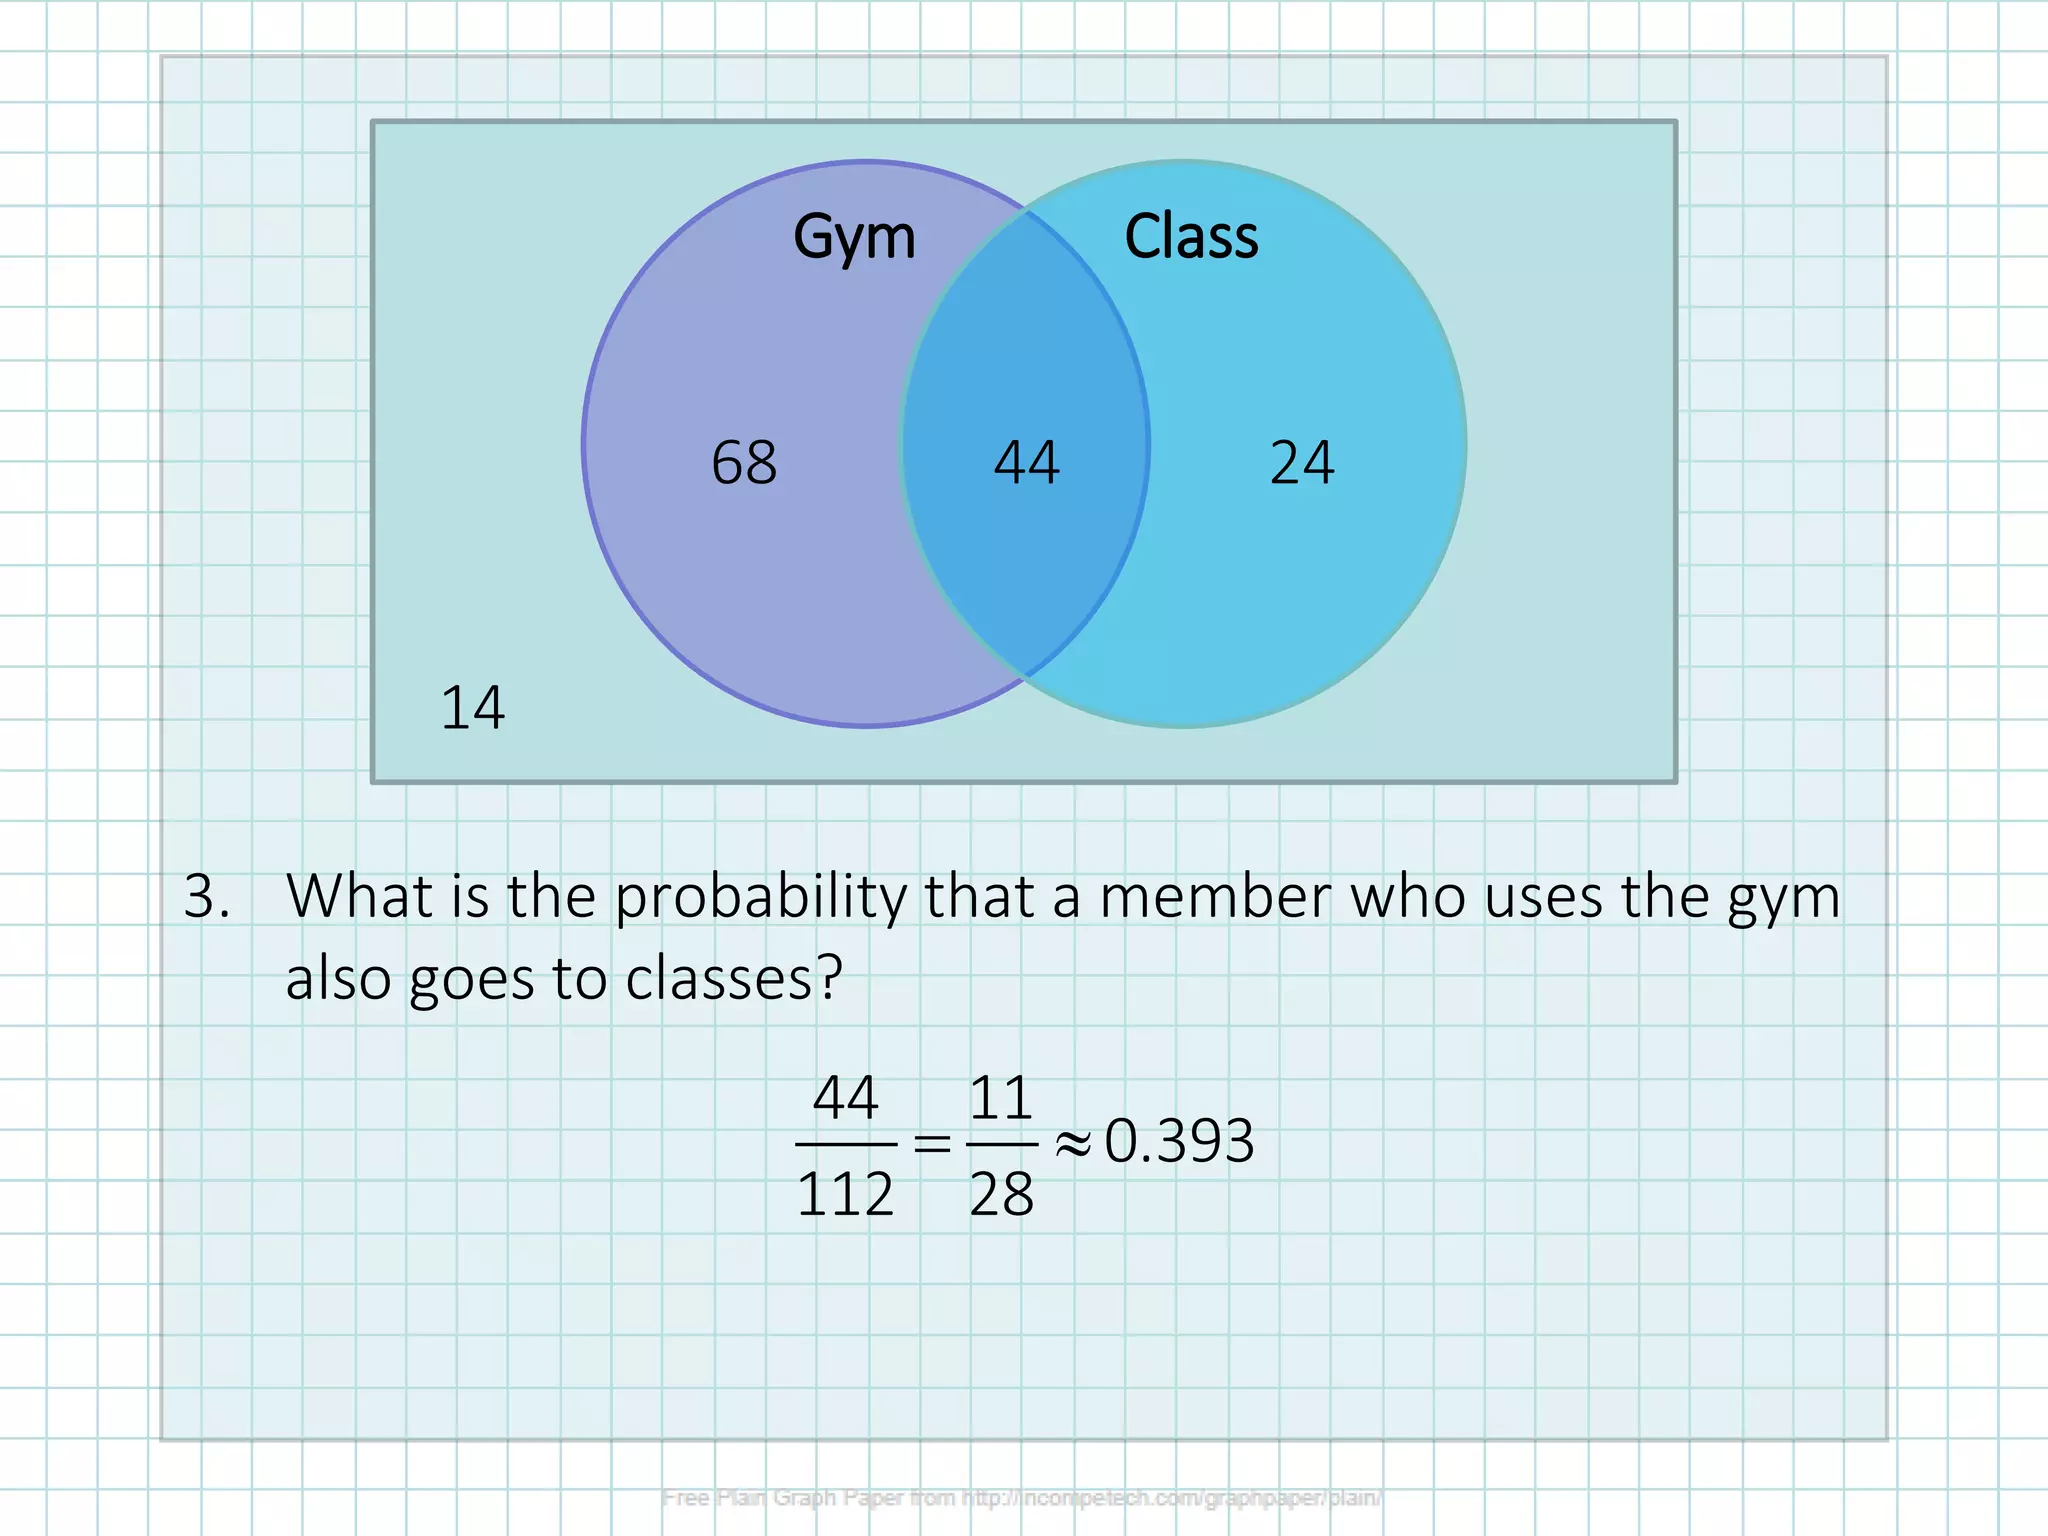
The document discusses using Venn diagrams and two-way tables to organize data and calculate probabilities. It provides examples of completing Venn diagrams and two-way tables based on survey data about students' activities. It then uses the tables and diagrams to calculate probabilities of different outcomes. The examples illustrate how to set up and use these visual representations of categorical data.


![Grade 8 Probability Cambridge [PPT]](https://cdn.slidesharecdn.com/ss_thumbnails/g8unit15probability-201206023054-thumbnail.jpg?width=640&height=640&fit=bounds)