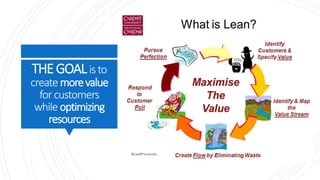
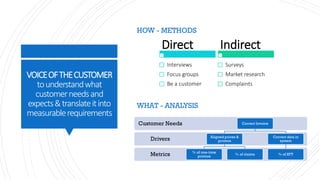
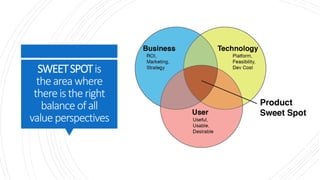
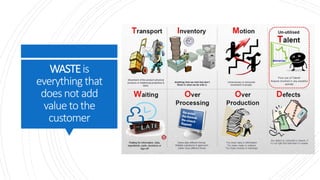
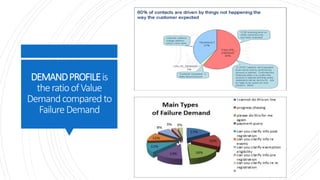
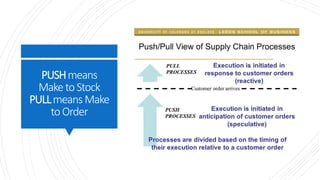
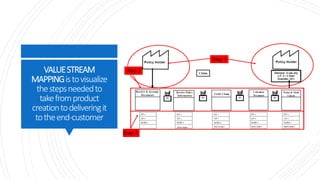
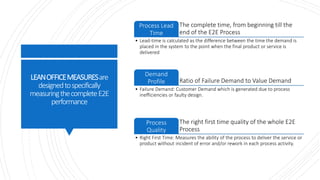
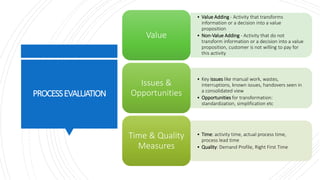
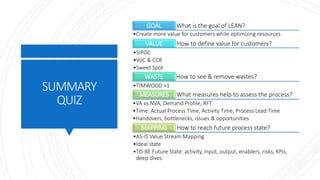
Lean Made Simple
Learn
Play
Practice
LEARN
LEAN goal
Value
SIPOC
THEGOAListo
createmorevalue
forcustomers
while optimizing
resources
5% - Primary focus
for ‘traditional’
efficiency
improvements
• VA – value
adding
35% - Subject to
challenging and
optimization
• NVA non-
value
adding but
necessary
60% - Primary
focus of LEAN
improvements
• NVA non-
value
adding,
waste
Optimize
Eliminate
Combine
Reduce
Simplify
VALUEis
what customers
arewilling topay
for
SIPOC isavisual
toolfor
documenting a
business process
E2Eathighlevel
PRACTICE
SIPOC
Supplier Process Output CustomerInput
HR Survey and Data (KPIs)
Definition of process
improvements
Improvement Plan
implemented
Business, HR, Candidate,
Talent Acquisition
Recruitment team Satisfaction survey sent Evaluation of hiring process
Survey completion, Feedback
gained
Recruitment team
Candidate, Line Manager,
Recruitment team
Start date confirmation
Induction and onboarding of
candidate
Employee confirmed after
probation period
Line Manager,
Employee
Recruitment team
Requisition approval
Pool of candidates
Talent Management
Candidate attraction and
selection process
Prefered candidate identified
Candidate,
Line Manager
Line Manager
HRBP
Requisition approval signoff Requisition approval
Approved requisition for open
vacancy
Recruitment team
Recruitment team
Talent Management
Resourcing plans,
Candidate profiles, Succession
plans
Build pipeline of candidates Defined pool of candidates
Line Managers, Candidates,
HRBPs
Line Managers
HRBPs
Future Organisational needs Define resources needed Resourcing plans Recruitment team
Line Manager
HRBP
Offer details (Salary) Offer management
Offer acceptance, contract
signed
employee profile created
Candidate,
Employee Services
MakeYour
Own!
LEARN
VoC
Sweet Spot
Wastes
VOICEOFTHECUSTOMER
tounderstandwhat
customerneedsand
expects&translateitinto
measurablerequirements
HOW - METHODS
Direct
Interviews
Focus groups
Be a customer
Indirect
Surveys
Market research
Complaints
WHAT - ANALYSIS
Metrics
Drivers
Customer Needs Correct Invoice
Aligned prices &
promos
% of one-time
promos
% of claims
Correct data in
system
% of RFT
SWEETSPOTis
theareawhere
thereistheright
balance ofall
value perspectives
WASTEis
everything that
doesnotadd
value tothe
customer
PRACTICE
WASTES
PracticeSeeing
Waste
SHOPPING
COFFEE
PLAY
BALL SIMULATION
LEARN
FAILURE DEMAND
DEMAND PROFILE
PUSH & PULL
FAILUREDEMANDis
generatedwithinor
fromtheprocess
itselfdueto
inefficienciesor
faultydesign
DEMANDPROFILEis
theratioofValue
Demandcomparedto
FailureDemand
PUSHmeans
MaketoStock
PULLmeans Make
toOrder
PLAY
ENVELOPE SIMULATION
LEARN
Value Stream Mapping
Lean Office measures
Process data & measures
VALUESTREAM
MAPPINGistovisualize
thestepsneededto
takefromproduct
creationtodeliveringit
totheend-customer
LEANOFFICEMEASURESare
designedtospecifically
measuringthecompleteE2E
performance
The complete time, from beginning till the
end of the E2E Process
Process Lead
Time
• Lead-time is calculated as the difference between the time the demand is
placed in the system to the point when the final product or service is
delivered
Ratio of Failure Demand to Value Demand
Demand
Profile
• Failure Demand: Customer Demand which is generated due to process
inefficiencies or faulty design.
The right first time quality of the whole E2E
Process
Process
Quality
• Right First Time: Measures the ability of the process to deliver the service or
product without incident of error and/or rework in each process activity.
HANDOFFSDIAGRAM
focusesonhandoffof
informationbetween
differentcontributors
PROCESSEVALUATION
• Value Adding - Activity that transforms
information or a decision into a value
proposition
• Non-Value Adding - Activity that do not
transform information or a decision into a value
proposition, customer is not willing to pay for
this activity
Value
• Key issues like manual work, wastes,
interruptions, known issues, handovers seen in
a consolidated view
• Opportunities for transformation:
standardization, simplification etc
Issues &
Opportunities
• Time: activity time, actual process time,
process lead time
• Quality: Demand Profile, Right First Time
Time & Quality
Measures
PRACTICE
MAPPING
LEARN
IDEAL STATE
FUTURE STATE
Imagine apurely
LEANprocess
withmax VALUE
andzerowaste
going inaFLOW
FUTURESTATE
DESIGN iterations
&considerations
• Keep focus on value drivers and assign
‘guardians’
• Document activity, input and output
• Go through a few iterations to refine and
consolidate
• Assess risks, add enablers and KPIs
• Develop action plan, identify & plan deep
dives & note quick wins
• Stay connected during implementation
PLAY
PARADIGMS
PRACTICE
FUTURE STATE MAPPING
SUMMARY
QUIZ
What is the goal of LEAN?GOAL
•Create more value for customers while optimizing resources
How to define value for customers?VALUE
•SIPOC
•VoC & CCR
•Sweet Spot
How to see & remove wastes?WASTE
•TIMWOOD +1
What measures help to assess the process?MEASURES
•VA vs NVA, Demand Profile, RFT
•Time: Actual Process Time, Activity Time, Process Lead Time
•Handovers, bottlenecks, issues & opportunities
How to reach future process state?MAPPING
•AS-IS Value Stream Mapping
•Ideal state
•TO-BE Future State: activity, input, output, enablers, risks, KPIs,
deep dives
Workshop "Lean made simple: learn, play, practice"

Workshop "Lean made simple: learn, play, practice"