Downloaded 205 times
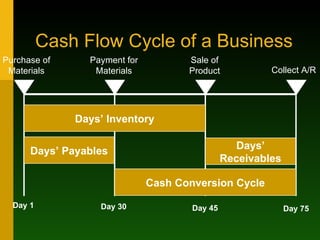
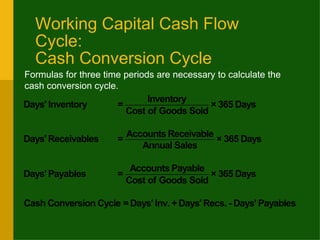

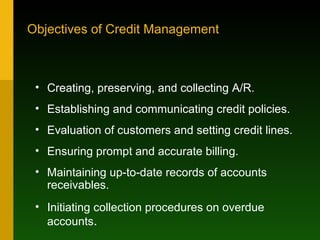

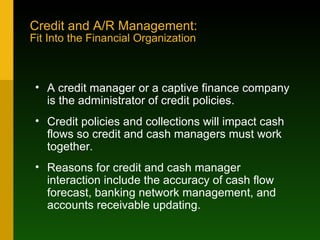
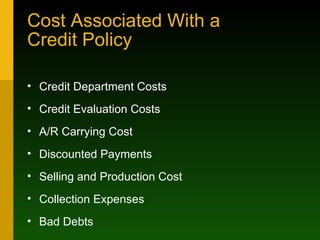
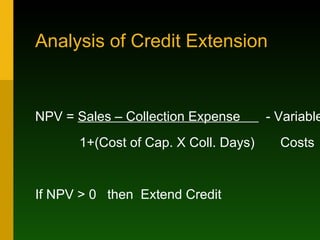
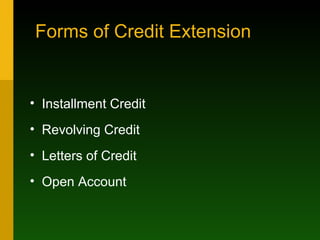
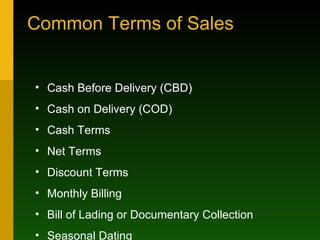
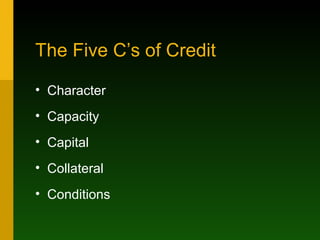


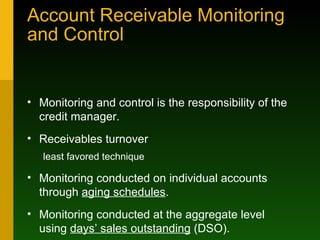


The document discusses various topics related to working capital, credit, and accounts receivable management. It defines key terms like cash conversion cycle, days' receivables, days' payables, and presents formulas to calculate them. It also discusses credit policies, objectives of credit management, reasons for offering credit, costs associated with credit, and techniques for monitoring and controlling accounts receivable like aging schedules and days' sales outstanding.