Downloaded 167 times

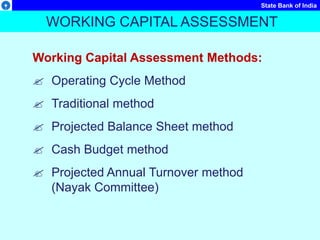
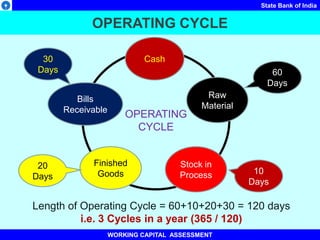
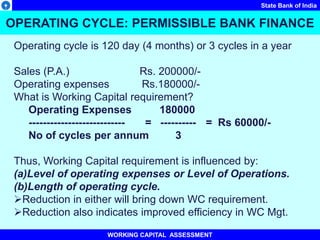
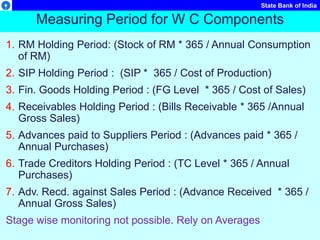
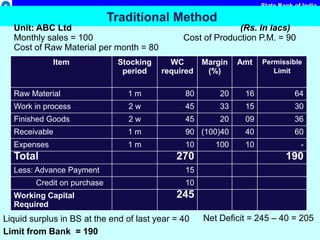
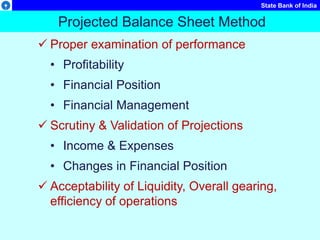
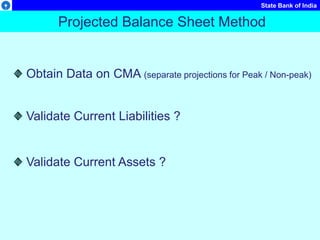
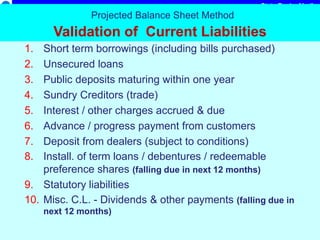
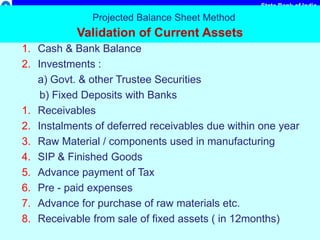
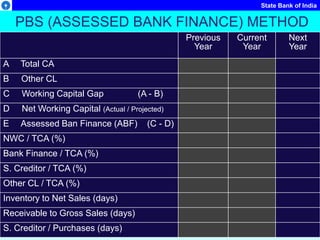
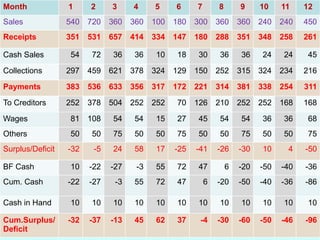
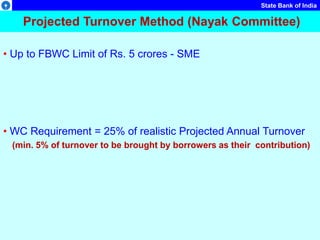
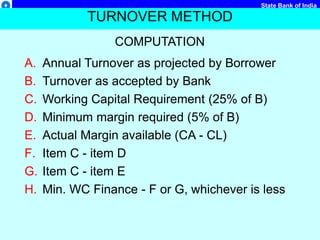
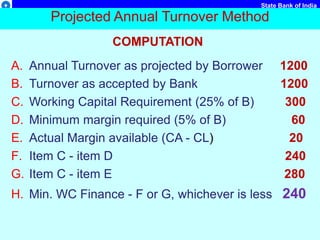
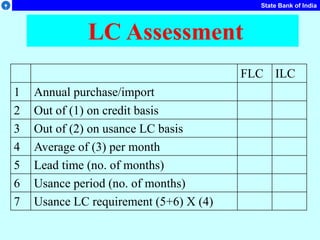

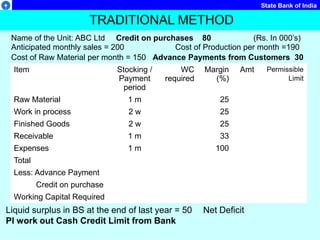
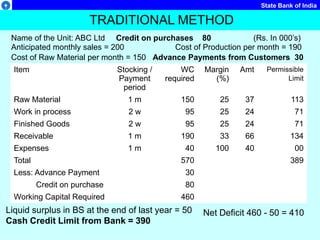

The document discusses various methods used to assess working capital requirements for providing bank finance, including: 1. The traditional method, which calculates the working capital required for individual components like raw materials, work in progress, receivables, etc. based on their holding periods. 2. The projected balance sheet method, which validates the current assets and liabilities projected in the balance sheet to determine the bank finance required. 3. The operating cycle method measures the working capital needs based on the time required to convert raw materials into finished goods and then into receivables through sales.


