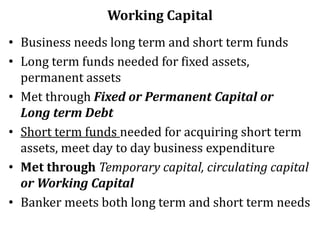
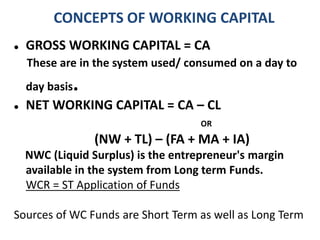
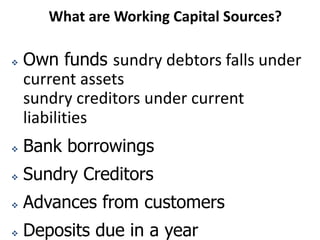
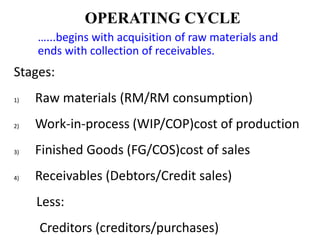
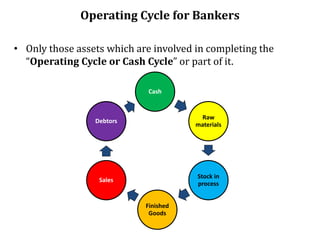
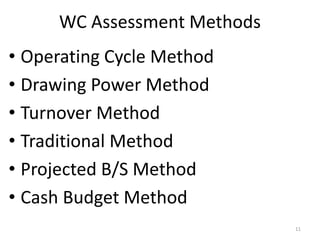
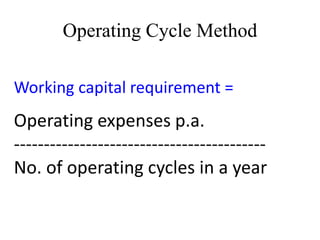
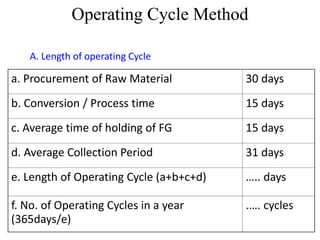
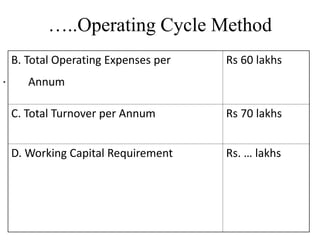
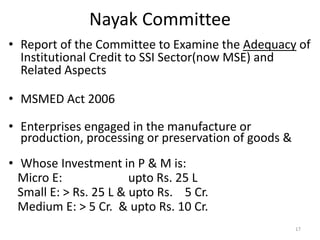
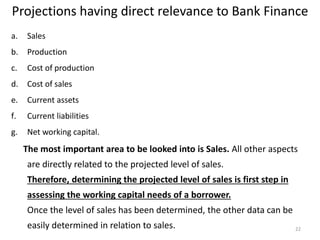
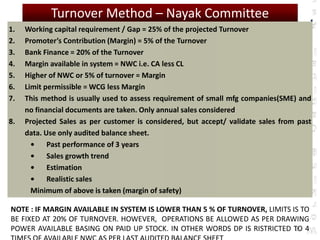
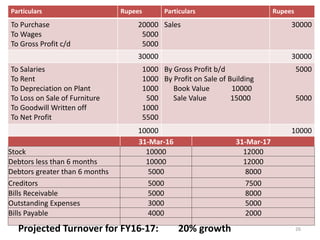
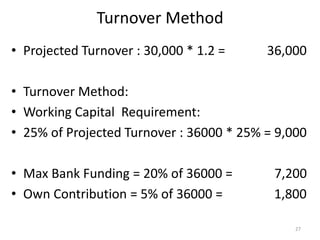
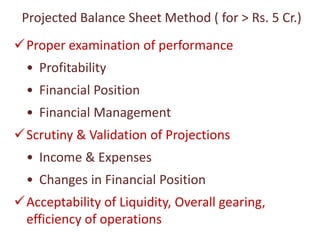
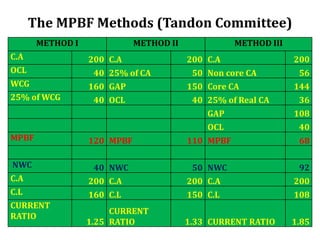
Working Capital
By
P. Venkat Rao
1
Funds required to acquire current
assets to enable business/industry
to operate at the expected levels.
What is Working Capital ?
Working Capital
• Business needs long term and short term funds
• Long term funds needed for fixed assets,
permanent assets
• Met through Fixed or Permanent Capital or
Long term Debt
• Short term funds needed for acquiring short term
assets, meet day to day business expenditure
• Met through Temporary capital, circulating capital
or Working Capital
• Banker meets both long term and short term needs
CONCEPTS OF WORKING CAPITAL
 GROSS WORKING CAPITAL = CA
These are in the system used/ consumed on a day to
day basis.
 NET WORKING CAPITAL = CA – CL
OR
(NW + TL) – (FA + MA + IA)
NWC (Liquid Surplus) is the entrepreneur's margin
available in the system from Long term Funds.
WCR = ST Application of Funds
Sources of WC Funds are Short Term as well as Long Term
WC Limits
• Cash Credit & OD facilities
• Drawing Power
• ‘Interest only’ facility
• Interest charged on the capital used
• Validity of 12 months; Renewal at existing level or
with enhancement or reduction of limit
• Short term, but practically speaking, WC finance
is long term !
• Requires closer & greater monitoring
• Project Cost : Margin for Working Capital
• Self-liquidating
5
What are Working Capital Sources?
 Own funds sundry debtors falls under
current assets
sundry creditors under current
liabilities
 Bank borrowings
 Sundry Creditors
 Advances from customers
 Deposits due in a year
Current Assets for Bankers
• Any Asset that gets converted into cash within
the “Operating Cycle” or which forms part of
the operating cycle is current Asset for
bankers
• Logic- Bank finance to be used only for creation
of assets which will be sold and reconverted
into cash
• Investments in subsidiaries, deposits with
customs, electricity boards, municipal
authorities, advances to staff etc would not be
current assets to bankers
OPERATING CYCLE
Stages:
1) Raw materials (RM/RM consumption)
2) Work-in-process (WIP/COP)cost of production
3) Finished Goods (FG/COS)cost of sales
4) Receivables (Debtors/Credit sales)
Less:
Creditors (creditors/purchases)
…...begins with acquisition of raw materials and
ends with collection of receivables.
Operating Cycle for Bankers
• Only those assets which are involved in completing the
“Operating Cycle or Cash Cycle” or part of it.
Cash
Raw
materials
Stock in
process
Finished
Goods
Sales
Debtors
Service
Length of Operating Cycle
Receivables
Cash
Trade Industry
CashCash
Stocks
Receivables Receivables
Finished Goods
Semi Finished Goods
Raw
Material
WC Assessment Methods
• Operating Cycle Method
• Drawing Power Method
• Turnover Method
• Traditional Method
• Projected B/S Method
• Cash Budget Method
11
Operating Cycle Method
Working capital requirement =
Operating expenses p.a.
------------------------------------------
No. of operating cycles in a year
Operating Cycle Method
A. Length of operating Cycle
a. Procurement of Raw Material 30 days
b. Conversion / Process time 15 days
c. Average time of holding of FG 15 days
d. Average Collection Period 31 days
e. Length of Operating Cycle (a+b+c+d) ….. days
f. No. of Operating Cycles in a year
(365days/e)
.…. cycles
…..Operating Cycle Method
•
B. Total Operating Expenses per
Annum
Rs 60 lakhs
C. Total Turnover per Annum Rs 70 lakhs
D. Working Capital Requirement Rs. … lakhs
Drawing Power Method
(for units with small limits)
Particulars Stock value Margin DP
Paid stocks (RM -- Creditors) 4 25% …
Semi Finished goods 4 50% …
Finished goods 4 25% …
Book debts 4 50% …
Total … …
(Rs.in lacs)
Drawing Power Method
(for units with small limits)
Particulars Stock value Margin DP
Paid stocks (RM -- Creditors) 4 25% 3
Semi Finished goods 4 50% 2
Finished goods 4 25% 3
Book debts 4 50% 2
Total 16 10
(Rs.in lacs)
Nayak Committee
• Report of the Committee to Examine the Adequacy of
Institutional Credit to SSI Sector(now MSE) and
Related Aspects
• MSMED Act 2006
• Enterprises engaged in the manufacture or
production, processing or preservation of goods &
• Whose Investment in P & M is:
Micro E: upto Rs. 25 L
Small E: > Rs. 25 L & upto Rs. 5 Cr.
Medium E: > 5 Cr. & upto Rs. 10 Cr.
17
Recommendations
• (i) give pref. to village industries, tiny industries
and other small scale units in that order, while
meeting the credit requirements of the SSI;
• (ii) grant working capital credit limits to SSI (now
MSE) units computed on the basis of minimum
20% of their est. annual turnover whose credit
limit in individual cases is upto Rs.2 Cr.[since
raised, Rs.5 Cr.]
18
DANGERS OF INADEQUATE WORKING CAPITAL
1.It Stagnates Growth
2.Fixed Assets Underutilised
3.Operating Inefficiency Creeps In
4.Difficult To Achieve Targets Of Business For
Production And Profit
5.Business Reputation At Stake
6.Situation Of Tight Credit Terms
7.Difficult To Meet Payment Commitments
19
DANGERS OF EXCESSIVE WORKING CAPITAL
1.Accumulation Of Unnecessary Inventory
2.Risk Of Loss By Theft, And Wastage
3.Makes Management Complacent And Ineffective.
4.Results In Speculative Trend
5.Scope For Diversion Of Funds
6.Indication Of Defective Credit Policy
7.Slack Collection Of Receivable
8.Leads To Higher Incidence Of Bad Debts
20
FACTORS INFULENCING WORKING
CAPITAL REQUIREMENT
Nature of business – service/trade/manufacturing.
Seasonality of operations – peak/non peak
Production Policy – Constant/seasonal
Market conditions- competition/credit terms
Conditions of supply of RM/stores/spares etc.
Quantum of production/Turnover(level of activity)
Operating Cycle
Current Assets to be maintained
Projections having direct relevance to Bank Finance
a. Sales
b. Production
c. Cost of production
d. Cost of sales
e. Current assets
f. Current liabilities
g. Net working capital.
The most important area to be looked into is Sales. All other aspects
are directly related to the projected level of sales.
Therefore, determining the projected level of sales is first step in
assessing the working capital needs of a borrower.
Once the level of sales has been determined, the other data can be
easily determined in relation to sales. 22
Projected Turnover depends on
• What is the installed and licensed CAPACITY? Does it have
any idle capacity which can now be utilised?
• Is the unit undertaking any expansion, modernisation or
diversification program? Have any funds been earmarked
for the same in the projections? Are they going to affect
the quantum of production for the following year and to
what extent? This will be very relevant where the borrower
is projecting more than normal rate of growth in respect of
production and sales.
• Are essential inputs available to take care of projected
production figure?
23
Projected Turnover depends on
• What are the present market conditions and terms of
sales? What plans are there to boost sales. Will the sales in
future be on more favorable terms to the buyers? If the
period of credit is going to be extended is holding of
increased levels of receivables proposed to be financed?
Will it be within the lower of past trends or norms?
• Is the unit proposing to launch an export drive to capture
international markets?
• Are there any pending orders in hand? What has been the
position in the previous years? Was the unit forced to
launch any distress sales in the past?
24
W
o
r
k
i
n
g
C
a
p
i
t
a
l
A
s
25
Turnover Method – Nayak Committee
1. Working capital requirement / Gap = 25% of the projected Turnover
2. Promoter’s Contribution (Margin) = 5% of the Turnover
3. Bank Finance = 20% of the Turnover
4. Margin available in system = NWC i.e. CA less CL
5. Higher of NWC or 5% of turnover = Margin
6. Limit permissible = WCG less Margin
7. This method is usually used to assess requirement of small mfg companies(SME) and
no financial documents are taken. Only annual sales considered
8. Projected Sales as per customer is considered, but accept/ validate sales from past
data. Use only audited balance sheet.
• Past performance of 3 years
• Sales growth trend
• Estimation
• Realistic sales
Minimum of above is taken (margin of safety)
NOTE : IF MARGIN AVAILABLE IN SYSTEM IS LOWER THAN 5 % OF TURNOVER, LIMITS IS TO
BE FIXED AT 20% OF TURNOVER. HOWEVER, OPERATIONS BE ALLOWED AS PER DRAWING
POWER AVAILABLE BASING ON PAID UP STOCK. IN OTHER WORDS DP IS RISTRICTED TO 4
Particulars Rupees Particulars Rupees
To Purchase
To Wages
To Gross Profit c/d
20000
5000
5000
Sales 30000
30000 30000
To Salaries
To Rent
To Depreciation on Plant
To Loss on Sale of Furniture
To Goodwill Written off
To Net Profit
1000
1000
1000
500
1000
5500
By Gross Profit b/d
By Profit on Sale of Building
Book Value 10000
Sale Value 15000
5000
5000
10000 10000
31-Mar-16 31-Mar-17
Stock 10000 12000
Debtors less than 6 months 10000 12000
Debtors greater than 6 months 5000 8000
Creditors 5000 7500
Bills Receivable 5000 8000
Outstanding Expenses 3000 5000
Bills Payable 4000 2000
Projected Turnover for FY16-17: 20% growth 26
Turnover Method
• Projected Turnover : 30,000 * 1.2 = 36,000
• Turnover Method:
• Working Capital Requirement:
• 25% of Projected Turnover : 36000 * 25% = 9,000
• Max Bank Funding = 20% of 36000 = 7,200
• Own Contribution = 5% of 36000 = 1,800
27
Projected Balance Sheet Method ( for > Rs. 5 Cr.)
Proper examination of performance
• Profitability
• Financial Position
• Financial Management
Scrutiny & Validation of Projections
• Income & Expenses
• Changes in Financial Position
Acceptability of Liquidity, Overall gearing,
efficiency of operations
The MPBF Methods (Tandon Committee)
METHOD I METHOD II METHOD III
C.A 200 C.A 200 C.A 200
OCL 40 25% of CA 50 Non core CA 56
WCG 160 GAP 150 Core CA 144
25% of WCG 40 OCL 40 25% of Real CA 36
GAP 108
OCL 40
MPBF 120 MPBF 110 MPBF 68
NWC 40 NWC 50 NWC 92
C.A 200 C.A 200 C.A 200
C.L 160 C.L 150 C.L 108
CURRENT
RATIO
1.25
CURRENT
RATIO 1.33 CURRENT RATIO 1.85
Cash Budget Method
• Peak deficit is financed and drawings regulated by
monthly budgets.
• Advantages:
 Suitable for seasonal industries, contractors,
software exporters etc.
 Limitations:
 Will not reflect changes in various current assets and
liabilities.
 Will not give a clue whether a company is earning
 profit or not.

Funds flow statement is required to detect any
diversion of funds. 30
•Thank You !
31

15. working capital

  • 1.
  • 2.
    Funds required toacquire current assets to enable business/industry to operate at the expected levels. What is Working Capital ?
  • 3.
    Working Capital • Businessneeds long term and short term funds • Long term funds needed for fixed assets, permanent assets • Met through Fixed or Permanent Capital or Long term Debt • Short term funds needed for acquiring short term assets, meet day to day business expenditure • Met through Temporary capital, circulating capital or Working Capital • Banker meets both long term and short term needs
  • 4.
    CONCEPTS OF WORKINGCAPITAL  GROSS WORKING CAPITAL = CA These are in the system used/ consumed on a day to day basis.  NET WORKING CAPITAL = CA – CL OR (NW + TL) – (FA + MA + IA) NWC (Liquid Surplus) is the entrepreneur's margin available in the system from Long term Funds. WCR = ST Application of Funds Sources of WC Funds are Short Term as well as Long Term
  • 5.
    WC Limits • CashCredit & OD facilities • Drawing Power • ‘Interest only’ facility • Interest charged on the capital used • Validity of 12 months; Renewal at existing level or with enhancement or reduction of limit • Short term, but practically speaking, WC finance is long term ! • Requires closer & greater monitoring • Project Cost : Margin for Working Capital • Self-liquidating 5
  • 6.
    What are WorkingCapital Sources?  Own funds sundry debtors falls under current assets sundry creditors under current liabilities  Bank borrowings  Sundry Creditors  Advances from customers  Deposits due in a year
  • 7.
    Current Assets forBankers • Any Asset that gets converted into cash within the “Operating Cycle” or which forms part of the operating cycle is current Asset for bankers • Logic- Bank finance to be used only for creation of assets which will be sold and reconverted into cash • Investments in subsidiaries, deposits with customs, electricity boards, municipal authorities, advances to staff etc would not be current assets to bankers
  • 8.
    OPERATING CYCLE Stages: 1) Rawmaterials (RM/RM consumption) 2) Work-in-process (WIP/COP)cost of production 3) Finished Goods (FG/COS)cost of sales 4) Receivables (Debtors/Credit sales) Less: Creditors (creditors/purchases) …...begins with acquisition of raw materials and ends with collection of receivables.
  • 9.
    Operating Cycle forBankers • Only those assets which are involved in completing the “Operating Cycle or Cash Cycle” or part of it. Cash Raw materials Stock in process Finished Goods Sales Debtors
  • 10.
    Service Length of OperatingCycle Receivables Cash Trade Industry CashCash Stocks Receivables Receivables Finished Goods Semi Finished Goods Raw Material
  • 11.
    WC Assessment Methods •Operating Cycle Method • Drawing Power Method • Turnover Method • Traditional Method • Projected B/S Method • Cash Budget Method 11
  • 12.
    Operating Cycle Method Workingcapital requirement = Operating expenses p.a. ------------------------------------------ No. of operating cycles in a year
  • 13.
    Operating Cycle Method A.Length of operating Cycle a. Procurement of Raw Material 30 days b. Conversion / Process time 15 days c. Average time of holding of FG 15 days d. Average Collection Period 31 days e. Length of Operating Cycle (a+b+c+d) ….. days f. No. of Operating Cycles in a year (365days/e) .…. cycles
  • 14.
    …..Operating Cycle Method • B.Total Operating Expenses per Annum Rs 60 lakhs C. Total Turnover per Annum Rs 70 lakhs D. Working Capital Requirement Rs. … lakhs
  • 15.
    Drawing Power Method (forunits with small limits) Particulars Stock value Margin DP Paid stocks (RM -- Creditors) 4 25% … Semi Finished goods 4 50% … Finished goods 4 25% … Book debts 4 50% … Total … … (Rs.in lacs)
  • 16.
    Drawing Power Method (forunits with small limits) Particulars Stock value Margin DP Paid stocks (RM -- Creditors) 4 25% 3 Semi Finished goods 4 50% 2 Finished goods 4 25% 3 Book debts 4 50% 2 Total 16 10 (Rs.in lacs)
  • 17.
    Nayak Committee • Reportof the Committee to Examine the Adequacy of Institutional Credit to SSI Sector(now MSE) and Related Aspects • MSMED Act 2006 • Enterprises engaged in the manufacture or production, processing or preservation of goods & • Whose Investment in P & M is: Micro E: upto Rs. 25 L Small E: > Rs. 25 L & upto Rs. 5 Cr. Medium E: > 5 Cr. & upto Rs. 10 Cr. 17
  • 18.
    Recommendations • (i) givepref. to village industries, tiny industries and other small scale units in that order, while meeting the credit requirements of the SSI; • (ii) grant working capital credit limits to SSI (now MSE) units computed on the basis of minimum 20% of their est. annual turnover whose credit limit in individual cases is upto Rs.2 Cr.[since raised, Rs.5 Cr.] 18
  • 19.
    DANGERS OF INADEQUATEWORKING CAPITAL 1.It Stagnates Growth 2.Fixed Assets Underutilised 3.Operating Inefficiency Creeps In 4.Difficult To Achieve Targets Of Business For Production And Profit 5.Business Reputation At Stake 6.Situation Of Tight Credit Terms 7.Difficult To Meet Payment Commitments 19
  • 20.
    DANGERS OF EXCESSIVEWORKING CAPITAL 1.Accumulation Of Unnecessary Inventory 2.Risk Of Loss By Theft, And Wastage 3.Makes Management Complacent And Ineffective. 4.Results In Speculative Trend 5.Scope For Diversion Of Funds 6.Indication Of Defective Credit Policy 7.Slack Collection Of Receivable 8.Leads To Higher Incidence Of Bad Debts 20
  • 21.
    FACTORS INFULENCING WORKING CAPITALREQUIREMENT Nature of business – service/trade/manufacturing. Seasonality of operations – peak/non peak Production Policy – Constant/seasonal Market conditions- competition/credit terms Conditions of supply of RM/stores/spares etc. Quantum of production/Turnover(level of activity) Operating Cycle Current Assets to be maintained
  • 22.
    Projections having directrelevance to Bank Finance a. Sales b. Production c. Cost of production d. Cost of sales e. Current assets f. Current liabilities g. Net working capital. The most important area to be looked into is Sales. All other aspects are directly related to the projected level of sales. Therefore, determining the projected level of sales is first step in assessing the working capital needs of a borrower. Once the level of sales has been determined, the other data can be easily determined in relation to sales. 22
  • 23.
    Projected Turnover dependson • What is the installed and licensed CAPACITY? Does it have any idle capacity which can now be utilised? • Is the unit undertaking any expansion, modernisation or diversification program? Have any funds been earmarked for the same in the projections? Are they going to affect the quantum of production for the following year and to what extent? This will be very relevant where the borrower is projecting more than normal rate of growth in respect of production and sales. • Are essential inputs available to take care of projected production figure? 23
  • 24.
    Projected Turnover dependson • What are the present market conditions and terms of sales? What plans are there to boost sales. Will the sales in future be on more favorable terms to the buyers? If the period of credit is going to be extended is holding of increased levels of receivables proposed to be financed? Will it be within the lower of past trends or norms? • Is the unit proposing to launch an export drive to capture international markets? • Are there any pending orders in hand? What has been the position in the previous years? Was the unit forced to launch any distress sales in the past? 24
  • 25.
    W o r k i n g C a p i t a l A s 25 Turnover Method –Nayak Committee 1. Working capital requirement / Gap = 25% of the projected Turnover 2. Promoter’s Contribution (Margin) = 5% of the Turnover 3. Bank Finance = 20% of the Turnover 4. Margin available in system = NWC i.e. CA less CL 5. Higher of NWC or 5% of turnover = Margin 6. Limit permissible = WCG less Margin 7. This method is usually used to assess requirement of small mfg companies(SME) and no financial documents are taken. Only annual sales considered 8. Projected Sales as per customer is considered, but accept/ validate sales from past data. Use only audited balance sheet. • Past performance of 3 years • Sales growth trend • Estimation • Realistic sales Minimum of above is taken (margin of safety) NOTE : IF MARGIN AVAILABLE IN SYSTEM IS LOWER THAN 5 % OF TURNOVER, LIMITS IS TO BE FIXED AT 20% OF TURNOVER. HOWEVER, OPERATIONS BE ALLOWED AS PER DRAWING POWER AVAILABLE BASING ON PAID UP STOCK. IN OTHER WORDS DP IS RISTRICTED TO 4
  • 26.
    Particulars Rupees ParticularsRupees To Purchase To Wages To Gross Profit c/d 20000 5000 5000 Sales 30000 30000 30000 To Salaries To Rent To Depreciation on Plant To Loss on Sale of Furniture To Goodwill Written off To Net Profit 1000 1000 1000 500 1000 5500 By Gross Profit b/d By Profit on Sale of Building Book Value 10000 Sale Value 15000 5000 5000 10000 10000 31-Mar-16 31-Mar-17 Stock 10000 12000 Debtors less than 6 months 10000 12000 Debtors greater than 6 months 5000 8000 Creditors 5000 7500 Bills Receivable 5000 8000 Outstanding Expenses 3000 5000 Bills Payable 4000 2000 Projected Turnover for FY16-17: 20% growth 26
  • 27.
    Turnover Method • ProjectedTurnover : 30,000 * 1.2 = 36,000 • Turnover Method: • Working Capital Requirement: • 25% of Projected Turnover : 36000 * 25% = 9,000 • Max Bank Funding = 20% of 36000 = 7,200 • Own Contribution = 5% of 36000 = 1,800 27
  • 28.
    Projected Balance SheetMethod ( for > Rs. 5 Cr.) Proper examination of performance • Profitability • Financial Position • Financial Management Scrutiny & Validation of Projections • Income & Expenses • Changes in Financial Position Acceptability of Liquidity, Overall gearing, efficiency of operations
  • 29.
    The MPBF Methods(Tandon Committee) METHOD I METHOD II METHOD III C.A 200 C.A 200 C.A 200 OCL 40 25% of CA 50 Non core CA 56 WCG 160 GAP 150 Core CA 144 25% of WCG 40 OCL 40 25% of Real CA 36 GAP 108 OCL 40 MPBF 120 MPBF 110 MPBF 68 NWC 40 NWC 50 NWC 92 C.A 200 C.A 200 C.A 200 C.L 160 C.L 150 C.L 108 CURRENT RATIO 1.25 CURRENT RATIO 1.33 CURRENT RATIO 1.85
  • 30.
    Cash Budget Method •Peak deficit is financed and drawings regulated by monthly budgets. • Advantages:  Suitable for seasonal industries, contractors, software exporters etc.  Limitations:  Will not reflect changes in various current assets and liabilities.  Will not give a clue whether a company is earning  profit or not.  Funds flow statement is required to detect any diversion of funds. 30
  • 31.

Editor's Notes