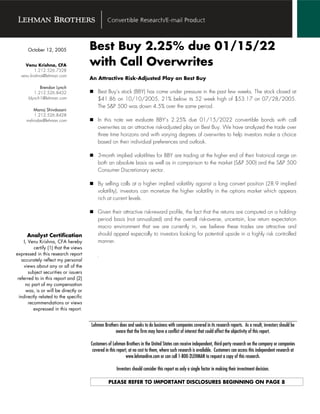
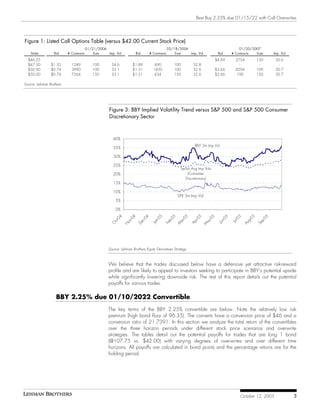
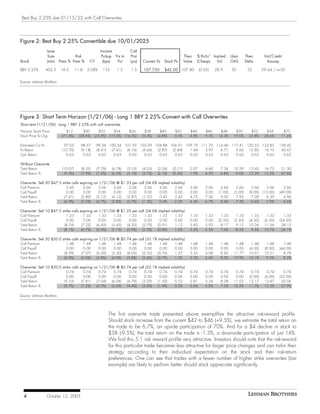
SlideShare a Scribd company logo
October 12, 2005                  Best Buy 2.25% due 01/15/22
    Venu Krishna, CFA                   with Call Overwrites
          1.212.526.7328
  venu.krishna@lehman.com
                                        An Attractive Risk-Adjusted Play on Best Buy
            Brendan Lynch
         1.212.526.8432                     Best Buy’s stock (BBY) has come under pressure in the past few weeks. The stock closed at
      blynch1@lehman.com                    $41.86 on 10/10/2005, 21% below its 52 week high of $53.17 on 07/28/2005.
                                            The S&P 500 was down 4.5% over the same period.
         Manoj Shivdasani
         1.212.526.8428
     mshivdas@lehman.com                    In this note we evaluate BBY’s 2.25% due 01/15/2022 convertible bonds with call
                                            overwrites as an attractive risk-adjusted play on Best Buy. We have analyzed the trade over
                                            three time horizons and with varying degrees of overwrites to help investors make a choice
                                            based on their individual preferences and outlook.

                                            3-month implied volatilities for BBY are trading at the higher end of their historical range on
                                            both an absolute basis as well as in comparison to the market (S&P 500) and the S&P 500
                                            Consumer Discretionary sector.

                                            By selling calls at a higher implied volatility against a long convert position (28.9 implied
                                            volatility), investors can monetize the higher volatility in the options market which appears
                                            rich at current levels.

                                            Given their attractive risk-reward profile, the fact that the returns are computed on a holding-
                                            period basis (not annualized) and the overall risk-averse, uncertain, low return expectation
                                            macro environment that we are currently in, we believe these trades are attractive and
      Analyst Certification                 should appeal especially to investors looking for potential upside in a highly risk controlled
     I, Venu Krishna, CFA hereby            manner.
           certify (1) that the views
expressed in this research report          .
    accurately reflect my personal
     views about any or all of the
        subject securities or issuers
 referred to in this report and (2)
      no part of my compensation
      was, is or will be directly or
  indirectly related to the specific
        recommendations or views
           expressed in this report.


                                        Lehman Brothers does and seeks to do business with companies covered in its research reports. As a result, investors should be
                                                     aware that the firm may have a conflict of interest that could affect the objectivity of this report.

                                        Customers of Lehman Brothers in the United States can receive independent, third-party research on the company or companies
                                         covered in this report, at no cost to them, where such research is available. Customers can access this independent research at
                                                               www.lehmanlive.com or can call 1-800-2LEHMAN to request a copy of this research.

                                                        Investors should consider this report as only a single factor in making their investment decision.

                                                   PLEASE REFER TO IMPORTANT DISCLOSURES BEGINNING ON PAGE 8
Best Buy 2.25% due 01/15/22 with Call Overwrites


                Introduction
                                         Best Buy’s stock (BBY) has come under pressure in the past few weeks. The stock closed at
                                         $41.86 on 10/10/2005, 21% below its 52 week high of $53.17 on 07/28/2005.
                                         Lehman Brothers fundamental research analyst Alan M. Rifkin believes that after an
                                         impressive 1Q, 2Q results and management’s maintained full year guidance fell short of
                                         investor’s expectations, which is why the stock has been weak. In our opinion, high oil
                                         prices, an uncertain interest rate environment, lowered expectations on consumer spending
                                         and the after effects of the hurricanes have also likely led to the decline of BBY’s stock
                                         price. Lehman Brothers’ fundamental research stock and sector ratings remain positive at 1-
                                         Overweight/1-Positive with a 12-month price target of $57.00 based on a 22x multiple of
                                         2006 earnings estimate of $2.58 (including $0.11 of options expense).


                                         In this note we evaluate BBY’s 2.25% due 01/15/2022 convertible bonds with call
                                         overwrites as an attractive risk-adjusted play on Best Buy. We have analyzed the trade
                                         over three time horizons and with varying degrees of overwrites to help investors make a
                                         choice based on their individual preferences and outlook. Also, we have chosen option
                                         contracts that are relatively liquid for ease of execution.


                                         ~3 month – short term to include near-term preliminary data on holiday season spending
                                         and to end coincidentally with the 01/21/06 options expiry date


                                         ~5 month – medium term to include actual reported results for the holiday season and to
                                         end coincidentally with the 03/18/06 options expiry date


                                         ~15 month – relatively longer term till the first put/call date (01/15/2007) on the bonds
                                         (options expire on 01/20/07)

                                                                                            1
                                         According to our Equity Derivatives Strategy Team 3-month implied volatilities for BBY are
                                         trading at the higher end of their historical range on both an absolute basis as well as in
                                         comparison to the market (S&P 500) and the S&P 500 Consumer Discretionary sector.
                                         Since the Company is next scheduled to report earnings in December, the recent run up in
                                         risk expectations seems to be driven more by factors discussed earlier.


                                         By selling calls at a higher implied volatility against a long convert position (28.9 implied
                                         volatility), investors can monetize the higher volatility in the options market which appears
                                         rich at current levels. For example, the $47.5 strike 1/21/06 expiry calls have an implied
                                         volatility of 34.6% and the $50 strike calls with the same expiry have an implied volatility
                                         of 33.1% The $50 strike, longer dated calls expiring in January 2007 too have an
                                         implied volatility of 30.7% which is 1.8 points higher than the implied volatility of the
                                         convert.


                                         1
                                             Ryan Renicker and Devapriya Mallick.


2          October 12, 2005
Best Buy 2.25% due 01/15/22 with Call Overwrites


Figure 1: Listed Call Options Table (versus $42.00 Current Stock Price)
                                        01/21/2006                                             03/18/2006                                   01/20/2007
    Strike        Bid     # Contracts       Size   Imp. Vol            Bid       # Contracts       Size   Imp. Vol             Bid      # Contracts Size           Imp. Vol
  $46.25           -          -             -           -             -              -              -          -              $4.69       2754            150       30.6
  $47.50        $1.33       1249           100        34.6         $1.89            490            100       32.8                -          -              -          -
  $50.00        $0.74       3990           100        33.1         $1.31           1850            100       32.6             $3.66       4294            100       30.7
  $50.00        $0.74       7264           150        33.1         $1.31            434            150       32.6             $3.66        190            150       30.7

Source: Lehman Brothers


                                                    Figure 3: BBY Implied Volatility Trend versus S&P 500 and S&P 500 Consumer
                                                    Discretionary Sector


                                                       40%
                                                                                                              BBY 3m Imp Vol
                                                       35%

                                                       30%

                                                       25%
                                                                                                      Sector Avg Imp Vols
                                                       20%                                                (Consumer
                                                                                                         Discretionary)
                                                       15%

                                                       10%
                                                                                                    SPX 3m Imp Vol
                                                        5%

                                                        0%
                                                                  4


                                                                                                      5


                                                                                                                 5
                                                         04


                                                                                      5


                                                                                                      5


                                                                                                                          5


                                                                                                                                    5

                                                                                                                                         05


                                                                                                                                                     5


                                                                                                                                                              05
                                                                             4


                                                                                                    -0


                                                                                                              -0


                                                                                                                        -0
                                                                  -0


                                                                                    n-0


                                                                                               0


                                                                                                                                 -0


                                                                                                                                                      0
                                                                         c-0
                                                      ct-


                                                                                                                                                            p-
                                                                                                                                           -
                                                                                            b-


                                                                                                                                                   g-
                                                                                                  ar


                                                                                                               r
                                                               ov


                                                                                                                     ay


                                                                                                                                        Jul
                                                                                                                               Jun
                                                                                                            Ap
                                                                       De


                                                                                  Ja


                                                                                          Fe


                                                                                                                                                          Se
                                                                                                                                                Au
                                                     O


                                                                                                 M
                                                              N


                                                                                                                     M


                                                    Source: Lehman Brothers Equity Derivatives Strategy


                                                    We believe that the trades discussed below have a defensive yet attractive risk-reward
                                                    profile and are likely to appeal to investors seeking to participate in BBY’s potential upside
                                                    while significantly lowering downside risk. The rest of this report details out the potential
                                                    payoffs for various trades.

                   BBY 2.25% due 01/10/2022 Convertible
                                                    The key terms of the BBY 2.25% convertible are below. Note the relatively low risk
                                                    premium (high bond floor of 96.35). The converts have a conversion price of $46 and a
                                                    conversion ratio of 21.7391. In this section we analyze the total return of the convertibles
                                                    over the three horizon periods under different stock price scenarios and overwrite
                                                    strategies. The tables detail out the potential payoffs for trades that are long 1 bond
                                                    (@107.75 vs. $42.00) with varying degrees of overwrites and over different time
                                                    horizons. All payoffs are calculated in bond points and the percentage returns are for the
                                                    holding period.


                                                                                                                                               October 12, 2005               3
Best Buy 2.25% due 01/15/22 with Call Overwrites


Figure 2: Best Buy 2.25% Convertible due 10/01/2025
                   Issue                              Income             Call
                   Size             Risk               Pickup Yrs to     Prot                                Theo    % Rich/ Implied        Libor      Theo        Vol/Credit
Bond               (mln)   Prem % Prem %       CY       (bps)  Put       (yrs)   Convert Px   Stock Px       Value   (Cheap)   Vol          OAS        Delta        Assump

BBY 2.25%          402.5   18.0        11.8   2.08%    133       1.3     1.3     107.750      $42.00      107.80       (0.05)    28.9       50          52        29 Vol / L+50


Source: Lehman Brothers


Figure 3: Short Term Horizon (1/21/06) - Long 1 BBY 2.25% Convert with Call Overwrites
Short term (1/21/06) - Long 1 BBY 2.25% with call overwrites
Horizon Stock Price            $12          $30     $32     $34     $36            $38      $40      $42        $44       $46      $48         $50        $52       $54      $72
Stock Price % Chg           (71.4%)      (28.6%) (23.8%) (19.0%) (14.3%)         (9.5%)   (4.8%)     0.0%       4.8%      9.5%    14.3%       19.0%      23.8%     28.6%    71.4%

Estimated Cvt Px             97.05        98.57     99.34 100.34 101.59 103.09 104.88 106.91 109.19 111.72 114.46 117.41 120.55 123.85                                      158.42
Px Return                   (10.70)       (9.18)    (8.41) (7.41) (6.16) (4.66) (2.87) (0.84)  1.44   3.97   6.71   9.66  12.80  16.10                                       50.67
Cpn Return                    0.63         0.63      0.63   0.63   0.63   0.63   0.63   0.63   0.63   0.63   0.63   0.63   0.63   0.63                                        0.63

Without Overwrite
Total Return                (10.07)       (8.55)    (7.78)    (6.78)   (5.53)    (4.03)   (2.24)    (0.21)      2.07      4.60     7.34       10.29      13.43     16.73    51.30
Total Return %                (9.3%)      (7.9%)    (7.2%)    (6.3%)   (5.1%)    (3.7%)   (2.1%)    (0.2%)      1.9%      4.3%     6.8%        9.6%      12.5%     15.5%    47.6%

Overwrite: Sell 20 $47.5 strike calls expiring on 1/21/06 @ $1.33 per call (34.6%         implied volatility)
Call Premium                2.66        2.66      2.66   2.66   2.66      2.66             2.66     2.66        2.66      2.66      2.66       2.66       2.66      2.66      2.66
Call Payoff                 0.00        0.00      0.00   0.00   0.00      0.00             0.00     0.00        0.00      0.00     (1.00)     (5.00)     (9.00)   (13.00)   (49.00)
Total Return              (7.41)       (5.89)   (5.12)  (4.12) (2.87)   (1.37)             0.42     2.45        4.73      7.26      9.00       7.95       7.09      6.39      4.96
Total Return %            (6.9%)       (5.5%)   (4.7%) (3.8%)  (2.7%)   (1.3%)             0.4%     2.3%        4.4%      6.7%      8.4%       7.4%       6.6%      5.9%      4.6%

Overwrite: Sell 10 $47.5 strike calls expiring on 1/21/06 @ $1.33 per call (34.6% implied volatility)
Call Premium                1.33        1.33      1.33   1.33   1.33      1.33     1.33     1.33                1.33      1.33      1.33       1.33       1.33      1.33      1.33
Call Payoff                 0.00        0.00      0.00   0.00   0.00      0.00     0.00     0.00                0.00      0.00     (0.50)     (2.50)     (4.50)    (6.50)   (24.50)
Total Return              (8.74)       (7.22)   (6.45)  (5.45) (4.20)   (2.70)    (0.91)    1.12                3.40      5.93      8.17       9.12      10.26     11.56     28.13
Total Return %            (8.1%)       (6.7%)   (6.0%) (5.1%)  (3.9%)   (2.5%)   (0.8%)     1.0%                3.2%      5.5%      7.6%       8.5%       9.5%     10.7%     26.1%

Overwrite: Sell 20 $50.0 strike calls expiring on 1/21/06 @ $0.74 per call (33.1% implied volatility)
Call Premium                1.48        1.48      1.48   1.48   1.48      1.48     1.48     1.48                1.48      1.48     1.48        1.48       1.48      1.48      1.48
Call Payoff                 0.00        0.00      0.00   0.00   0.00      0.00     0.00     0.00                0.00      0.00     0.00        0.00      (4.00)    (8.00)   (44.00)
Total Return              (8.59)       (7.07)   (6.30)  (5.30) (4.05)   (2.55)    (0.76)    1.27                3.55      6.08     8.82       11.77      10.91     10.21      8.78
Total Return %            (8.0%)       (6.6%)   (5.8%) (4.9%)  (3.8%)   (2.4%)   (0.7%)     1.2%                3.3%      5.6%     8.2%       10.9%      10.1%      9.5%      8.2%

Overwrite: Sell 10 $50.0 strike calls expiring on 1/21/06 @ $0.74 per call (33.1% implied volatility)
Call Premium                0.74        0.74      0.74   0.74   0.74      0.74     0.74     0.74                0.74      0.74     0.74        0.74       0.74      0.74      0.74
Call Payoff                 0.00        0.00      0.00   0.00   0.00      0.00     0.00     0.00                0.00      0.00     0.00        0.00      (2.00)    (4.00)   (22.00)
Total Return              (9.33)       (7.81)   (7.04)  (6.04) (4.79)   (3.29)    (1.50)    0.53                2.81      5.34     8.08       11.03      12.17     13.47     30.04
Total Return %            (8.7%)       (7.2%)   (6.5%) (5.6%)  (4.4%)   (3.0%)   (1.4%)     0.5%                2.6%      5.0%     7.5%       10.2%      11.3%     12.5%     27.9%

Source: Lehman Brothers


                                                             The first overwrite trade presented above exemplifies the attractive risk-reward profile.
                                                             Should stock increase from the current $42 to $46 (+9.5%), we estimate the total return on
                                                             the trade to be 6.7%, an upside participation of 70%. And for a $4 decline in stock to
                                                             $38 (-9.5%), the total return on the trade is -1.3%, a downside participation of just 14%.
                                                             We find this 5:1 risk reward profile very attractive. Investors should note that the risk-reward
                                                             for this particular trade becomes less attractive for larger price changes and can tailor their
                                                             strategy according to their individual expectation on the stock and their risk-return
                                                             preferences. One can see that trades with a fewer number of higher strike overwrites (last
                                                             example) are likely to perform better should stock appreciate significantly.


  4                October 12, 2005
Best Buy 2.25% due 01/15/22 with Call Overwrites


Figure 4: Medium Term Horizon (3/18/06) - Long 1 BBY 2.25% Convert with Call Overwrites
Horizon Stock Price          $12       $30     $32     $34     $36          $38       $40      $42        $44    $46     $48      $50      $52      $54       $72
Stock Price % Chg         (71.4%)   (28.6%) (23.8%) (19.0%) (14.3%)       (9.5%)    (4.8%)     0.0%       4.8%   9.5%   14.3%    19.0%    23.8%    28.6%     71.4%

Estimated Cvt Px           97.47     98.63    99.29 100.18 101.32 102.71 104.40 106.36 108.57 111.04 113.74 116.67 119.80 123.10                             157.93
Px Return                 (10.28)    (9.12)   (8.46) (7.57) (6.43) (5.04) (3.35) (1.40)  0.82   3.29   5.99   8.92  12.05  15.35                              50.18
Cpn Return                  2.88      2.88     2.88   2.88   2.88   2.88   2.88   2.88   2.88   2.88   2.88   2.88   2.88   2.88                               2.88

Without Overwrite
Total Return               (7.40)    (6.24)   (5.58)    (4.69)   (3.55)   (2.16)    (0.47)     1.48       3.70   6.17    8.87    11.80    14.93    18.23     53.06
Total Return %             (6.9%)    (5.8%)   (5.2%)    (4.4%)   (3.3%)   (2.0%)    (0.4%)     1.4%       3.4%   5.7%    8.2%    11.0%    13.9%    16.9%     49.2%

Overwrite: Sell 20 $47.5 strike calls expiring on 3/18/06 @ $1.89 per call (32.8%   implied volatility)
Call Premium                3.78        3.78      3.78   3.78   3.78      3.78       3.78     3.78        3.78   3.78    3.78     3.78     3.78      3.78      3.78
Call Payoff                 0.00        0.00      0.00   0.00   0.00      0.00       0.00     0.00        0.00   0.00   (1.00)   (5.00)   (9.00)   (13.00)   (49.00)
Total Return              (5.52)       (4.36)   (3.70)  (2.81) (1.67)   (0.28)       1.41     3.37        5.58   8.05    9.75     8.68     7.81      7.11      5.94
Total Return %            (5.1%)       (4.0%)   (3.4%) (2.6%)  (1.5%)   (0.3%)       1.3%     3.1%        5.2%   7.5%    9.0%     8.1%     7.2%      6.6%      5.5%

Overwrite: Sell 10 $47.5 strike calls expiring on 3/18/06 @ $1.89 per call (32.8% implied volatility)
Call Premium                1.89        1.89      1.89   1.89   1.89      1.89     1.89     1.89          1.89   1.89    1.89     1.89     1.89     1.89       1.89
Call Payoff                 0.00        0.00      0.00   0.00   0.00      0.00     0.00     0.00          0.00   0.00   (0.50)   (2.50)   (4.50)   (6.50)    (24.50)
Total Return              (7.41)       (6.25)   (5.59)  (4.70) (3.56)   (2.17)    (0.48)    1.48          3.69   6.16    8.36     9.29    10.42    11.72      28.55
Total Return %            (6.9%)       (5.8%)   (5.2%) (4.4%)  (3.3%)   (2.0%)   (0.4%)     1.4%          3.4%   5.7%    7.8%     8.6%     9.7%    10.9%      26.5%

Overwrite: Sell 20 $50.0 strike calls expiring on 3/18/06 @ $1.31 per call (32.6%   implied volatility)
Call Premium                2.62        2.62      2.62   2.62   2.62      2.62       2.62     2.62        2.62   2.62    2.62     2.62     2.62     2.62       2.62
Call Payoff                 0.00        0.00      0.00   0.00   0.00      0.00       0.00     0.00        0.00   0.00    0.00     0.00    (4.00)   (8.00)    (44.00)
Total Return              (6.68)       (5.52)   (4.86)  (3.97) (2.83)   (1.44)       0.25     2.21        4.42   6.89    9.59    12.52    11.65    10.95       9.78
Total Return %            (6.2%)       (5.1%)   (4.5%) (3.7%)  (2.6%)   (1.3%)       0.2%     2.0%        4.1%   6.4%    8.9%    11.6%    10.8%    10.2%       9.1%

Overwrite: Sell 10 $50.0 strike calls expiring on 3/18/06 @ $1.31 per call (32.6% implied volatility)
Call Premium                1.31        1.31      1.31   1.31   1.31      1.31     1.31     1.31          1.31   1.31    1.31     1.31     1.31     1.31       1.31
Call Payoff                 0.00        0.00      0.00   0.00   0.00      0.00     0.00     0.00          0.00   0.00    0.00     0.00    (2.00)   (4.00)    (22.00)
Total Return              (7.99)       (6.83)   (6.17)  (5.28) (4.14)   (2.75)    (1.06)    0.90          3.11   5.58    8.28    11.21    12.34    13.64      30.47
Total Return %            (7.4%)       (6.3%)   (5.7%) (4.9%)  (3.8%)   (2.6%)   (1.0%)     0.8%          2.9%   5.2%    7.7%    10.4%    11.5%    12.7%      28.3%

Source: Lehman Brothers


                                                                                                                                    October 12, 2005                   5
Best Buy 2.25% due 01/15/22 with Call Overwrites


Figure 5: Long Term Horizon (1/15/07) - Long 1 BBY 2.25% Convert with Call Overwrites
Horizon Stock Price           $12       $30     $32     $34     $36          $38      $40      $42        $44      $46     $48      $50      $52       $54       $72
Stock Price % Chg          (71.4%)   (28.6%) (23.8%) (19.0%) (14.3%)       (9.5%)   (4.8%)     0.0%       4.8%     9.5%   14.3%    19.0%    23.8%     28.6%     71.4%

Estimated Cvt Px           100.00    100.00 100.00 100.00 100.00 100.08 101.62 103.45 105.37 107.37 109.45 111.63 113.97 117.43                                 156.53
Px Return                   (7.75)    (7.75) (7.75) (7.75) (7.75) (7.67) (6.13) (4.30) (2.38) (0.38)  1.70   3.88   6.22   9.68                                  48.78
Cpn Return                   2.88      2.88   2.88   2.88   2.88   2.88   2.88   2.88   2.88   2.88   2.88   2.88   2.88   2.88                                   2.88

Without Overwrite
Total Return                (4.87)    (4.87)   (4.87)    (4.87)   (4.87)   (4.79)   (3.25)    (1.42)      0.50     2.50    4.58     6.76      9.10    12.56     51.65
Total Return %              (4.5%)    (4.5%)   (4.5%)    (4.5%)   (4.5%)   (4.4%)   (3.0%)    (1.3%)      0.5%     2.3%    4.2%     6.3%      8.4%    11.7%     47.9%

Overwrite: Sell 20 $46.625 strike calls expiring on 1/20/07 @ $4.69 per    call (30.6% implied volatility)
Call Premium              9.37         9.37      9.37   9.37    9.37       9.37      9.37     9.37         9.37    9.37    9.37     9.37      9.37      9.37      9.37
Call Payoff               0.00         0.00      0.00   0.00    0.00       0.00      0.00     0.00         0.00    0.00   (2.75)   (6.75)   (10.75)   (14.75)   (50.75)
Total Return              4.50         4.50      4.50   4.50    4.50       4.58      6.12     7.95         9.87   11.87   11.20     9.38      7.72      7.18     10.28
Total Return %            4.2%         4.2%      4.2%   4.2%   4.2%        4.3%      5.7%     7.4%         9.2%   11.0%   10.4%     8.7%      7.2%      6.7%      9.5%

Overwrite: Sell 10 $46.625 strike calls expiring on 1/20/07 @ $4.69 per call (30.6% implied volatility)
Call Premium              4.69         4.69      4.69    4.69   4.69    4.69      4.69     4.69         4.69       4.69    4.69     4.69      4.69      4.69      4.69
Call Payoff               0.00         0.00      0.00    0.00   0.00    0.00      0.00     0.00         0.00       0.00   (1.38)   (3.38)    (5.38)    (7.38)   (25.38)
Total Return             (0.18)      (0.18)     (0.18)  (0.18) (0.18)  (0.10)     1.44     3.27         5.19       7.19    7.89     8.07      8.41      9.87     30.97
Total Return %           (0.2%)      (0.2%)     (0.2%) (0.2%)  (0.2%)  (0.1%)     1.3%     3.0%         4.8%       6.7%    7.3%     7.5%      7.8%      9.2%     28.7%

Overwrite: Sell 20 $50.0 strike calls expiring on 1/20/07 @ $3.66 per call (30.7%   implied volatility)
Call Premium                7.32        7.32      7.32  7.32    7.32      7.32       7.32     7.32        7.32     7.32    7.32     7.32     7.32      7.32       7.32
Call Payoff                 0.00        0.00      0.00  0.00    0.00      0.00       0.00     0.00        0.00     0.00    0.00     0.00    (4.00)    (8.00)    (44.00)
Total Return                2.45        2.45      2.45  2.45    2.45      2.53       4.07     5.90        7.82     9.82   11.90    14.08    12.42     11.88      14.97
Total Return %              2.3%        2.3%     2.3%   2.3%    2.3%      2.3%       3.8%     5.5%        7.3%     9.1%   11.0%    13.1%    11.5%     11.0%      13.9%

Overwrite: Sell 10 $50.0 strike calls expiring on 1/20/07 @ $3.66 per call (30.7%   implied volatility)
Call Premium                3.66        3.66      3.66   3.66   3.66      3.66       3.66     3.66        3.66     3.66    3.66     3.66     3.66      3.66       3.66
Call Payoff                 0.00        0.00      0.00   0.00   0.00      0.00       0.00     0.00        0.00     0.00    0.00     0.00    (2.00)    (4.00)    (22.00)
Total Return              (1.21)       (1.21)   (1.21)  (1.21) (1.21)   (1.13)       0.41     2.24        4.16     6.16    8.24    10.42    10.76     12.22      33.31
Total Return %            (1.1%)       (1.1%)   (1.1%) (1.1%)  (1.1%)   (1.0%)       0.4%     2.1%        3.9%     5.7%    7.6%     9.7%    10.0%     11.3%      30.9%

ySource: Lehman Brothers


                       Summary
                                                        Given their attractive risk-reward profile, the fact that the returns are computed on a holding-
                                                        period basis (not annualized) and the overall risk-averse, uncertain, low return expectation
                                                        macro environment that we are currently in, we believe these trades are attractive.


                                                        We suggest the following process to determine an optimal strategy:


                                                        First define the time horizon i.e. short term, medium term or a slightly longer term.


                                                        Second, arrive at a stock price estimate over the holding period. This will help in choosing
                                                        the appropriate overwrite strategy. For instance if investors feel that the stock is not likely to
                                                        rise above $47.50 over the holding period then they may consider writing calls with that
                                                        strike.


                                                        And third, determine the preference for income versus potential appreciation. If investors
                                                        prefer greater income and don’t mind giving up the upside beyond the call overwrite
                                                        threshold, they could potentially write more number of calls at lower strikes for each long
                                                        convert position.


  6                October 12, 2005
Best Buy 2.25% due 01/15/22 with Call Overwrites


While we believe that the risk in our suggested trades is rather limited there are some risk
factors that investors should be aware of. We have assumed that the convertible bond can
be sold in the secondary market at its theoretical value. If the bonds cheapen returns could
be lower. If the volatility of BBY decreases and/or credit spreads widen and/or interest
rates rise and/or BBY raises its common dividend, investors are likely to realize a lower
return than what is presented in our analysis. However, the relatively short dated 1.3 year
put on the bonds limits the effect of these risk factors.


In conclusion, we believe Best Buy’s convertible bonds overlaid with an overwrite strategy
present several defensive yet attractive trade alternatives in the current uncertain
environment. We believe these will appeal especially to investors looking for potential
upside in a highly risk controlled manner.


                                                                October 12, 2005          7
FOR CURRENT IMPORTANT DISCLOSURES REGARDING COMPANIES THAT ARE THE
                          SUBJECT OF THIS RESEARCH REPORT, PLEASE SEND A WRITTEN REQUEST TO:
                                           LEHMAN BROTHERS CONTROL ROOM
                                            745 SEVENTH AVENUE, 19TH FLOOR
                                                  NEW YORK, NY 10019
                                                          OR
                          REFER TO THE FIRM'S DISCLOSURE WEBSITE AT www.lehman.com/disclosures
Important Disclosures:
The analysts responsible for preparing this report have received compensation based upon various factors including the Firm’s total revenues, a portion of which is generated by investment banking activities.

Convertibles Risk Disclosure(s):

The convertible valuations are based on Lehman’s proprietary convertible valuation model, under which key assumptions relate to credit spread and volatility metrics. Material changes in any of these variables can
have a significant impact on valuation. Upside/downside analysis takes into consideration likely future valuation and expected trading patterns, among others. It is based on a total return participation of the
convertible relative to a +/- 25% change in the common stock’s price over a one-year investment horizon. A material change in the company’s financial situation can significantly alter this assessment.

Mentioned Stocks

Best Buy (BBY - USD41.86) 1-Overweight / Positive J/K/M
Risks Which May Impede the Achievement of the Price Target: 1. If Circuit City is promotional, Best Buy's sales and earnings could be negatively impacted. 2. If problems arise with the integration of Future Shop,
Best Buy's earnings could be negatively impacted. 3. If prerecorded music sales decline, Best Buy's sales could be negatively affected.

Disclosure Legend:
J: Lehman Brothers Inc. or an affiliate trade(s) regularly in the shares of the subject company.
K: Lehman Brothers Inc. has received non-investment banking related compensation from the subject company within the last 12 months.
M: The subject company is or during the last 12 months has been a non-investment banking client (securities related services) of Lehman Brothers Inc.

Valuation Methodology:
BBY shares currently trade at 19.5x and 16.5x our 2005 and 2006 EPS estimates of $2.18 and $2.58 (including $0.11 of options expense), respectively. Our 12-month price target of $57 is based on a multiple
of 22x our 2006 estimate. The shares currently trade at an 8% premium to the S&P 500, based on our 2006 estimate, having traded between a 34% discount and a 40% premium to the S&P 500 over the past
five years. We maintain our 1-Overweight rating on the shares, as we believe the potential exists for BBY shares to outperform the unweighted expected total return of the retail industry over the next 12 months.

Guide to Lehman Brothers Equity Research Rating System:
Our coverage analysts use a relative rating system in which they rate stocks as 1-Overweight, 2- Equal weight or 3-Underweight (see definitions below) relative to other companies covered by the analyst or a team
of analysts that are deemed to be in the same industry sector (“the sector coverage universe”). To see a list of companies that comprise a particular sector coverage universe, please go to
www.lehman.com/disclosures.
In addition to the stock rating, we provide sector views which rate the outlook for the sector coverage universe as 1-Positive, 2-Neutral or 3-Negative (see definitions below). A rating system using terms such as buy,
hold and sell is not the equivalent of our rating system. Investors should carefully read the entire research report including the definitions of all ratings and not infer its contents from ratings alone.

Stock Rating
1-Overweight - The stock is expected to outperform the unweighted expected total return of the sector coverage universe over a 12-month investment horizon.
2-Equal weight - The stock is expected to perform in line with the unweighted expected total return of the sector coverage universe over a 12-month investment horizon.
3-Underweight - The stock is expected to underperform the unweighted expected total return of the sector coverage universe over a 12-month investment horizon.
RS-Rating Suspended - The rating and target price have been suspended temporarily to comply with applicable regulations and/or firm policies in certain circumstances including when Lehman Brothers is acting in an
advisory capacity on a merger or strategic transaction involving the company.

Sector View
1-Positive - sector coverage universe fundamentals are improving.
2-Neutral - sector coverage universe fundamentals are steady, neither improving nor deteriorating.
3-Negative - sector coverage universe fundamentals are deteriorating.

Distribution of Ratings:
Lehman Brothers Equity Research has 1758 companies under coverage.
42% have been assigned a 1-Overweight rating which, for purposes of mandatory disclosures, is classified as a Buy rating, 35% of companies with this rating are investment banking clients of the Firm.
41% have been assigned a 2-Equal weight rating which, for purposes of mandatory disclosures, is classified as a Hold rating, 7% of companies with this rating are investment banking clients of the Firm.
17% have been assigned a 3-Underweight rating which, for purposes of mandatory disclosures, is classified as a Sell rating, 84% of companies with this rating are investment banking clients of the Firm.

This material has been prepared and/or issued by Lehman Brothers Inc., member SIPC, and/or one of its affiliates (“Lehman Brothers”) and has been approved by Lehman Brothers International (Europe),
authorised and regulated by the Financial Services Authority, in connection with its distribution in the European Economic Area. This material is distributed in Japan by Lehman Brothers Japan Inc., and in Hong Kong
by Lehman Brothers Asia Limited. This material is distributed in Australia by Lehman Brothers Australia Pty Limited, and in Singapore by Lehman Brothers Inc., Singapore Branch (“LBIS”). Where this material is
distributed by LBIS, please note that it is intended for general circulation only and the recommendations contained herein does not take into account the specific investment objectives, financial situation or particular
needs of any particular person. An investor should consult his Lehman Brothers’ representative regarding the suitability of the product and take into account his specific investment objectives, financial situation or
particular needs before he makes a commitment to purchase the investment product. This material is distributed in Korea by Lehman Brothers International (Europe) Seoul Branch. This document is for information
purposes only and it should not be regarded as an offer to sell or as a solicitation of an offer to buy the securities or other instruments mentioned in it. No part of this document may be reproduced in any manner
without the written permission of Lehman Brothers. With the exception of disclosures relating to Lehman Brothers, this research report is based on current public information that Lehman Brothers considers reliable,
but we make no representation that it is accurate or complete, and it should not be relied on as such. In the case of any disclosure to the effect that Lehman Brothers Inc. or its affiliates beneficially own 1% or more
of any class of common equity securities of the subject company, the computation of beneficial ownership of securities is based upon the methodology used to compute ownership under Section 13(d) of the United
States' Securities Exchange Act of 1934. In the case of any disclosure to the effect that Lehman Brothers Inc. and/or its affiliates hold a short position of at least 1% of the outstanding share capital of a particular
company, such disclosure relates solely to the ordinary share capital of the company. Accordingly, while such calculation represents Lehman Brothers’ holdings net of any long position in the ordinary share capital of
the company, such calculation excludes any rights or obligations that Lehman Brothers may otherwise have, or which may accrue in the future, with respect to such ordinary share capital. Similarly such calculation
Best Buy 2.25% due 01/15/22 with Call Overwrites


does not include any shares held or owned by Lehman Brothers where such shares are held under a wider agreement or arrangement (be it with a client or a counterparty) concerning the shares of such company
(e.g. prime broking and/or stock lending activity). Any such disclosure represents the position of Lehman Brothers as of the last business day of the calendar month preceding the date of this report.

This material is provided with the understanding that Lehman Brothers is not acting in a fiduciary capacity. Opinions expressed herein reflect the opinion of Lehman Brothers and are subject to change without notice.
The products mentioned in this document may not be eligible for sale in some states or countries, and they may not be suitable for all types of investors. If an investor has any doubts about product suitability, he
should consult his Lehman Brothers representative. The value of and the income produced by products may fluctuate, so that an investor may get back less than he invested. Value and income may be adversely
affected by exchange rates, interest rates, or other factors. Past performance is not necessarily indicative of future results. If a product is income producing, part of the capital invested may be used to pay that
income. © 2005 Lehman Brothers. All rights reserved. Additional information is available on request. Please contact a Lehman Brothers entity in your home jurisdiction.

Complete disclosure information on companies covered by Lehman Brothers Equity Research is available at www.lehman.com/disclosures.


                                                                                                              October 12, 2005                                9

More Related Content

What's hot

Structural - FDIC Insured Deposits
Structural - FDIC Insured DepositsStructural - FDIC Insured Deposits
Structural - FDIC Insured Depositsmattpollock
 
2009 Appvd Managed Futures Power Point
2009 Appvd Managed Futures Power Point2009 Appvd Managed Futures Power Point
2009 Appvd Managed Futures Power Point
jwestfield
 
Managed Futures Presentation
Managed Futures PresentationManaged Futures Presentation
Managed Futures PresentationEveryDayFX
 
Advice for the wise september 2012
Advice for the wise september 2012Advice for the wise september 2012
Advice for the wise september 2012Karvy Private Wealth
 
Case study of a comprehensive risk analysis for an asset manager
Case study of a comprehensive risk analysis for an asset managerCase study of a comprehensive risk analysis for an asset manager
Case study of a comprehensive risk analysis for an asset manager
Gateway Partners
 
[EN] The use of convertible bonds in the asset allocation process
[EN] The use of convertible bonds in the asset allocation process[EN] The use of convertible bonds in the asset allocation process
[EN] The use of convertible bonds in the asset allocation process
NN Investment Partners
 
[EN] Convertible bonds offer investors equity-like returns with a risk profil...
[EN] Convertible bonds offer investors equity-like returns with a risk profil...[EN] Convertible bonds offer investors equity-like returns with a risk profil...
[EN] Convertible bonds offer investors equity-like returns with a risk profil...
NN Investment Partners
 

What's hot (12)

Structural - FDIC Insured Deposits
Structural - FDIC Insured DepositsStructural - FDIC Insured Deposits
Structural - FDIC Insured Deposits
 
2009 Appvd Managed Futures Power Point
2009 Appvd Managed Futures Power Point2009 Appvd Managed Futures Power Point
2009 Appvd Managed Futures Power Point
 
Managed Futures Presentation
Managed Futures PresentationManaged Futures Presentation
Managed Futures Presentation
 
Sharemaeket
SharemaeketSharemaeket
Sharemaeket
 
Advice for the Wise April 2012
Advice for the Wise April 2012Advice for the Wise April 2012
Advice for the Wise April 2012
 
Advice for the wise september 2012
Advice for the wise september 2012Advice for the wise september 2012
Advice for the wise september 2012
 
Advice for the_wise-may_2012
Advice for the_wise-may_2012Advice for the_wise-may_2012
Advice for the_wise-may_2012
 
Case study of a comprehensive risk analysis for an asset manager
Case study of a comprehensive risk analysis for an asset managerCase study of a comprehensive risk analysis for an asset manager
Case study of a comprehensive risk analysis for an asset manager
 
[EN] The use of convertible bonds in the asset allocation process
[EN] The use of convertible bonds in the asset allocation process[EN] The use of convertible bonds in the asset allocation process
[EN] The use of convertible bonds in the asset allocation process
 
Advice for the wise October 2012
Advice for the wise October 2012Advice for the wise October 2012
Advice for the wise October 2012
 
Advice for the wise June 2012
Advice for the wise June 2012Advice for the wise June 2012
Advice for the wise June 2012
 
[EN] Convertible bonds offer investors equity-like returns with a risk profil...
[EN] Convertible bonds offer investors equity-like returns with a risk profil...[EN] Convertible bonds offer investors equity-like returns with a risk profil...
[EN] Convertible bonds offer investors equity-like returns with a risk profil...
 

Viewers also liked

Quantitative Methods for Counterparty Risk
Quantitative Methods for Counterparty RiskQuantitative Methods for Counterparty Risk
Quantitative Methods for Counterparty Risk
Volatility
 
Implied volatility explanation
Implied volatility explanationImplied volatility explanation
Implied volatility explanation
Zahid Khawaja
 
Realized and implied index skews, jumps, and the failure of the minimum-varia...
Realized and implied index skews, jumps, and the failure of the minimum-varia...Realized and implied index skews, jumps, and the failure of the minimum-varia...
Realized and implied index skews, jumps, and the failure of the minimum-varia...
Volatility
 
Consistently Modeling Joint Dynamics of Volatility and Underlying To Enable E...
Consistently Modeling Joint Dynamics of Volatility and Underlying To Enable E...Consistently Modeling Joint Dynamics of Volatility and Underlying To Enable E...
Consistently Modeling Joint Dynamics of Volatility and Underlying To Enable E...
Volatility
 
Volatility arbitrage
Volatility arbitrageVolatility arbitrage
Volatility arbitrage
jy Torres
 
Stochastic Local Volatility Models: Theory and Implementation
Stochastic Local Volatility Models: Theory and ImplementationStochastic Local Volatility Models: Theory and Implementation
Stochastic Local Volatility Models: Theory and Implementation
Volatility
 
Style-Oriented Option Investing - Value vs. Growth?
Style-Oriented Option Investing - Value vs. Growth?Style-Oriented Option Investing - Value vs. Growth?
Style-Oriented Option Investing - Value vs. Growth?
RYAN RENICKER
 
The Lehman Brothers Volatility Screening Tool
The Lehman Brothers Volatility Screening ToolThe Lehman Brothers Volatility Screening Tool
The Lehman Brothers Volatility Screening Tool
RYAN RENICKER
 
Short Variance Swap Strategies on the S&P 500 Index Profitable, Yet Risky
Short Variance Swap Strategies on the S&P 500 Index Profitable, Yet RiskyShort Variance Swap Strategies on the S&P 500 Index Profitable, Yet Risky
Short Variance Swap Strategies on the S&P 500 Index Profitable, Yet Risky
RYAN RENICKER
 
ImperialMathFinance: Finance and Stochastics Seminar
ImperialMathFinance: Finance and Stochastics SeminarImperialMathFinance: Finance and Stochastics Seminar
ImperialMathFinance: Finance and Stochastics Seminarelviszhang
 
Uncertain Volatility Models
Uncertain Volatility ModelsUncertain Volatility Models
Uncertain Volatility Models
Swati Mital
 
Pricing Exotics using Change of Numeraire
Pricing Exotics using Change of NumerairePricing Exotics using Change of Numeraire
Pricing Exotics using Change of Numeraire
Swati Mital
 
Stochastic Vol Forecasting
Stochastic Vol ForecastingStochastic Vol Forecasting
Stochastic Vol Forecasting
Swati Mital
 
Efficient Numerical PDE Methods to Solve Calibration and Pricing Problems in ...
Efficient Numerical PDE Methods to Solve Calibration and Pricing Problems in ...Efficient Numerical PDE Methods to Solve Calibration and Pricing Problems in ...
Efficient Numerical PDE Methods to Solve Calibration and Pricing Problems in ...
Volatility
 
Volatility Trading - Hedge Fund Strategies
Volatility Trading - Hedge Fund StrategiesVolatility Trading - Hedge Fund Strategies
Volatility Trading - Hedge Fund Strategies
Hedge Fund South Africa
 
An Approximate Distribution of Delta-Hedging Errors in a Jump-Diffusion Model...
An Approximate Distribution of Delta-Hedging Errors in a Jump-Diffusion Model...An Approximate Distribution of Delta-Hedging Errors in a Jump-Diffusion Model...
An Approximate Distribution of Delta-Hedging Errors in a Jump-Diffusion Model...
Volatility
 
IFRS 9 Instrument financier
IFRS 9 Instrument financierIFRS 9 Instrument financier
IFRS 9 Instrument financier
Melek Sellami
 
Achieving Consistent Modeling Of VIX and Equities Derivatives
Achieving Consistent Modeling Of VIX and Equities DerivativesAchieving Consistent Modeling Of VIX and Equities Derivatives
Achieving Consistent Modeling Of VIX and Equities Derivatives
Volatility
 
Relative Value Volatility & Dynamic Hedging
Relative Value Volatility & Dynamic HedgingRelative Value Volatility & Dynamic Hedging
Relative Value Volatility & Dynamic Hedging
David Hamilton
 
Local and Stochastic volatility
Local and Stochastic volatilityLocal and Stochastic volatility
Local and Stochastic volatility
Swati Mital
 

Viewers also liked (20)

Quantitative Methods for Counterparty Risk
Quantitative Methods for Counterparty RiskQuantitative Methods for Counterparty Risk
Quantitative Methods for Counterparty Risk
 
Implied volatility explanation
Implied volatility explanationImplied volatility explanation
Implied volatility explanation
 
Realized and implied index skews, jumps, and the failure of the minimum-varia...
Realized and implied index skews, jumps, and the failure of the minimum-varia...Realized and implied index skews, jumps, and the failure of the minimum-varia...
Realized and implied index skews, jumps, and the failure of the minimum-varia...
 
Consistently Modeling Joint Dynamics of Volatility and Underlying To Enable E...
Consistently Modeling Joint Dynamics of Volatility and Underlying To Enable E...Consistently Modeling Joint Dynamics of Volatility and Underlying To Enable E...
Consistently Modeling Joint Dynamics of Volatility and Underlying To Enable E...
 
Volatility arbitrage
Volatility arbitrageVolatility arbitrage
Volatility arbitrage
 
Stochastic Local Volatility Models: Theory and Implementation
Stochastic Local Volatility Models: Theory and ImplementationStochastic Local Volatility Models: Theory and Implementation
Stochastic Local Volatility Models: Theory and Implementation
 
Style-Oriented Option Investing - Value vs. Growth?
Style-Oriented Option Investing - Value vs. Growth?Style-Oriented Option Investing - Value vs. Growth?
Style-Oriented Option Investing - Value vs. Growth?
 
The Lehman Brothers Volatility Screening Tool
The Lehman Brothers Volatility Screening ToolThe Lehman Brothers Volatility Screening Tool
The Lehman Brothers Volatility Screening Tool
 
Short Variance Swap Strategies on the S&P 500 Index Profitable, Yet Risky
Short Variance Swap Strategies on the S&P 500 Index Profitable, Yet RiskyShort Variance Swap Strategies on the S&P 500 Index Profitable, Yet Risky
Short Variance Swap Strategies on the S&P 500 Index Profitable, Yet Risky
 
ImperialMathFinance: Finance and Stochastics Seminar
ImperialMathFinance: Finance and Stochastics SeminarImperialMathFinance: Finance and Stochastics Seminar
ImperialMathFinance: Finance and Stochastics Seminar
 
Uncertain Volatility Models
Uncertain Volatility ModelsUncertain Volatility Models
Uncertain Volatility Models
 
Pricing Exotics using Change of Numeraire
Pricing Exotics using Change of NumerairePricing Exotics using Change of Numeraire
Pricing Exotics using Change of Numeraire
 
Stochastic Vol Forecasting
Stochastic Vol ForecastingStochastic Vol Forecasting
Stochastic Vol Forecasting
 
Efficient Numerical PDE Methods to Solve Calibration and Pricing Problems in ...
Efficient Numerical PDE Methods to Solve Calibration and Pricing Problems in ...Efficient Numerical PDE Methods to Solve Calibration and Pricing Problems in ...
Efficient Numerical PDE Methods to Solve Calibration and Pricing Problems in ...
 
Volatility Trading - Hedge Fund Strategies
Volatility Trading - Hedge Fund StrategiesVolatility Trading - Hedge Fund Strategies
Volatility Trading - Hedge Fund Strategies
 
An Approximate Distribution of Delta-Hedging Errors in a Jump-Diffusion Model...
An Approximate Distribution of Delta-Hedging Errors in a Jump-Diffusion Model...An Approximate Distribution of Delta-Hedging Errors in a Jump-Diffusion Model...
An Approximate Distribution of Delta-Hedging Errors in a Jump-Diffusion Model...
 
IFRS 9 Instrument financier
IFRS 9 Instrument financierIFRS 9 Instrument financier
IFRS 9 Instrument financier
 
Achieving Consistent Modeling Of VIX and Equities Derivatives
Achieving Consistent Modeling Of VIX and Equities DerivativesAchieving Consistent Modeling Of VIX and Equities Derivatives
Achieving Consistent Modeling Of VIX and Equities Derivatives
 
Relative Value Volatility & Dynamic Hedging
Relative Value Volatility & Dynamic HedgingRelative Value Volatility & Dynamic Hedging
Relative Value Volatility & Dynamic Hedging
 
Local and Stochastic volatility
Local and Stochastic volatilityLocal and Stochastic volatility
Local and Stochastic volatility
 

Similar to Convertible Bonds and Call Overwrites - 2007

Summerlin asset management
Summerlin asset managementSummerlin asset management
Summerlin asset management
johndorian555
 
Global Insight- Quality Check
Global Insight- Quality CheckGlobal Insight- Quality Check
Global Insight- Quality Check
David Apted
 
4272015Portfolio for Risk Tolerant InvestorsAn Intriguing Tr.docx
4272015Portfolio for Risk Tolerant InvestorsAn Intriguing Tr.docx4272015Portfolio for Risk Tolerant InvestorsAn Intriguing Tr.docx
4272015Portfolio for Risk Tolerant InvestorsAn Intriguing Tr.docx
gilbertkpeters11344
 
Asset Managers - Recession risks, Trust Banks & Asset Mgrs
Asset Managers - Recession risks, Trust Banks & Asset MgrsAsset Managers - Recession risks, Trust Banks & Asset Mgrs
Asset Managers - Recession risks, Trust Banks & Asset Mgrs
Kevin Cheng, CFA
 
Cbli 2011 05 25 barda
Cbli 2011 05 25 bardaCbli 2011 05 25 barda
Cbli 2011 05 25 barda
James Hilbert
 
EBook A Guide to Fixed Index Annuities_2.pdf
EBook A Guide to Fixed Index Annuities_2.pdfEBook A Guide to Fixed Index Annuities_2.pdf
EBook A Guide to Fixed Index Annuities_2.pdf
Al Bruce
 
Asset intensive reinsurance_valact_ayer_083115_final
Asset intensive reinsurance_valact_ayer_083115_finalAsset intensive reinsurance_valact_ayer_083115_final
Asset intensive reinsurance_valact_ayer_083115_final
Amit Ayer
 
[LATAM EN] Convertible bonds offer investors equity-like returns with a risk ...
[LATAM EN] Convertible bonds offer investors equity-like returns with a risk ...[LATAM EN] Convertible bonds offer investors equity-like returns with a risk ...
[LATAM EN] Convertible bonds offer investors equity-like returns with a risk ...
NN Investment Partners
 
[CH] Convertible bonds offer investors equity-like returns with a risk profil...
[CH] Convertible bonds offer investors equity-like returns with a risk profil...[CH] Convertible bonds offer investors equity-like returns with a risk profil...
[CH] Convertible bonds offer investors equity-like returns with a risk profil...
NN Investment Partners
 
[LU] Focuspoint / Convertible bonds offer investors equity-like returns with ...
[LU] Focuspoint / Convertible bonds offer investors equity-like returns with ...[LU] Focuspoint / Convertible bonds offer investors equity-like returns with ...
[LU] Focuspoint / Convertible bonds offer investors equity-like returns with ...
NN Investment Partners
 
[UK] Convertible bonds offer investors equity-like returns with a risk profil...
[UK] Convertible bonds offer investors equity-like returns with a risk profil...[UK] Convertible bonds offer investors equity-like returns with a risk profil...
[UK] Convertible bonds offer investors equity-like returns with a risk profil...
NN Investment Partners
 
[JP] Convertible bonds offer investors equity-like returns with a risk profil...
[JP] Convertible bonds offer investors equity-like returns with a risk profil...[JP] Convertible bonds offer investors equity-like returns with a risk profil...
[JP] Convertible bonds offer investors equity-like returns with a risk profil...
NN Investment Partners
 
Portfolio Analysis and Construction
Portfolio Analysis and ConstructionPortfolio Analysis and Construction
Portfolio Analysis and Construction
Algoix Technologies LLP
 
Roche holding AG: Genentech Acquisition
Roche holding AG: Genentech AcquisitionRoche holding AG: Genentech Acquisition
Roche holding AG: Genentech Acquisition
Amara Fatima
 
Investment Insights for November 2017
Investment Insights for November 2017Investment Insights for November 2017
Investment Insights for November 2017
Cornerstone Wealth Management MWP
 
Fixed income primer 0607 (2016_01_25 03_57_23 UTC)
Fixed income primer 0607 (2016_01_25 03_57_23 UTC)Fixed income primer 0607 (2016_01_25 03_57_23 UTC)
Fixed income primer 0607 (2016_01_25 03_57_23 UTC)Gordon R. Schonfeld, CFA
 
Bond investment choices
Bond investment choicesBond investment choices
Bond investment choices
A.W. Berry
 
Putnam Global Income Trust Q&A Q2 2013
Putnam Global Income Trust Q&A Q2 2013Putnam Global Income Trust Q&A Q2 2013
Putnam Global Income Trust Q&A Q2 2013
Putnam Investments
 
Finance Final Power Point
Finance Final Power PointFinance Final Power Point
Finance Final Power Point
Brian DeMontfort
 

Similar to Convertible Bonds and Call Overwrites - 2007 (20)

Summerlin asset management
Summerlin asset managementSummerlin asset management
Summerlin asset management
 
Global Insight- Quality Check
Global Insight- Quality CheckGlobal Insight- Quality Check
Global Insight- Quality Check
 
Callable Bond Strategy
Callable Bond StrategyCallable Bond Strategy
Callable Bond Strategy
 
4272015Portfolio for Risk Tolerant InvestorsAn Intriguing Tr.docx
4272015Portfolio for Risk Tolerant InvestorsAn Intriguing Tr.docx4272015Portfolio for Risk Tolerant InvestorsAn Intriguing Tr.docx
4272015Portfolio for Risk Tolerant InvestorsAn Intriguing Tr.docx
 
Asset Managers - Recession risks, Trust Banks & Asset Mgrs
Asset Managers - Recession risks, Trust Banks & Asset MgrsAsset Managers - Recession risks, Trust Banks & Asset Mgrs
Asset Managers - Recession risks, Trust Banks & Asset Mgrs
 
Cbli 2011 05 25 barda
Cbli 2011 05 25 bardaCbli 2011 05 25 barda
Cbli 2011 05 25 barda
 
EBook A Guide to Fixed Index Annuities_2.pdf
EBook A Guide to Fixed Index Annuities_2.pdfEBook A Guide to Fixed Index Annuities_2.pdf
EBook A Guide to Fixed Index Annuities_2.pdf
 
Asset intensive reinsurance_valact_ayer_083115_final
Asset intensive reinsurance_valact_ayer_083115_finalAsset intensive reinsurance_valact_ayer_083115_final
Asset intensive reinsurance_valact_ayer_083115_final
 
[LATAM EN] Convertible bonds offer investors equity-like returns with a risk ...
[LATAM EN] Convertible bonds offer investors equity-like returns with a risk ...[LATAM EN] Convertible bonds offer investors equity-like returns with a risk ...
[LATAM EN] Convertible bonds offer investors equity-like returns with a risk ...
 
[CH] Convertible bonds offer investors equity-like returns with a risk profil...
[CH] Convertible bonds offer investors equity-like returns with a risk profil...[CH] Convertible bonds offer investors equity-like returns with a risk profil...
[CH] Convertible bonds offer investors equity-like returns with a risk profil...
 
[LU] Focuspoint / Convertible bonds offer investors equity-like returns with ...
[LU] Focuspoint / Convertible bonds offer investors equity-like returns with ...[LU] Focuspoint / Convertible bonds offer investors equity-like returns with ...
[LU] Focuspoint / Convertible bonds offer investors equity-like returns with ...
 
[UK] Convertible bonds offer investors equity-like returns with a risk profil...
[UK] Convertible bonds offer investors equity-like returns with a risk profil...[UK] Convertible bonds offer investors equity-like returns with a risk profil...
[UK] Convertible bonds offer investors equity-like returns with a risk profil...
 
[JP] Convertible bonds offer investors equity-like returns with a risk profil...
[JP] Convertible bonds offer investors equity-like returns with a risk profil...[JP] Convertible bonds offer investors equity-like returns with a risk profil...
[JP] Convertible bonds offer investors equity-like returns with a risk profil...
 
Portfolio Analysis and Construction
Portfolio Analysis and ConstructionPortfolio Analysis and Construction
Portfolio Analysis and Construction
 
Roche holding AG: Genentech Acquisition
Roche holding AG: Genentech AcquisitionRoche holding AG: Genentech Acquisition
Roche holding AG: Genentech Acquisition
 
Investment Insights for November 2017
Investment Insights for November 2017Investment Insights for November 2017
Investment Insights for November 2017
 
Fixed income primer 0607 (2016_01_25 03_57_23 UTC)
Fixed income primer 0607 (2016_01_25 03_57_23 UTC)Fixed income primer 0607 (2016_01_25 03_57_23 UTC)
Fixed income primer 0607 (2016_01_25 03_57_23 UTC)
 
Bond investment choices
Bond investment choicesBond investment choices
Bond investment choices
 
Putnam Global Income Trust Q&A Q2 2013
Putnam Global Income Trust Q&A Q2 2013Putnam Global Income Trust Q&A Q2 2013
Putnam Global Income Trust Q&A Q2 2013
 
Finance Final Power Point
Finance Final Power PointFinance Final Power Point
Finance Final Power Point
 

More from RYAN RENICKER

Various Media Citations - Ryan Renicker, CFA
Various Media Citations - Ryan Renicker, CFAVarious Media Citations - Ryan Renicker, CFA
Various Media Citations - Ryan Renicker, CFA
RYAN RENICKER
 
Options Trade Cheap Following Q2 Earnings - 2005
Options Trade Cheap Following Q2 Earnings - 2005Options Trade Cheap Following Q2 Earnings - 2005
Options Trade Cheap Following Q2 Earnings - 2005
RYAN RENICKER
 
Telecom / Media Overview - Buy-Write Google (GOOG)
Telecom / Media Overview - Buy-Write Google (GOOG)Telecom / Media Overview - Buy-Write Google (GOOG)
Telecom / Media Overview - Buy-Write Google (GOOG)
RYAN RENICKER
 
Equity Derivatives Strategy - A Stock Picker's Market?
Equity Derivatives Strategy - A Stock Picker's Market?Equity Derivatives Strategy - A Stock Picker's Market?
Equity Derivatives Strategy - A Stock Picker's Market?
RYAN RENICKER
 
Technology Stocks: A Stock Picker's Market?
Technology Stocks: A Stock Picker's Market?Technology Stocks: A Stock Picker's Market?
Technology Stocks: A Stock Picker's Market?
RYAN RENICKER
 
How to Strengthen Portfolio Returns as the Dollar Weakens!
How to Strengthen Portfolio Returns as the Dollar Weakens!How to Strengthen Portfolio Returns as the Dollar Weakens!
How to Strengthen Portfolio Returns as the Dollar Weakens!
RYAN RENICKER
 
SMH - Semiconductor Stock Options Cheap Despite CATALYSTS AHEAD!
SMH - Semiconductor Stock Options Cheap Despite CATALYSTS AHEAD!SMH - Semiconductor Stock Options Cheap Despite CATALYSTS AHEAD!
SMH - Semiconductor Stock Options Cheap Despite CATALYSTS AHEAD!
RYAN RENICKER
 
Stock Options on ANF and GPS - The Market's Expectation for Same-Store Sales
Stock Options on ANF and GPS - The Market's Expectation for Same-Store SalesStock Options on ANF and GPS - The Market's Expectation for Same-Store Sales
Stock Options on ANF and GPS - The Market's Expectation for Same-Store Sales
RYAN RENICKER
 
Option Strategies for Power and Utilities Industries
Option Strategies for Power and Utilities IndustriesOption Strategies for Power and Utilities Industries
Option Strategies for Power and Utilities Industries
RYAN RENICKER
 
Options Strategy Monthly - 2006 - Low Volatility in the 7th Inning? Housing M...
Options Strategy Monthly - 2006 - Low Volatility in the 7th Inning? Housing M...Options Strategy Monthly - 2006 - Low Volatility in the 7th Inning? Housing M...
Options Strategy Monthly - 2006 - Low Volatility in the 7th Inning? Housing M...
RYAN RENICKER
 
Pinning of Stock Prices on Expiration Date - Equity Options
Pinning of Stock Prices on Expiration Date - Equity OptionsPinning of Stock Prices on Expiration Date - Equity Options
Pinning of Stock Prices on Expiration Date - Equity Options
RYAN RENICKER
 
The Risk and Return of the Buy Write Strategy On The Russell 2000 Index
The Risk and Return of the Buy Write Strategy On The Russell 2000 IndexThe Risk and Return of the Buy Write Strategy On The Russell 2000 Index
The Risk and Return of the Buy Write Strategy On The Russell 2000 Index
RYAN RENICKER
 
Option Strategies - Natural Gas Trading Opportunities
Option Strategies - Natural Gas Trading OpportunitiesOption Strategies - Natural Gas Trading Opportunities
Option Strategies - Natural Gas Trading Opportunities
RYAN RENICKER
 
McDonald's Options are Trading Rich - Super Sized Volatility
McDonald's Options are Trading Rich - Super Sized VolatilityMcDonald's Options are Trading Rich - Super Sized Volatility
McDonald's Options are Trading Rich - Super Sized Volatility
RYAN RENICKER
 
Career and Job-Search Bibliography - Compiled by Richard Greene
Career and Job-Search Bibliography - Compiled by Richard GreeneCareer and Job-Search Bibliography - Compiled by Richard Greene
Career and Job-Search Bibliography - Compiled by Richard Greene
RYAN RENICKER
 
Option Implied Volatility for Small Cap Stocks
Option Implied Volatility for Small Cap StocksOption Implied Volatility for Small Cap Stocks
Option Implied Volatility for Small Cap Stocks
RYAN RENICKER
 
Collar Strategies - Not Hedged - Profitable but Also Risky
Collar Strategies - Not Hedged - Profitable but Also RiskyCollar Strategies - Not Hedged - Profitable but Also Risky
Collar Strategies - Not Hedged - Profitable but Also Risky
RYAN RENICKER
 
Risk Premium in Options for the Energy Sector
Risk Premium in Options for the Energy SectorRisk Premium in Options for the Energy Sector
Risk Premium in Options for the Energy Sector
RYAN RENICKER
 
Stock Market Indices Trading in a Very Narrow Trading Range
Stock Market Indices Trading in a Very Narrow Trading RangeStock Market Indices Trading in a Very Narrow Trading Range
Stock Market Indices Trading in a Very Narrow Trading Range
RYAN RENICKER
 
Weakening the Case for a "Summer Volatility Crush"
Weakening the Case for a "Summer Volatility Crush"Weakening the Case for a "Summer Volatility Crush"
Weakening the Case for a "Summer Volatility Crush"
RYAN RENICKER
 

More from RYAN RENICKER (20)

Various Media Citations - Ryan Renicker, CFA
Various Media Citations - Ryan Renicker, CFAVarious Media Citations - Ryan Renicker, CFA
Various Media Citations - Ryan Renicker, CFA
 
Options Trade Cheap Following Q2 Earnings - 2005
Options Trade Cheap Following Q2 Earnings - 2005Options Trade Cheap Following Q2 Earnings - 2005
Options Trade Cheap Following Q2 Earnings - 2005
 
Telecom / Media Overview - Buy-Write Google (GOOG)
Telecom / Media Overview - Buy-Write Google (GOOG)Telecom / Media Overview - Buy-Write Google (GOOG)
Telecom / Media Overview - Buy-Write Google (GOOG)
 
Equity Derivatives Strategy - A Stock Picker's Market?
Equity Derivatives Strategy - A Stock Picker's Market?Equity Derivatives Strategy - A Stock Picker's Market?
Equity Derivatives Strategy - A Stock Picker's Market?
 
Technology Stocks: A Stock Picker's Market?
Technology Stocks: A Stock Picker's Market?Technology Stocks: A Stock Picker's Market?
Technology Stocks: A Stock Picker's Market?
 
How to Strengthen Portfolio Returns as the Dollar Weakens!
How to Strengthen Portfolio Returns as the Dollar Weakens!How to Strengthen Portfolio Returns as the Dollar Weakens!
How to Strengthen Portfolio Returns as the Dollar Weakens!
 
SMH - Semiconductor Stock Options Cheap Despite CATALYSTS AHEAD!
SMH - Semiconductor Stock Options Cheap Despite CATALYSTS AHEAD!SMH - Semiconductor Stock Options Cheap Despite CATALYSTS AHEAD!
SMH - Semiconductor Stock Options Cheap Despite CATALYSTS AHEAD!
 
Stock Options on ANF and GPS - The Market's Expectation for Same-Store Sales
Stock Options on ANF and GPS - The Market's Expectation for Same-Store SalesStock Options on ANF and GPS - The Market's Expectation for Same-Store Sales
Stock Options on ANF and GPS - The Market's Expectation for Same-Store Sales
 
Option Strategies for Power and Utilities Industries
Option Strategies for Power and Utilities IndustriesOption Strategies for Power and Utilities Industries
Option Strategies for Power and Utilities Industries
 
Options Strategy Monthly - 2006 - Low Volatility in the 7th Inning? Housing M...
Options Strategy Monthly - 2006 - Low Volatility in the 7th Inning? Housing M...Options Strategy Monthly - 2006 - Low Volatility in the 7th Inning? Housing M...
Options Strategy Monthly - 2006 - Low Volatility in the 7th Inning? Housing M...
 
Pinning of Stock Prices on Expiration Date - Equity Options
Pinning of Stock Prices on Expiration Date - Equity OptionsPinning of Stock Prices on Expiration Date - Equity Options
Pinning of Stock Prices on Expiration Date - Equity Options
 
The Risk and Return of the Buy Write Strategy On The Russell 2000 Index
The Risk and Return of the Buy Write Strategy On The Russell 2000 IndexThe Risk and Return of the Buy Write Strategy On The Russell 2000 Index
The Risk and Return of the Buy Write Strategy On The Russell 2000 Index
 
Option Strategies - Natural Gas Trading Opportunities
Option Strategies - Natural Gas Trading OpportunitiesOption Strategies - Natural Gas Trading Opportunities
Option Strategies - Natural Gas Trading Opportunities
 
McDonald's Options are Trading Rich - Super Sized Volatility
McDonald's Options are Trading Rich - Super Sized VolatilityMcDonald's Options are Trading Rich - Super Sized Volatility
McDonald's Options are Trading Rich - Super Sized Volatility
 
Career and Job-Search Bibliography - Compiled by Richard Greene
Career and Job-Search Bibliography - Compiled by Richard GreeneCareer and Job-Search Bibliography - Compiled by Richard Greene
Career and Job-Search Bibliography - Compiled by Richard Greene
 
Option Implied Volatility for Small Cap Stocks
Option Implied Volatility for Small Cap StocksOption Implied Volatility for Small Cap Stocks
Option Implied Volatility for Small Cap Stocks
 
Collar Strategies - Not Hedged - Profitable but Also Risky
Collar Strategies - Not Hedged - Profitable but Also RiskyCollar Strategies - Not Hedged - Profitable but Also Risky
Collar Strategies - Not Hedged - Profitable but Also Risky
 
Risk Premium in Options for the Energy Sector
Risk Premium in Options for the Energy SectorRisk Premium in Options for the Energy Sector
Risk Premium in Options for the Energy Sector
 
Stock Market Indices Trading in a Very Narrow Trading Range
Stock Market Indices Trading in a Very Narrow Trading RangeStock Market Indices Trading in a Very Narrow Trading Range
Stock Market Indices Trading in a Very Narrow Trading Range
 
Weakening the Case for a "Summer Volatility Crush"
Weakening the Case for a "Summer Volatility Crush"Weakening the Case for a "Summer Volatility Crush"
Weakening the Case for a "Summer Volatility Crush"
 

Recently uploaded

Eco-Innovations and Firm Heterogeneity. Evidence from Italian Family and Nonf...
Eco-Innovations and Firm Heterogeneity.Evidence from Italian Family and Nonf...Eco-Innovations and Firm Heterogeneity.Evidence from Italian Family and Nonf...
Eco-Innovations and Firm Heterogeneity. Evidence from Italian Family and Nonf...
University of Calabria
 
Transkredit Finance Company Products Presentation (1).pptx
Transkredit Finance Company Products Presentation (1).pptxTranskredit Finance Company Products Presentation (1).pptx
Transkredit Finance Company Products Presentation (1).pptx
jenomjaneh
 
Seminar: Gender Board Diversity through Ownership Networks
Seminar: Gender Board Diversity through Ownership NetworksSeminar: Gender Board Diversity through Ownership Networks
Seminar: Gender Board Diversity through Ownership Networks
GRAPE
 
how to sell pi coins effectively (from 50 - 100k pi)
how to sell pi coins effectively (from 50 - 100k  pi)how to sell pi coins effectively (from 50 - 100k  pi)
how to sell pi coins effectively (from 50 - 100k pi)
DOT TECH
 
where can I find a legit pi merchant online
where can I find a legit pi merchant onlinewhere can I find a legit pi merchant online
where can I find a legit pi merchant online
DOT TECH
 
Patronage and Good Governance 5.pptx pptc
Patronage and Good Governance 5.pptx pptcPatronage and Good Governance 5.pptx pptc
Patronage and Good Governance 5.pptx pptc
AbdulNasirNichari
 
How Does CRISIL Evaluate Lenders in India for Credit Ratings
How Does CRISIL Evaluate Lenders in India for Credit RatingsHow Does CRISIL Evaluate Lenders in India for Credit Ratings
How Does CRISIL Evaluate Lenders in India for Credit Ratings
Shaheen Kumar
 
Instant Issue Debit Cards
Instant Issue Debit CardsInstant Issue Debit Cards
Instant Issue Debit Cards
egoetzinger
 
2. Elemental Economics - Mineral demand.pdf
2. Elemental Economics - Mineral demand.pdf2. Elemental Economics - Mineral demand.pdf
2. Elemental Economics - Mineral demand.pdf
Neal Brewster
 
The Role of Non-Banking Financial Companies (NBFCs)
The Role of Non-Banking Financial Companies (NBFCs)The Role of Non-Banking Financial Companies (NBFCs)
The Role of Non-Banking Financial Companies (NBFCs)
nickysharmasucks
 
Role of Information Technology in Revenue - Prof Oyedokun.pptx
Role of Information Technology in Revenue  - Prof Oyedokun.pptxRole of Information Technology in Revenue  - Prof Oyedokun.pptx
Role of Information Technology in Revenue - Prof Oyedokun.pptx
Godwin Emmanuel Oyedokun MBA MSc PhD FCA FCTI FCNA CFE FFAR
 
how to swap pi coins to foreign currency withdrawable.
how to swap pi coins to foreign currency withdrawable.how to swap pi coins to foreign currency withdrawable.
how to swap pi coins to foreign currency withdrawable.
DOT TECH
 
Which Crypto to Buy Today for Short-Term in May-June 2024.pdf
Which Crypto to Buy Today for Short-Term in May-June 2024.pdfWhich Crypto to Buy Today for Short-Term in May-June 2024.pdf
Which Crypto to Buy Today for Short-Term in May-June 2024.pdf
Kezex (KZX)
 
Earn a passive income with prosocial investing
Earn a passive income with prosocial investingEarn a passive income with prosocial investing
Earn a passive income with prosocial investing
Colin R. Turner
 
This assessment plan proposal is to outline a structured approach to evaluati...
This assessment plan proposal is to outline a structured approach to evaluati...This assessment plan proposal is to outline a structured approach to evaluati...
This assessment plan proposal is to outline a structured approach to evaluati...
lamluanvan.net Viết thuê luận văn
 
An Overview of the Prosocial dHEDGE Vault works
An Overview of the Prosocial dHEDGE Vault worksAn Overview of the Prosocial dHEDGE Vault works
An Overview of the Prosocial dHEDGE Vault works
Colin R. Turner
 
US Economic Outlook - Being Decided - M Capital Group August 2021.pdf
US Economic Outlook - Being Decided - M Capital Group August 2021.pdfUS Economic Outlook - Being Decided - M Capital Group August 2021.pdf
US Economic Outlook - Being Decided - M Capital Group August 2021.pdf
pchutichetpong
 
一比一原版(UCSB毕业证)圣芭芭拉分校毕业证如何办理
一比一原版(UCSB毕业证)圣芭芭拉分校毕业证如何办理一比一原版(UCSB毕业证)圣芭芭拉分校毕业证如何办理
一比一原版(UCSB毕业证)圣芭芭拉分校毕业证如何办理
bbeucd
 
innovative-invoice-discounting-platforms-in-india-empowering-retail-investors...
innovative-invoice-discounting-platforms-in-india-empowering-retail-investors...innovative-invoice-discounting-platforms-in-india-empowering-retail-investors...
innovative-invoice-discounting-platforms-in-india-empowering-retail-investors...
Falcon Invoice Discounting
 
Tumelo-deep-dive-into-pass-through-voting-Feb23 (1).pdf
Tumelo-deep-dive-into-pass-through-voting-Feb23 (1).pdfTumelo-deep-dive-into-pass-through-voting-Feb23 (1).pdf
Tumelo-deep-dive-into-pass-through-voting-Feb23 (1).pdf
Henry Tapper
 

Recently uploaded (20)

Eco-Innovations and Firm Heterogeneity. Evidence from Italian Family and Nonf...
Eco-Innovations and Firm Heterogeneity.Evidence from Italian Family and Nonf...Eco-Innovations and Firm Heterogeneity.Evidence from Italian Family and Nonf...
Eco-Innovations and Firm Heterogeneity. Evidence from Italian Family and Nonf...
 
Transkredit Finance Company Products Presentation (1).pptx
Transkredit Finance Company Products Presentation (1).pptxTranskredit Finance Company Products Presentation (1).pptx
Transkredit Finance Company Products Presentation (1).pptx
 
Seminar: Gender Board Diversity through Ownership Networks
Seminar: Gender Board Diversity through Ownership NetworksSeminar: Gender Board Diversity through Ownership Networks
Seminar: Gender Board Diversity through Ownership Networks
 
how to sell pi coins effectively (from 50 - 100k pi)
how to sell pi coins effectively (from 50 - 100k  pi)how to sell pi coins effectively (from 50 - 100k  pi)
how to sell pi coins effectively (from 50 - 100k pi)
 
where can I find a legit pi merchant online
where can I find a legit pi merchant onlinewhere can I find a legit pi merchant online
where can I find a legit pi merchant online
 
Patronage and Good Governance 5.pptx pptc
Patronage and Good Governance 5.pptx pptcPatronage and Good Governance 5.pptx pptc
Patronage and Good Governance 5.pptx pptc
 
How Does CRISIL Evaluate Lenders in India for Credit Ratings
How Does CRISIL Evaluate Lenders in India for Credit RatingsHow Does CRISIL Evaluate Lenders in India for Credit Ratings
How Does CRISIL Evaluate Lenders in India for Credit Ratings
 
Instant Issue Debit Cards
Instant Issue Debit CardsInstant Issue Debit Cards
Instant Issue Debit Cards
 
2. Elemental Economics - Mineral demand.pdf
2. Elemental Economics - Mineral demand.pdf2. Elemental Economics - Mineral demand.pdf
2. Elemental Economics - Mineral demand.pdf
 
The Role of Non-Banking Financial Companies (NBFCs)
The Role of Non-Banking Financial Companies (NBFCs)The Role of Non-Banking Financial Companies (NBFCs)
The Role of Non-Banking Financial Companies (NBFCs)
 
Role of Information Technology in Revenue - Prof Oyedokun.pptx
Role of Information Technology in Revenue  - Prof Oyedokun.pptxRole of Information Technology in Revenue  - Prof Oyedokun.pptx
Role of Information Technology in Revenue - Prof Oyedokun.pptx
 
how to swap pi coins to foreign currency withdrawable.
how to swap pi coins to foreign currency withdrawable.how to swap pi coins to foreign currency withdrawable.
how to swap pi coins to foreign currency withdrawable.
 
Which Crypto to Buy Today for Short-Term in May-June 2024.pdf
Which Crypto to Buy Today for Short-Term in May-June 2024.pdfWhich Crypto to Buy Today for Short-Term in May-June 2024.pdf
Which Crypto to Buy Today for Short-Term in May-June 2024.pdf
 
Earn a passive income with prosocial investing
Earn a passive income with prosocial investingEarn a passive income with prosocial investing
Earn a passive income with prosocial investing
 
This assessment plan proposal is to outline a structured approach to evaluati...
This assessment plan proposal is to outline a structured approach to evaluati...This assessment plan proposal is to outline a structured approach to evaluati...
This assessment plan proposal is to outline a structured approach to evaluati...
 
An Overview of the Prosocial dHEDGE Vault works
An Overview of the Prosocial dHEDGE Vault worksAn Overview of the Prosocial dHEDGE Vault works
An Overview of the Prosocial dHEDGE Vault works
 
US Economic Outlook - Being Decided - M Capital Group August 2021.pdf
US Economic Outlook - Being Decided - M Capital Group August 2021.pdfUS Economic Outlook - Being Decided - M Capital Group August 2021.pdf
US Economic Outlook - Being Decided - M Capital Group August 2021.pdf
 
一比一原版(UCSB毕业证)圣芭芭拉分校毕业证如何办理
一比一原版(UCSB毕业证)圣芭芭拉分校毕业证如何办理一比一原版(UCSB毕业证)圣芭芭拉分校毕业证如何办理
一比一原版(UCSB毕业证)圣芭芭拉分校毕业证如何办理
 
innovative-invoice-discounting-platforms-in-india-empowering-retail-investors...
innovative-invoice-discounting-platforms-in-india-empowering-retail-investors...innovative-invoice-discounting-platforms-in-india-empowering-retail-investors...
innovative-invoice-discounting-platforms-in-india-empowering-retail-investors...
 
Tumelo-deep-dive-into-pass-through-voting-Feb23 (1).pdf
Tumelo-deep-dive-into-pass-through-voting-Feb23 (1).pdfTumelo-deep-dive-into-pass-through-voting-Feb23 (1).pdf
Tumelo-deep-dive-into-pass-through-voting-Feb23 (1).pdf
 

Convertible Bonds and Call Overwrites - 2007

  • 1. October 12, 2005 Best Buy 2.25% due 01/15/22 Venu Krishna, CFA with Call Overwrites 1.212.526.7328 venu.krishna@lehman.com An Attractive Risk-Adjusted Play on Best Buy Brendan Lynch 1.212.526.8432 Best Buy’s stock (BBY) has come under pressure in the past few weeks. The stock closed at blynch1@lehman.com $41.86 on 10/10/2005, 21% below its 52 week high of $53.17 on 07/28/2005. The S&P 500 was down 4.5% over the same period. Manoj Shivdasani 1.212.526.8428 mshivdas@lehman.com In this note we evaluate BBY’s 2.25% due 01/15/2022 convertible bonds with call overwrites as an attractive risk-adjusted play on Best Buy. We have analyzed the trade over three time horizons and with varying degrees of overwrites to help investors make a choice based on their individual preferences and outlook. 3-month implied volatilities for BBY are trading at the higher end of their historical range on both an absolute basis as well as in comparison to the market (S&P 500) and the S&P 500 Consumer Discretionary sector. By selling calls at a higher implied volatility against a long convert position (28.9 implied volatility), investors can monetize the higher volatility in the options market which appears rich at current levels. Given their attractive risk-reward profile, the fact that the returns are computed on a holding- period basis (not annualized) and the overall risk-averse, uncertain, low return expectation macro environment that we are currently in, we believe these trades are attractive and Analyst Certification should appeal especially to investors looking for potential upside in a highly risk controlled I, Venu Krishna, CFA hereby manner. certify (1) that the views expressed in this research report . accurately reflect my personal views about any or all of the subject securities or issuers referred to in this report and (2) no part of my compensation was, is or will be directly or indirectly related to the specific recommendations or views expressed in this report. Lehman Brothers does and seeks to do business with companies covered in its research reports. As a result, investors should be aware that the firm may have a conflict of interest that could affect the objectivity of this report. Customers of Lehman Brothers in the United States can receive independent, third-party research on the company or companies covered in this report, at no cost to them, where such research is available. Customers can access this independent research at www.lehmanlive.com or can call 1-800-2LEHMAN to request a copy of this research. Investors should consider this report as only a single factor in making their investment decision. PLEASE REFER TO IMPORTANT DISCLOSURES BEGINNING ON PAGE 8
  • 2. Best Buy 2.25% due 01/15/22 with Call Overwrites Introduction Best Buy’s stock (BBY) has come under pressure in the past few weeks. The stock closed at $41.86 on 10/10/2005, 21% below its 52 week high of $53.17 on 07/28/2005. Lehman Brothers fundamental research analyst Alan M. Rifkin believes that after an impressive 1Q, 2Q results and management’s maintained full year guidance fell short of investor’s expectations, which is why the stock has been weak. In our opinion, high oil prices, an uncertain interest rate environment, lowered expectations on consumer spending and the after effects of the hurricanes have also likely led to the decline of BBY’s stock price. Lehman Brothers’ fundamental research stock and sector ratings remain positive at 1- Overweight/1-Positive with a 12-month price target of $57.00 based on a 22x multiple of 2006 earnings estimate of $2.58 (including $0.11 of options expense). In this note we evaluate BBY’s 2.25% due 01/15/2022 convertible bonds with call overwrites as an attractive risk-adjusted play on Best Buy. We have analyzed the trade over three time horizons and with varying degrees of overwrites to help investors make a choice based on their individual preferences and outlook. Also, we have chosen option contracts that are relatively liquid for ease of execution. ~3 month – short term to include near-term preliminary data on holiday season spending and to end coincidentally with the 01/21/06 options expiry date ~5 month – medium term to include actual reported results for the holiday season and to end coincidentally with the 03/18/06 options expiry date ~15 month – relatively longer term till the first put/call date (01/15/2007) on the bonds (options expire on 01/20/07) 1 According to our Equity Derivatives Strategy Team 3-month implied volatilities for BBY are trading at the higher end of their historical range on both an absolute basis as well as in comparison to the market (S&P 500) and the S&P 500 Consumer Discretionary sector. Since the Company is next scheduled to report earnings in December, the recent run up in risk expectations seems to be driven more by factors discussed earlier. By selling calls at a higher implied volatility against a long convert position (28.9 implied volatility), investors can monetize the higher volatility in the options market which appears rich at current levels. For example, the $47.5 strike 1/21/06 expiry calls have an implied volatility of 34.6% and the $50 strike calls with the same expiry have an implied volatility of 33.1% The $50 strike, longer dated calls expiring in January 2007 too have an implied volatility of 30.7% which is 1.8 points higher than the implied volatility of the convert. 1 Ryan Renicker and Devapriya Mallick. 2 October 12, 2005
  • 3. Best Buy 2.25% due 01/15/22 with Call Overwrites Figure 1: Listed Call Options Table (versus $42.00 Current Stock Price) 01/21/2006 03/18/2006 01/20/2007 Strike Bid # Contracts Size Imp. Vol Bid # Contracts Size Imp. Vol Bid # Contracts Size Imp. Vol $46.25 - - - - - - - - $4.69 2754 150 30.6 $47.50 $1.33 1249 100 34.6 $1.89 490 100 32.8 - - - - $50.00 $0.74 3990 100 33.1 $1.31 1850 100 32.6 $3.66 4294 100 30.7 $50.00 $0.74 7264 150 33.1 $1.31 434 150 32.6 $3.66 190 150 30.7 Source: Lehman Brothers Figure 3: BBY Implied Volatility Trend versus S&P 500 and S&P 500 Consumer Discretionary Sector 40% BBY 3m Imp Vol 35% 30% 25% Sector Avg Imp Vols 20% (Consumer Discretionary) 15% 10% SPX 3m Imp Vol 5% 0% 4 5 5 04 5 5 5 5 05 5 05 4 -0 -0 -0 -0 n-0 0 -0 0 c-0 ct- p- - b- g- ar r ov ay Jul Jun Ap De Ja Fe Se Au O M N M Source: Lehman Brothers Equity Derivatives Strategy We believe that the trades discussed below have a defensive yet attractive risk-reward profile and are likely to appeal to investors seeking to participate in BBY’s potential upside while significantly lowering downside risk. The rest of this report details out the potential payoffs for various trades. BBY 2.25% due 01/10/2022 Convertible The key terms of the BBY 2.25% convertible are below. Note the relatively low risk premium (high bond floor of 96.35). The converts have a conversion price of $46 and a conversion ratio of 21.7391. In this section we analyze the total return of the convertibles over the three horizon periods under different stock price scenarios and overwrite strategies. The tables detail out the potential payoffs for trades that are long 1 bond (@107.75 vs. $42.00) with varying degrees of overwrites and over different time horizons. All payoffs are calculated in bond points and the percentage returns are for the holding period. October 12, 2005 3
  • 4. Best Buy 2.25% due 01/15/22 with Call Overwrites Figure 2: Best Buy 2.25% Convertible due 10/01/2025 Issue Income Call Size Risk Pickup Yrs to Prot Theo % Rich/ Implied Libor Theo Vol/Credit Bond (mln) Prem % Prem % CY (bps) Put (yrs) Convert Px Stock Px Value (Cheap) Vol OAS Delta Assump BBY 2.25% 402.5 18.0 11.8 2.08% 133 1.3 1.3 107.750 $42.00 107.80 (0.05) 28.9 50 52 29 Vol / L+50 Source: Lehman Brothers Figure 3: Short Term Horizon (1/21/06) - Long 1 BBY 2.25% Convert with Call Overwrites Short term (1/21/06) - Long 1 BBY 2.25% with call overwrites Horizon Stock Price $12 $30 $32 $34 $36 $38 $40 $42 $44 $46 $48 $50 $52 $54 $72 Stock Price % Chg (71.4%) (28.6%) (23.8%) (19.0%) (14.3%) (9.5%) (4.8%) 0.0% 4.8% 9.5% 14.3% 19.0% 23.8% 28.6% 71.4% Estimated Cvt Px 97.05 98.57 99.34 100.34 101.59 103.09 104.88 106.91 109.19 111.72 114.46 117.41 120.55 123.85 158.42 Px Return (10.70) (9.18) (8.41) (7.41) (6.16) (4.66) (2.87) (0.84) 1.44 3.97 6.71 9.66 12.80 16.10 50.67 Cpn Return 0.63 0.63 0.63 0.63 0.63 0.63 0.63 0.63 0.63 0.63 0.63 0.63 0.63 0.63 0.63 Without Overwrite Total Return (10.07) (8.55) (7.78) (6.78) (5.53) (4.03) (2.24) (0.21) 2.07 4.60 7.34 10.29 13.43 16.73 51.30 Total Return % (9.3%) (7.9%) (7.2%) (6.3%) (5.1%) (3.7%) (2.1%) (0.2%) 1.9% 4.3% 6.8% 9.6% 12.5% 15.5% 47.6% Overwrite: Sell 20 $47.5 strike calls expiring on 1/21/06 @ $1.33 per call (34.6% implied volatility) Call Premium 2.66 2.66 2.66 2.66 2.66 2.66 2.66 2.66 2.66 2.66 2.66 2.66 2.66 2.66 2.66 Call Payoff 0.00 0.00 0.00 0.00 0.00 0.00 0.00 0.00 0.00 0.00 (1.00) (5.00) (9.00) (13.00) (49.00) Total Return (7.41) (5.89) (5.12) (4.12) (2.87) (1.37) 0.42 2.45 4.73 7.26 9.00 7.95 7.09 6.39 4.96 Total Return % (6.9%) (5.5%) (4.7%) (3.8%) (2.7%) (1.3%) 0.4% 2.3% 4.4% 6.7% 8.4% 7.4% 6.6% 5.9% 4.6% Overwrite: Sell 10 $47.5 strike calls expiring on 1/21/06 @ $1.33 per call (34.6% implied volatility) Call Premium 1.33 1.33 1.33 1.33 1.33 1.33 1.33 1.33 1.33 1.33 1.33 1.33 1.33 1.33 1.33 Call Payoff 0.00 0.00 0.00 0.00 0.00 0.00 0.00 0.00 0.00 0.00 (0.50) (2.50) (4.50) (6.50) (24.50) Total Return (8.74) (7.22) (6.45) (5.45) (4.20) (2.70) (0.91) 1.12 3.40 5.93 8.17 9.12 10.26 11.56 28.13 Total Return % (8.1%) (6.7%) (6.0%) (5.1%) (3.9%) (2.5%) (0.8%) 1.0% 3.2% 5.5% 7.6% 8.5% 9.5% 10.7% 26.1% Overwrite: Sell 20 $50.0 strike calls expiring on 1/21/06 @ $0.74 per call (33.1% implied volatility) Call Premium 1.48 1.48 1.48 1.48 1.48 1.48 1.48 1.48 1.48 1.48 1.48 1.48 1.48 1.48 1.48 Call Payoff 0.00 0.00 0.00 0.00 0.00 0.00 0.00 0.00 0.00 0.00 0.00 0.00 (4.00) (8.00) (44.00) Total Return (8.59) (7.07) (6.30) (5.30) (4.05) (2.55) (0.76) 1.27 3.55 6.08 8.82 11.77 10.91 10.21 8.78 Total Return % (8.0%) (6.6%) (5.8%) (4.9%) (3.8%) (2.4%) (0.7%) 1.2% 3.3% 5.6% 8.2% 10.9% 10.1% 9.5% 8.2% Overwrite: Sell 10 $50.0 strike calls expiring on 1/21/06 @ $0.74 per call (33.1% implied volatility) Call Premium 0.74 0.74 0.74 0.74 0.74 0.74 0.74 0.74 0.74 0.74 0.74 0.74 0.74 0.74 0.74 Call Payoff 0.00 0.00 0.00 0.00 0.00 0.00 0.00 0.00 0.00 0.00 0.00 0.00 (2.00) (4.00) (22.00) Total Return (9.33) (7.81) (7.04) (6.04) (4.79) (3.29) (1.50) 0.53 2.81 5.34 8.08 11.03 12.17 13.47 30.04 Total Return % (8.7%) (7.2%) (6.5%) (5.6%) (4.4%) (3.0%) (1.4%) 0.5% 2.6% 5.0% 7.5% 10.2% 11.3% 12.5% 27.9% Source: Lehman Brothers The first overwrite trade presented above exemplifies the attractive risk-reward profile. Should stock increase from the current $42 to $46 (+9.5%), we estimate the total return on the trade to be 6.7%, an upside participation of 70%. And for a $4 decline in stock to $38 (-9.5%), the total return on the trade is -1.3%, a downside participation of just 14%. We find this 5:1 risk reward profile very attractive. Investors should note that the risk-reward for this particular trade becomes less attractive for larger price changes and can tailor their strategy according to their individual expectation on the stock and their risk-return preferences. One can see that trades with a fewer number of higher strike overwrites (last example) are likely to perform better should stock appreciate significantly. 4 October 12, 2005
  • 5. Best Buy 2.25% due 01/15/22 with Call Overwrites Figure 4: Medium Term Horizon (3/18/06) - Long 1 BBY 2.25% Convert with Call Overwrites Horizon Stock Price $12 $30 $32 $34 $36 $38 $40 $42 $44 $46 $48 $50 $52 $54 $72 Stock Price % Chg (71.4%) (28.6%) (23.8%) (19.0%) (14.3%) (9.5%) (4.8%) 0.0% 4.8% 9.5% 14.3% 19.0% 23.8% 28.6% 71.4% Estimated Cvt Px 97.47 98.63 99.29 100.18 101.32 102.71 104.40 106.36 108.57 111.04 113.74 116.67 119.80 123.10 157.93 Px Return (10.28) (9.12) (8.46) (7.57) (6.43) (5.04) (3.35) (1.40) 0.82 3.29 5.99 8.92 12.05 15.35 50.18 Cpn Return 2.88 2.88 2.88 2.88 2.88 2.88 2.88 2.88 2.88 2.88 2.88 2.88 2.88 2.88 2.88 Without Overwrite Total Return (7.40) (6.24) (5.58) (4.69) (3.55) (2.16) (0.47) 1.48 3.70 6.17 8.87 11.80 14.93 18.23 53.06 Total Return % (6.9%) (5.8%) (5.2%) (4.4%) (3.3%) (2.0%) (0.4%) 1.4% 3.4% 5.7% 8.2% 11.0% 13.9% 16.9% 49.2% Overwrite: Sell 20 $47.5 strike calls expiring on 3/18/06 @ $1.89 per call (32.8% implied volatility) Call Premium 3.78 3.78 3.78 3.78 3.78 3.78 3.78 3.78 3.78 3.78 3.78 3.78 3.78 3.78 3.78 Call Payoff 0.00 0.00 0.00 0.00 0.00 0.00 0.00 0.00 0.00 0.00 (1.00) (5.00) (9.00) (13.00) (49.00) Total Return (5.52) (4.36) (3.70) (2.81) (1.67) (0.28) 1.41 3.37 5.58 8.05 9.75 8.68 7.81 7.11 5.94 Total Return % (5.1%) (4.0%) (3.4%) (2.6%) (1.5%) (0.3%) 1.3% 3.1% 5.2% 7.5% 9.0% 8.1% 7.2% 6.6% 5.5% Overwrite: Sell 10 $47.5 strike calls expiring on 3/18/06 @ $1.89 per call (32.8% implied volatility) Call Premium 1.89 1.89 1.89 1.89 1.89 1.89 1.89 1.89 1.89 1.89 1.89 1.89 1.89 1.89 1.89 Call Payoff 0.00 0.00 0.00 0.00 0.00 0.00 0.00 0.00 0.00 0.00 (0.50) (2.50) (4.50) (6.50) (24.50) Total Return (7.41) (6.25) (5.59) (4.70) (3.56) (2.17) (0.48) 1.48 3.69 6.16 8.36 9.29 10.42 11.72 28.55 Total Return % (6.9%) (5.8%) (5.2%) (4.4%) (3.3%) (2.0%) (0.4%) 1.4% 3.4% 5.7% 7.8% 8.6% 9.7% 10.9% 26.5% Overwrite: Sell 20 $50.0 strike calls expiring on 3/18/06 @ $1.31 per call (32.6% implied volatility) Call Premium 2.62 2.62 2.62 2.62 2.62 2.62 2.62 2.62 2.62 2.62 2.62 2.62 2.62 2.62 2.62 Call Payoff 0.00 0.00 0.00 0.00 0.00 0.00 0.00 0.00 0.00 0.00 0.00 0.00 (4.00) (8.00) (44.00) Total Return (6.68) (5.52) (4.86) (3.97) (2.83) (1.44) 0.25 2.21 4.42 6.89 9.59 12.52 11.65 10.95 9.78 Total Return % (6.2%) (5.1%) (4.5%) (3.7%) (2.6%) (1.3%) 0.2% 2.0% 4.1% 6.4% 8.9% 11.6% 10.8% 10.2% 9.1% Overwrite: Sell 10 $50.0 strike calls expiring on 3/18/06 @ $1.31 per call (32.6% implied volatility) Call Premium 1.31 1.31 1.31 1.31 1.31 1.31 1.31 1.31 1.31 1.31 1.31 1.31 1.31 1.31 1.31 Call Payoff 0.00 0.00 0.00 0.00 0.00 0.00 0.00 0.00 0.00 0.00 0.00 0.00 (2.00) (4.00) (22.00) Total Return (7.99) (6.83) (6.17) (5.28) (4.14) (2.75) (1.06) 0.90 3.11 5.58 8.28 11.21 12.34 13.64 30.47 Total Return % (7.4%) (6.3%) (5.7%) (4.9%) (3.8%) (2.6%) (1.0%) 0.8% 2.9% 5.2% 7.7% 10.4% 11.5% 12.7% 28.3% Source: Lehman Brothers October 12, 2005 5
  • 6. Best Buy 2.25% due 01/15/22 with Call Overwrites Figure 5: Long Term Horizon (1/15/07) - Long 1 BBY 2.25% Convert with Call Overwrites Horizon Stock Price $12 $30 $32 $34 $36 $38 $40 $42 $44 $46 $48 $50 $52 $54 $72 Stock Price % Chg (71.4%) (28.6%) (23.8%) (19.0%) (14.3%) (9.5%) (4.8%) 0.0% 4.8% 9.5% 14.3% 19.0% 23.8% 28.6% 71.4% Estimated Cvt Px 100.00 100.00 100.00 100.00 100.00 100.08 101.62 103.45 105.37 107.37 109.45 111.63 113.97 117.43 156.53 Px Return (7.75) (7.75) (7.75) (7.75) (7.75) (7.67) (6.13) (4.30) (2.38) (0.38) 1.70 3.88 6.22 9.68 48.78 Cpn Return 2.88 2.88 2.88 2.88 2.88 2.88 2.88 2.88 2.88 2.88 2.88 2.88 2.88 2.88 2.88 Without Overwrite Total Return (4.87) (4.87) (4.87) (4.87) (4.87) (4.79) (3.25) (1.42) 0.50 2.50 4.58 6.76 9.10 12.56 51.65 Total Return % (4.5%) (4.5%) (4.5%) (4.5%) (4.5%) (4.4%) (3.0%) (1.3%) 0.5% 2.3% 4.2% 6.3% 8.4% 11.7% 47.9% Overwrite: Sell 20 $46.625 strike calls expiring on 1/20/07 @ $4.69 per call (30.6% implied volatility) Call Premium 9.37 9.37 9.37 9.37 9.37 9.37 9.37 9.37 9.37 9.37 9.37 9.37 9.37 9.37 9.37 Call Payoff 0.00 0.00 0.00 0.00 0.00 0.00 0.00 0.00 0.00 0.00 (2.75) (6.75) (10.75) (14.75) (50.75) Total Return 4.50 4.50 4.50 4.50 4.50 4.58 6.12 7.95 9.87 11.87 11.20 9.38 7.72 7.18 10.28 Total Return % 4.2% 4.2% 4.2% 4.2% 4.2% 4.3% 5.7% 7.4% 9.2% 11.0% 10.4% 8.7% 7.2% 6.7% 9.5% Overwrite: Sell 10 $46.625 strike calls expiring on 1/20/07 @ $4.69 per call (30.6% implied volatility) Call Premium 4.69 4.69 4.69 4.69 4.69 4.69 4.69 4.69 4.69 4.69 4.69 4.69 4.69 4.69 4.69 Call Payoff 0.00 0.00 0.00 0.00 0.00 0.00 0.00 0.00 0.00 0.00 (1.38) (3.38) (5.38) (7.38) (25.38) Total Return (0.18) (0.18) (0.18) (0.18) (0.18) (0.10) 1.44 3.27 5.19 7.19 7.89 8.07 8.41 9.87 30.97 Total Return % (0.2%) (0.2%) (0.2%) (0.2%) (0.2%) (0.1%) 1.3% 3.0% 4.8% 6.7% 7.3% 7.5% 7.8% 9.2% 28.7% Overwrite: Sell 20 $50.0 strike calls expiring on 1/20/07 @ $3.66 per call (30.7% implied volatility) Call Premium 7.32 7.32 7.32 7.32 7.32 7.32 7.32 7.32 7.32 7.32 7.32 7.32 7.32 7.32 7.32 Call Payoff 0.00 0.00 0.00 0.00 0.00 0.00 0.00 0.00 0.00 0.00 0.00 0.00 (4.00) (8.00) (44.00) Total Return 2.45 2.45 2.45 2.45 2.45 2.53 4.07 5.90 7.82 9.82 11.90 14.08 12.42 11.88 14.97 Total Return % 2.3% 2.3% 2.3% 2.3% 2.3% 2.3% 3.8% 5.5% 7.3% 9.1% 11.0% 13.1% 11.5% 11.0% 13.9% Overwrite: Sell 10 $50.0 strike calls expiring on 1/20/07 @ $3.66 per call (30.7% implied volatility) Call Premium 3.66 3.66 3.66 3.66 3.66 3.66 3.66 3.66 3.66 3.66 3.66 3.66 3.66 3.66 3.66 Call Payoff 0.00 0.00 0.00 0.00 0.00 0.00 0.00 0.00 0.00 0.00 0.00 0.00 (2.00) (4.00) (22.00) Total Return (1.21) (1.21) (1.21) (1.21) (1.21) (1.13) 0.41 2.24 4.16 6.16 8.24 10.42 10.76 12.22 33.31 Total Return % (1.1%) (1.1%) (1.1%) (1.1%) (1.1%) (1.0%) 0.4% 2.1% 3.9% 5.7% 7.6% 9.7% 10.0% 11.3% 30.9% ySource: Lehman Brothers Summary Given their attractive risk-reward profile, the fact that the returns are computed on a holding- period basis (not annualized) and the overall risk-averse, uncertain, low return expectation macro environment that we are currently in, we believe these trades are attractive. We suggest the following process to determine an optimal strategy: First define the time horizon i.e. short term, medium term or a slightly longer term. Second, arrive at a stock price estimate over the holding period. This will help in choosing the appropriate overwrite strategy. For instance if investors feel that the stock is not likely to rise above $47.50 over the holding period then they may consider writing calls with that strike. And third, determine the preference for income versus potential appreciation. If investors prefer greater income and don’t mind giving up the upside beyond the call overwrite threshold, they could potentially write more number of calls at lower strikes for each long convert position. 6 October 12, 2005
  • 7. Best Buy 2.25% due 01/15/22 with Call Overwrites While we believe that the risk in our suggested trades is rather limited there are some risk factors that investors should be aware of. We have assumed that the convertible bond can be sold in the secondary market at its theoretical value. If the bonds cheapen returns could be lower. If the volatility of BBY decreases and/or credit spreads widen and/or interest rates rise and/or BBY raises its common dividend, investors are likely to realize a lower return than what is presented in our analysis. However, the relatively short dated 1.3 year put on the bonds limits the effect of these risk factors. In conclusion, we believe Best Buy’s convertible bonds overlaid with an overwrite strategy present several defensive yet attractive trade alternatives in the current uncertain environment. We believe these will appeal especially to investors looking for potential upside in a highly risk controlled manner. October 12, 2005 7
  • 8. FOR CURRENT IMPORTANT DISCLOSURES REGARDING COMPANIES THAT ARE THE SUBJECT OF THIS RESEARCH REPORT, PLEASE SEND A WRITTEN REQUEST TO: LEHMAN BROTHERS CONTROL ROOM 745 SEVENTH AVENUE, 19TH FLOOR NEW YORK, NY 10019 OR REFER TO THE FIRM'S DISCLOSURE WEBSITE AT www.lehman.com/disclosures Important Disclosures: The analysts responsible for preparing this report have received compensation based upon various factors including the Firm’s total revenues, a portion of which is generated by investment banking activities. Convertibles Risk Disclosure(s): The convertible valuations are based on Lehman’s proprietary convertible valuation model, under which key assumptions relate to credit spread and volatility metrics. Material changes in any of these variables can have a significant impact on valuation. Upside/downside analysis takes into consideration likely future valuation and expected trading patterns, among others. It is based on a total return participation of the convertible relative to a +/- 25% change in the common stock’s price over a one-year investment horizon. A material change in the company’s financial situation can significantly alter this assessment. Mentioned Stocks Best Buy (BBY - USD41.86) 1-Overweight / Positive J/K/M Risks Which May Impede the Achievement of the Price Target: 1. If Circuit City is promotional, Best Buy's sales and earnings could be negatively impacted. 2. If problems arise with the integration of Future Shop, Best Buy's earnings could be negatively impacted. 3. If prerecorded music sales decline, Best Buy's sales could be negatively affected. Disclosure Legend: J: Lehman Brothers Inc. or an affiliate trade(s) regularly in the shares of the subject company. K: Lehman Brothers Inc. has received non-investment banking related compensation from the subject company within the last 12 months. M: The subject company is or during the last 12 months has been a non-investment banking client (securities related services) of Lehman Brothers Inc. Valuation Methodology: BBY shares currently trade at 19.5x and 16.5x our 2005 and 2006 EPS estimates of $2.18 and $2.58 (including $0.11 of options expense), respectively. Our 12-month price target of $57 is based on a multiple of 22x our 2006 estimate. The shares currently trade at an 8% premium to the S&P 500, based on our 2006 estimate, having traded between a 34% discount and a 40% premium to the S&P 500 over the past five years. We maintain our 1-Overweight rating on the shares, as we believe the potential exists for BBY shares to outperform the unweighted expected total return of the retail industry over the next 12 months. Guide to Lehman Brothers Equity Research Rating System: Our coverage analysts use a relative rating system in which they rate stocks as 1-Overweight, 2- Equal weight or 3-Underweight (see definitions below) relative to other companies covered by the analyst or a team of analysts that are deemed to be in the same industry sector (“the sector coverage universe”). To see a list of companies that comprise a particular sector coverage universe, please go to www.lehman.com/disclosures. In addition to the stock rating, we provide sector views which rate the outlook for the sector coverage universe as 1-Positive, 2-Neutral or 3-Negative (see definitions below). A rating system using terms such as buy, hold and sell is not the equivalent of our rating system. Investors should carefully read the entire research report including the definitions of all ratings and not infer its contents from ratings alone. Stock Rating 1-Overweight - The stock is expected to outperform the unweighted expected total return of the sector coverage universe over a 12-month investment horizon. 2-Equal weight - The stock is expected to perform in line with the unweighted expected total return of the sector coverage universe over a 12-month investment horizon. 3-Underweight - The stock is expected to underperform the unweighted expected total return of the sector coverage universe over a 12-month investment horizon. RS-Rating Suspended - The rating and target price have been suspended temporarily to comply with applicable regulations and/or firm policies in certain circumstances including when Lehman Brothers is acting in an advisory capacity on a merger or strategic transaction involving the company. Sector View 1-Positive - sector coverage universe fundamentals are improving. 2-Neutral - sector coverage universe fundamentals are steady, neither improving nor deteriorating. 3-Negative - sector coverage universe fundamentals are deteriorating. Distribution of Ratings: Lehman Brothers Equity Research has 1758 companies under coverage. 42% have been assigned a 1-Overweight rating which, for purposes of mandatory disclosures, is classified as a Buy rating, 35% of companies with this rating are investment banking clients of the Firm. 41% have been assigned a 2-Equal weight rating which, for purposes of mandatory disclosures, is classified as a Hold rating, 7% of companies with this rating are investment banking clients of the Firm. 17% have been assigned a 3-Underweight rating which, for purposes of mandatory disclosures, is classified as a Sell rating, 84% of companies with this rating are investment banking clients of the Firm. This material has been prepared and/or issued by Lehman Brothers Inc., member SIPC, and/or one of its affiliates (“Lehman Brothers”) and has been approved by Lehman Brothers International (Europe), authorised and regulated by the Financial Services Authority, in connection with its distribution in the European Economic Area. This material is distributed in Japan by Lehman Brothers Japan Inc., and in Hong Kong by Lehman Brothers Asia Limited. This material is distributed in Australia by Lehman Brothers Australia Pty Limited, and in Singapore by Lehman Brothers Inc., Singapore Branch (“LBIS”). Where this material is distributed by LBIS, please note that it is intended for general circulation only and the recommendations contained herein does not take into account the specific investment objectives, financial situation or particular needs of any particular person. An investor should consult his Lehman Brothers’ representative regarding the suitability of the product and take into account his specific investment objectives, financial situation or particular needs before he makes a commitment to purchase the investment product. This material is distributed in Korea by Lehman Brothers International (Europe) Seoul Branch. This document is for information purposes only and it should not be regarded as an offer to sell or as a solicitation of an offer to buy the securities or other instruments mentioned in it. No part of this document may be reproduced in any manner without the written permission of Lehman Brothers. With the exception of disclosures relating to Lehman Brothers, this research report is based on current public information that Lehman Brothers considers reliable, but we make no representation that it is accurate or complete, and it should not be relied on as such. In the case of any disclosure to the effect that Lehman Brothers Inc. or its affiliates beneficially own 1% or more of any class of common equity securities of the subject company, the computation of beneficial ownership of securities is based upon the methodology used to compute ownership under Section 13(d) of the United States' Securities Exchange Act of 1934. In the case of any disclosure to the effect that Lehman Brothers Inc. and/or its affiliates hold a short position of at least 1% of the outstanding share capital of a particular company, such disclosure relates solely to the ordinary share capital of the company. Accordingly, while such calculation represents Lehman Brothers’ holdings net of any long position in the ordinary share capital of the company, such calculation excludes any rights or obligations that Lehman Brothers may otherwise have, or which may accrue in the future, with respect to such ordinary share capital. Similarly such calculation
  • 9. Best Buy 2.25% due 01/15/22 with Call Overwrites does not include any shares held or owned by Lehman Brothers where such shares are held under a wider agreement or arrangement (be it with a client or a counterparty) concerning the shares of such company (e.g. prime broking and/or stock lending activity). Any such disclosure represents the position of Lehman Brothers as of the last business day of the calendar month preceding the date of this report. This material is provided with the understanding that Lehman Brothers is not acting in a fiduciary capacity. Opinions expressed herein reflect the opinion of Lehman Brothers and are subject to change without notice. The products mentioned in this document may not be eligible for sale in some states or countries, and they may not be suitable for all types of investors. If an investor has any doubts about product suitability, he should consult his Lehman Brothers representative. The value of and the income produced by products may fluctuate, so that an investor may get back less than he invested. Value and income may be adversely affected by exchange rates, interest rates, or other factors. Past performance is not necessarily indicative of future results. If a product is income producing, part of the capital invested may be used to pay that income. © 2005 Lehman Brothers. All rights reserved. Additional information is available on request. Please contact a Lehman Brothers entity in your home jurisdiction. Complete disclosure information on companies covered by Lehman Brothers Equity Research is available at www.lehman.com/disclosures. October 12, 2005 9