Downloaded 171 times

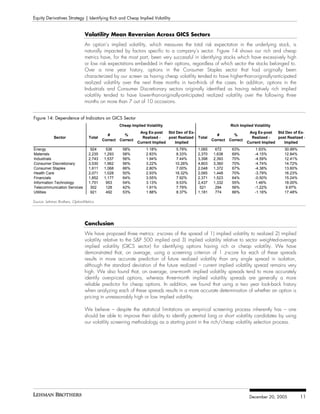

This document discusses a study on identifying options with high or low implied volatility to optimize trading strategies. It presents empirical evidence of the mean-reverting characteristics of implied vs. realized volatility and finds that combining several metrics significantly improves the accuracy of volatility predictions. Additionally, the study highlights challenges in identifying 'rich' or 'cheap' options in recent years due to market changes and increasing efficiency.