Download as PDF, PPTX


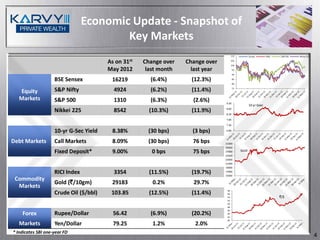
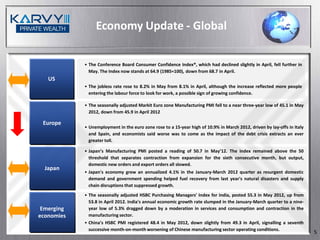
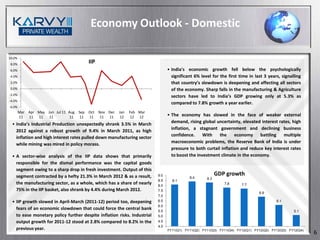


The document provides an economic and market outlook update for June 2012, noting recent declines in global equity markets due to concerns about Greece exiting the eurozone and slowing growth in the US and Europe. It reviews domestic and international economic indicators and inflation trends, and provides an outlook on the equity market and different sectors, identifying sectors like automobiles, banking, and infrastructure as overweight given expectations for monetary easing and declining oil prices.


