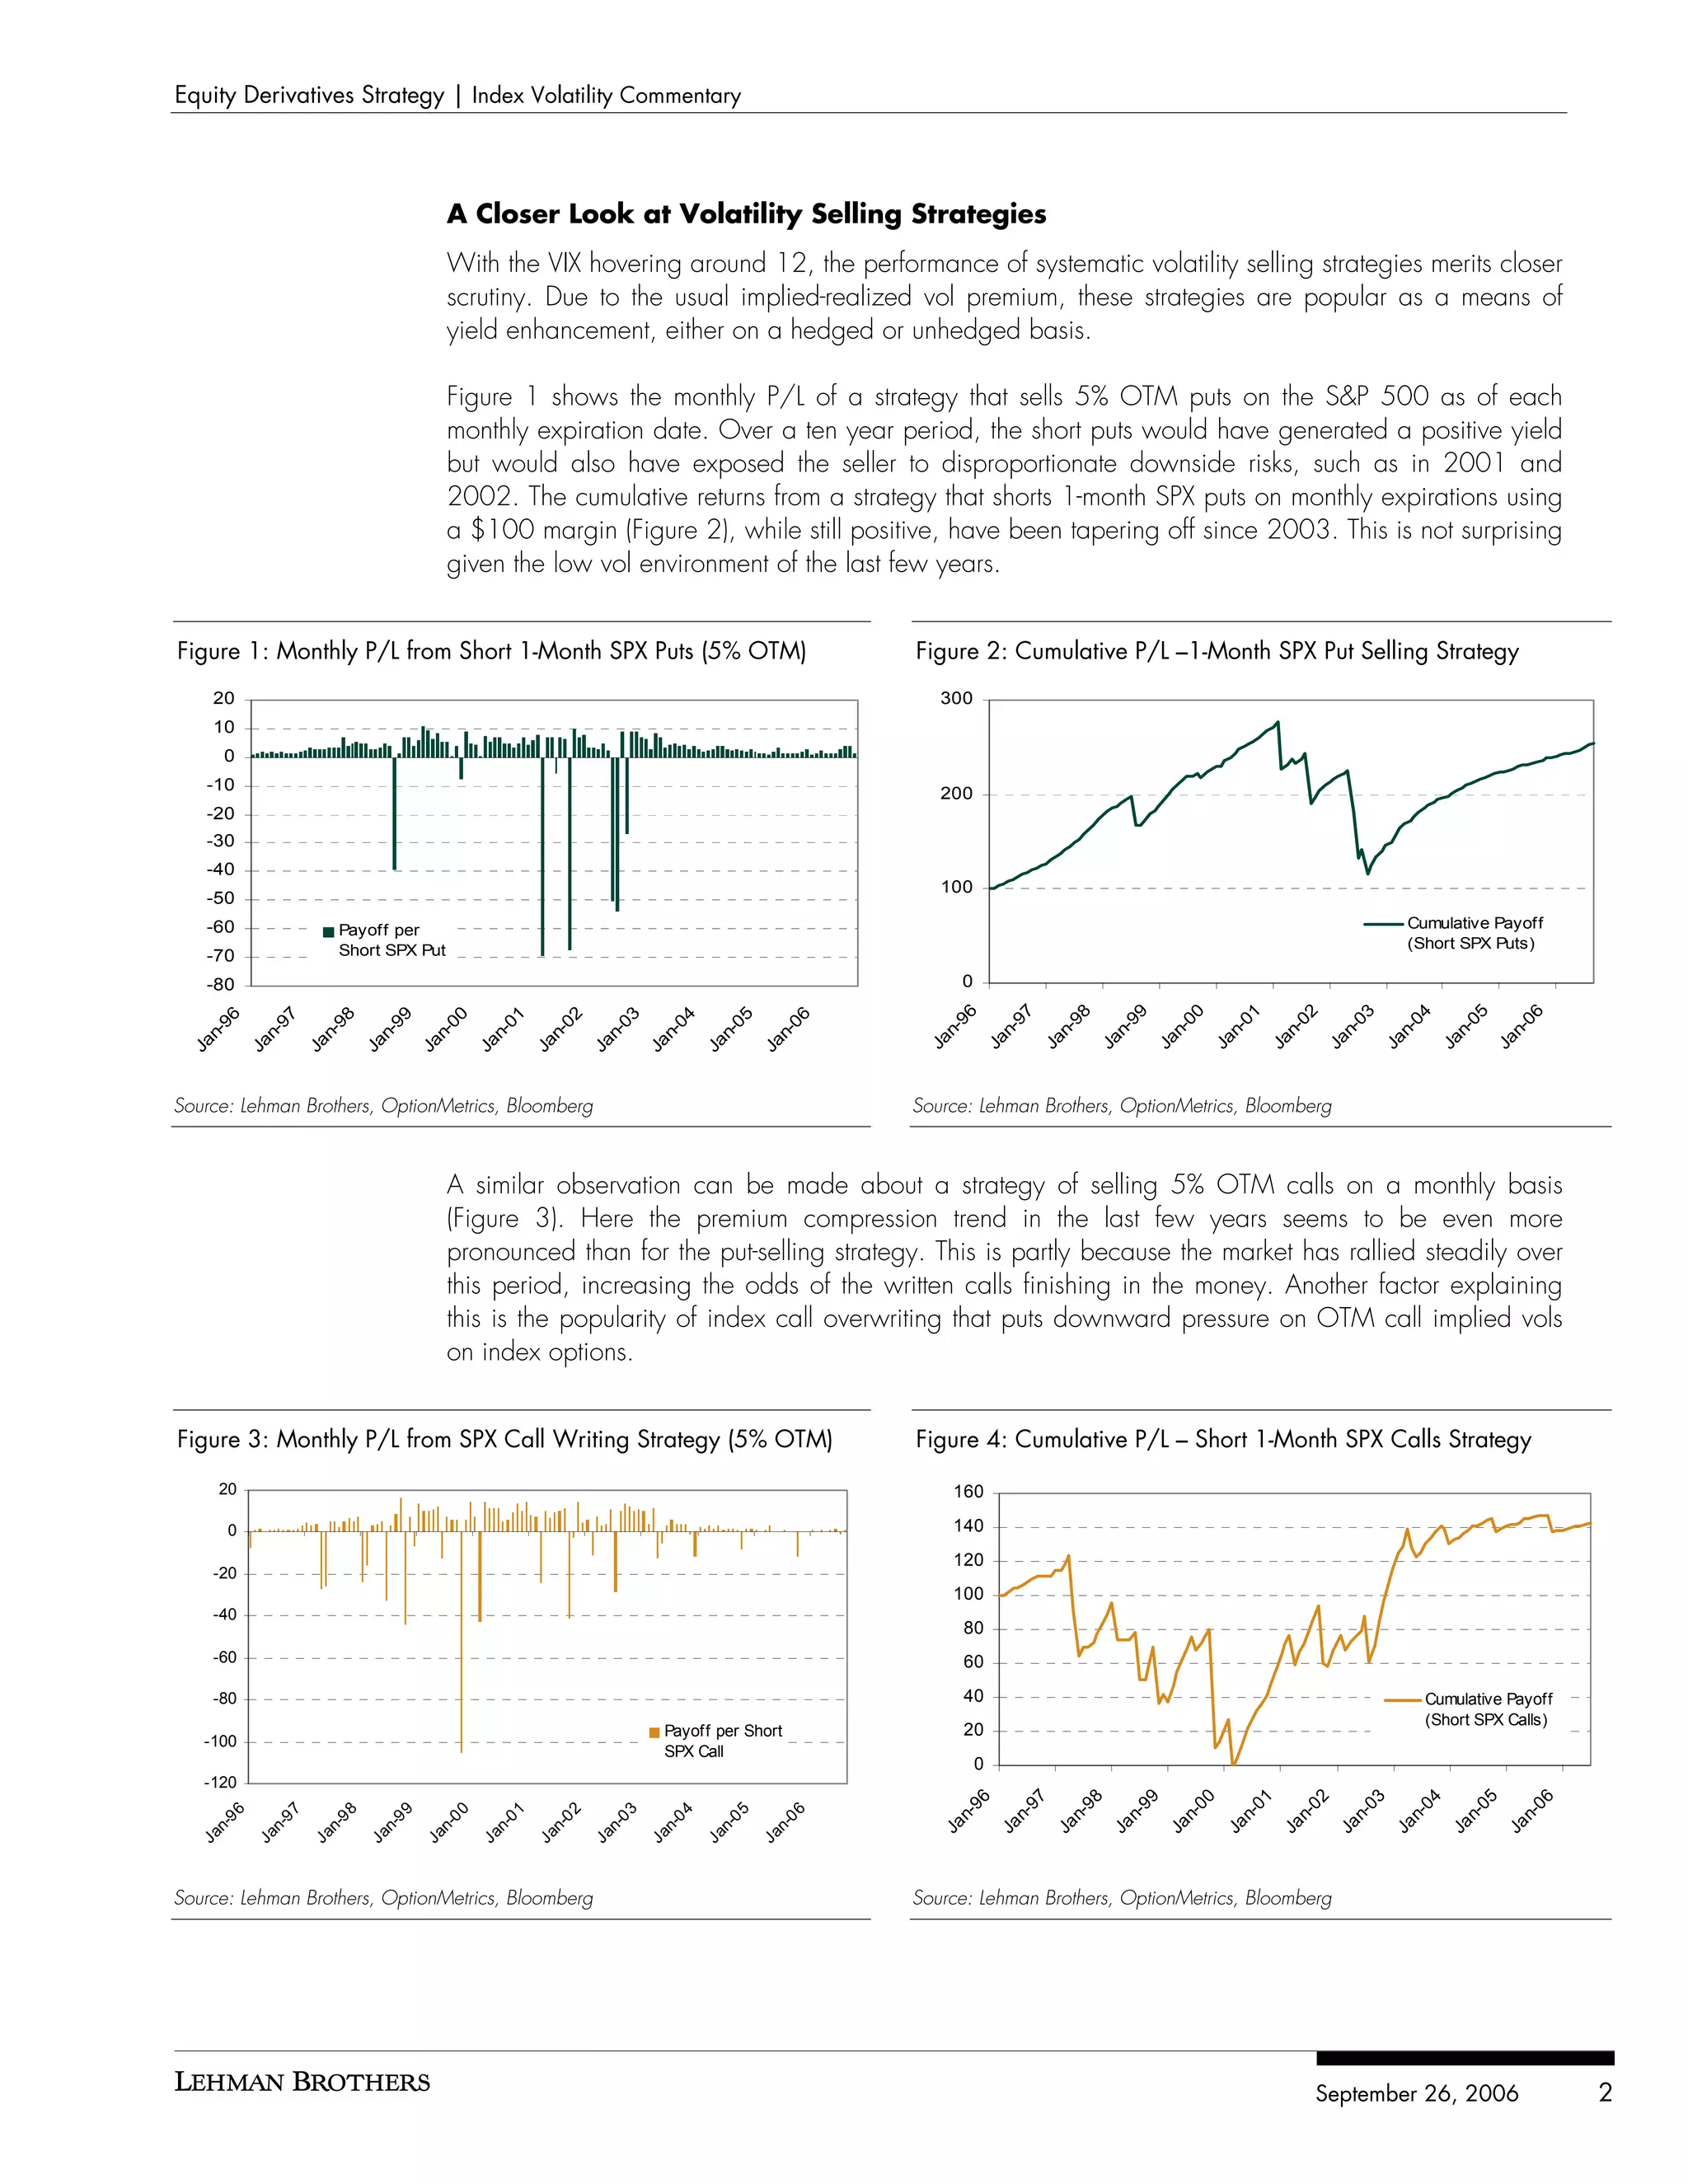
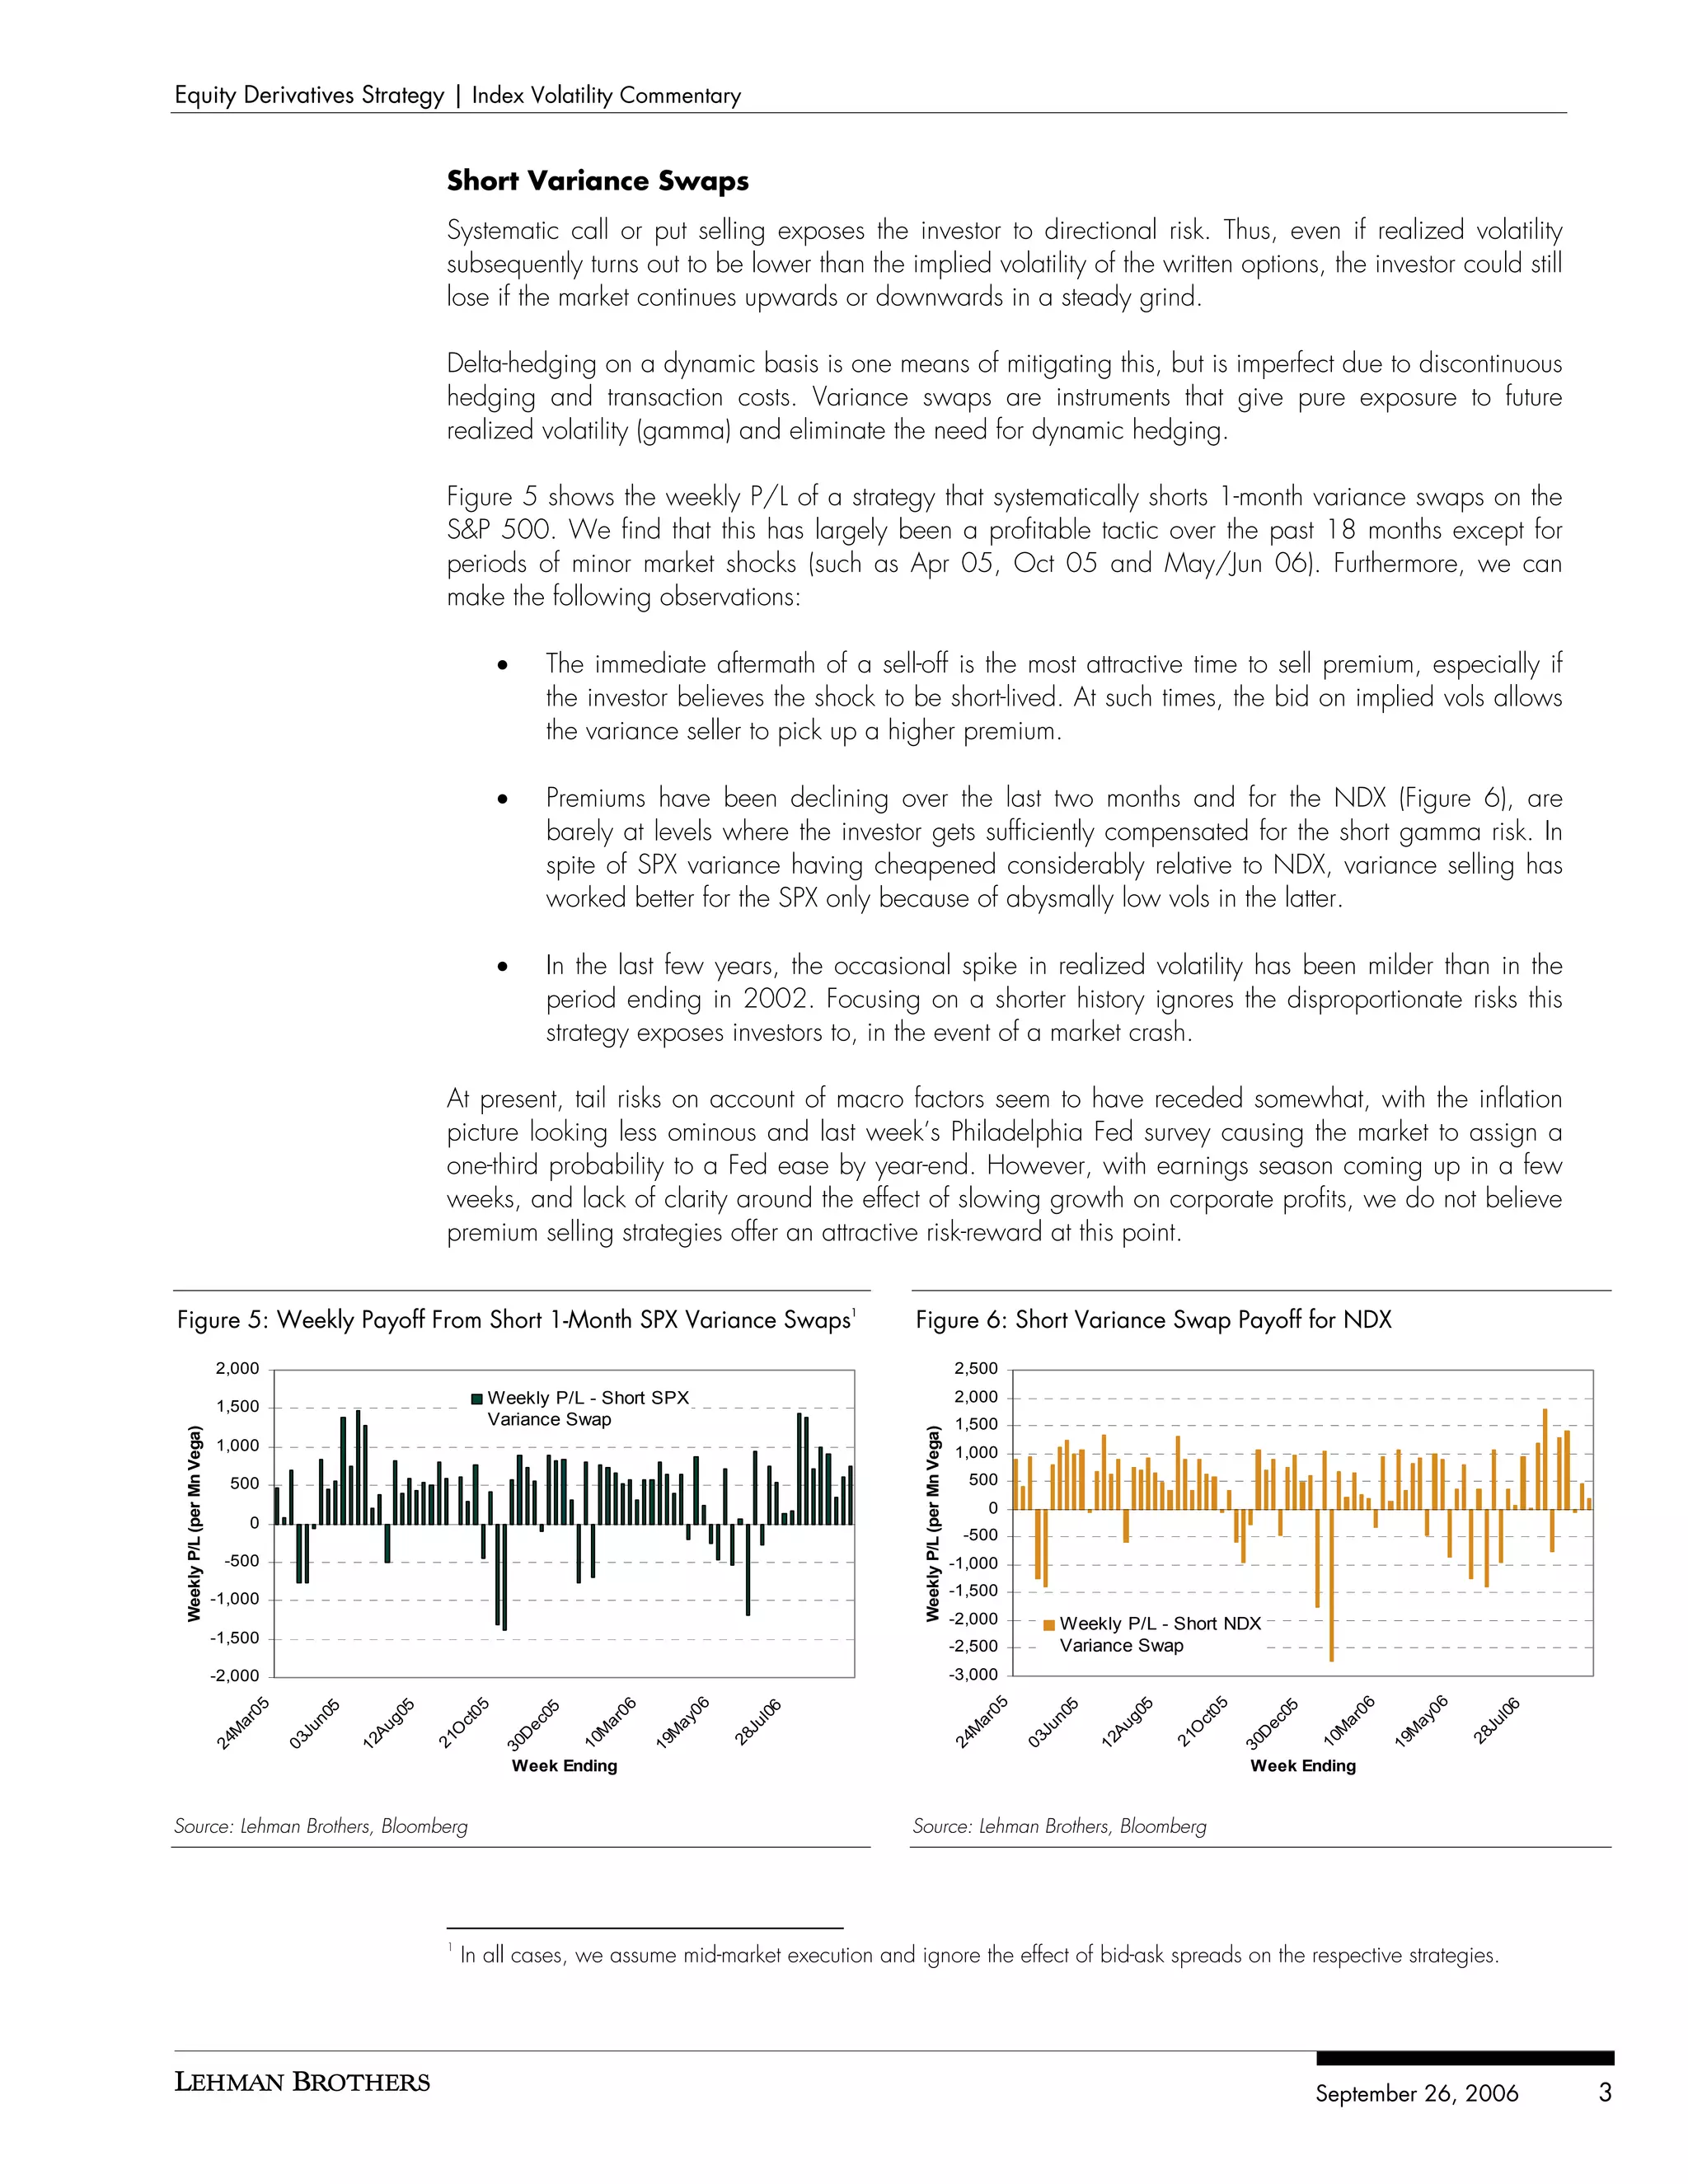
Actionable trade ideas for stock market investors and traders seeking alpha by overlaying their portfolios with options, other derivatives, ETFs, and disciplined and applied Game Theory for hedge fund managers and other active fund managers worldwide. Ryan Renicker, CFA
Collar Strategies - Not Hedged - Profitable but Also Risky
1. September 26, 2006
Index Volatility Commentary
Ryan Renicker, CFA
1.212.526.9425 • Systematic strategies that short index volatility have been popular in a period of historically low
ryan.renicker@lehman.com realized volatility.
Devapriya Mallick
1.212.526.5429 • Unhedged put and call writing using OTM SPX options have been profitable strategies over the
dmallik@lehman.com
last decade, but expose the investor to disproportionate downside risks.
• Short variance swap strategies on the SPX have remained profitable in spite of vols coming off in
recent months. However, sellers of NDX variance have been barely compensated for their short
gamma risk.
Lehman Brothers does and seeks to do business with companies covered in its research reports. As a result, investors should be aware that the firm may have a conflict of
interest that could affect the objectivity of this report.
Customers of Lehman Brothers in the United States can receive independent, third-party research on the company or companies covered in this report, at no cost to them,
where such research is available. Customers can access this independent research at www.lehmanlive.com or can call 1-800-2LEHMAN to request a copy of this research.
Investors should consider this report as only a single factor in making their investment decision.
PLEASE SEE ANALYST(S) CERTIFICATION AND IMPORTANT DISCLOSURES BEGINNING ON PAGE 7.
2. Equity Derivatives Strategy | Index Volatility Commentary
A Closer Look at Volatility Selling Strategies
With the VIX hovering around 12, the performance of systematic volatility selling strategies merits closer
scrutiny. Due to the usual implied-realized vol premium, these strategies are popular as a means of
yield enhancement, either on a hedged or unhedged basis.
Figure 1 shows the monthly P/L of a strategy that sells 5% OTM puts on the S&P 500 as of each
monthly expiration date. Over a ten year period, the short puts would have generated a positive yield
but would also have exposed the seller to disproportionate downside risks, such as in 2001 and
2002. The cumulative returns from a strategy that shorts 1-month SPX puts on monthly expirations using
a $100 margin (Figure 2), while still positive, have been tapering off since 2003. This is not surprising
given the low vol environment of the last few years.
Figure 1: Monthly P/L from Short 1-Month SPX Puts (5% OTM) Figure 2: Cumulative P/L –1-Month SPX Put Selling Strategy
20 300
10
0
-10 200
-20
-30
-40
100
-50
-60 Payoff per Cumulative Payoff
Short SPX Put (Short SPX Puts)
-70
-80 0
96
97
98
99
00
01
02
03
04
05
06
96
97
98
99
00
01
02
03
04
05
06
n-
n-
n-
n-
n-
n-
n-
n-
n-
n-
n-
n-
n-
n-
n-
n-
n-
n-
n-
n-
n-
n-
Ja
Ja
Ja
Ja
Ja
Ja
Ja
Ja
Ja
Ja
Ja
Ja
Ja
Ja
Ja
Ja
Ja
Ja
Ja
Ja
Ja
Ja
Source: Lehman Brothers, OptionMetrics, Bloomberg Source: Lehman Brothers, OptionMetrics, Bloomberg
A similar observation can be made about a strategy of selling 5% OTM calls on a monthly basis
(Figure 3). Here the premium compression trend in the last few years seems to be even more
pronounced than for the put-selling strategy. This is partly because the market has rallied steadily over
this period, increasing the odds of the written calls finishing in the money. Another factor explaining
this is the popularity of index call overwriting that puts downward pressure on OTM call implied vols
on index options.
Figure 3: Monthly P/L from SPX Call Writing Strategy (5% OTM) Figure 4: Cumulative P/L – Short 1-Month SPX Calls Strategy
20 160
0 140
120
-20
100
-40
80
-60 60
-80 40 Cumulative Payoff
(Short SPX Calls)
Payoff per Short 20
-100
SPX Call
0
-120
96
97
98
99
00
01
02
03
04
05
06
96
97
98
99
00
01
02
03
04
05
06
n-
n-
n-
n-
n-
n-
n-
n-
n-
n-
n-
Ja
Ja
Ja
Ja
Ja
Ja
Ja
Ja
Ja
Ja
Ja
n-
n-
n-
n-
n-
n-
n-
n-
n-
n-
n-
Ja
Ja
Ja
Ja
Ja
Ja
Ja
Ja
Ja
Ja
Ja
Source: Lehman Brothers, OptionMetrics, Bloomberg Source: Lehman Brothers, OptionMetrics, Bloomberg
September 26, 2006 2
3. Equity Derivatives Strategy | Index Volatility Commentary
Short Variance Swaps
Systematic call or put selling exposes the investor to directional risk. Thus, even if realized volatility
subsequently turns out to be lower than the implied volatility of the written options, the investor could still
lose if the market continues upwards or downwards in a steady grind.
Delta-hedging on a dynamic basis is one means of mitigating this, but is imperfect due to discontinuous
hedging and transaction costs. Variance swaps are instruments that give pure exposure to future
realized volatility (gamma) and eliminate the need for dynamic hedging.
Figure 5 shows the weekly P/L of a strategy that systematically shorts 1-month variance swaps on the
S&P 500. We find that this has largely been a profitable tactic over the past 18 months except for
periods of minor market shocks (such as Apr 05, Oct 05 and May/Jun 06). Furthermore, we can
make the following observations:
• The immediate aftermath of a sell-off is the most attractive time to sell premium, especially if
the investor believes the shock to be short-lived. At such times, the bid on implied vols allows
the variance seller to pick up a higher premium.
• Premiums have been declining over the last two months and for the NDX (Figure 6), are
barely at levels where the investor gets sufficiently compensated for the short gamma risk. In
spite of SPX variance having cheapened considerably relative to NDX, variance selling has
worked better for the SPX only because of abysmally low vols in the latter.
• In the last few years, the occasional spike in realized volatility has been milder than in the
period ending in 2002. Focusing on a shorter history ignores the disproportionate risks this
strategy exposes investors to, in the event of a market crash.
At present, tail risks on account of macro factors seem to have receded somewhat, with the inflation
picture looking less ominous and last week’s Philadelphia Fed survey causing the market to assign a
one-third probability to a Fed ease by year-end. However, with earnings season coming up in a few
weeks, and lack of clarity around the effect of slowing growth on corporate profits, we do not believe
premium selling strategies offer an attractive risk-reward at this point.
Figure 5: Weekly Payoff From Short 1-Month SPX Variance Swaps1 Figure 6: Short Variance Swap Payoff for NDX
2,000 2,500
Weekly P/L - Short SPX 2,000
1,500
Variance Swap 1,500
Weekly P/L (per Mn Vega)
1,000 1,000
500 500
0
0
-500
-500 -1,000
-1,000 -1,500
-2,000 Weekly P/L - Short NDX
-1,500 -2,500 Variance Swap
-2,000 -3,000
06
05
06
05
06
05
06
05
06
05
05
05
05
06
05
05
ay
ar
ar
ct
ay
g
n
l
ar
ar
ec
ct
g
l
n
ec
Ju
Ju
Au
Ju
Au
Ju
O
M
M
O
M
M
M
M
D
28
D
28
21
21
24
03
10
24
03
10
12
19
12
19
30
30
Week Ending Week Ending
Source: Lehman Brothers, Bloomberg Source: Lehman Brothers, Bloomberg
1
In all cases, we assume mid-market execution and ignore the effect of bid-ask spreads on the respective strategies.
September 26, 2006 3
4. Equity Derivatives Strategy | Index Volatility Commentary
Figure 7: S&P 500 Index Volatility Summary
S&P 500 Implied and Realized Volatility S&P 500 Weekly Returns vs Vol Changes
20% 4%
3%
2%
15%
1%
0%
10% -1%
-2%
-3%
5%
-4%
5
6
6
6
05
5
06
6
06
5
6
6
0
-0
0
-0
0
-0
-0
r-0
l-0
v-
p-
n-
b-
n-
g-
ay
ec
ar
ct
Ju
Ap
No
Fe
Se
Ja
Ju
Au
O
M
6
06
06
6
6
06
06
06
6
6
M
D
-0
-0
-0
r-0
l-0
n-
b-
n-
g-
p-
ay
ar
ar
Ju
Ap
Ja
Fe
Ju
Au
Se
M
M
M
SPX Implied Vol (3-month) SPX Realized Vol (3-month)
SPX Implied Vol (1-month) SPX Realized Vol (1-month) SPX Weekly Return SPX Weekly Change in Implied Vol (1m)
Source: Lehman Brothers, OptionMetrics Source: Lehman Brothers, OptionMetrics, Bloomberg
Note: 1-month and 3-month implied volatility are interpolated volatilities for rolling maturities. 3-month realized volatility is calculated as the standard deviation of daily log returns over a 66 trading day historical window. 1-
month realized volatility uses 22 days. Weekly spot returns in the index are compared with weekly changes in 1-month ATM implied volatility.
S&P 500 Put-Call Skew S&P 500 Skew (1-week Changes)
7% 3.0%
6% SPX 30-delta Skew (3-month)
2.0%
SPX 30-delta Skew (1-month)
5%
1.0%
4%
0.0%
3%
2% -1.0%
1%
-2.0%
0%
6
6
7
07
7
08
8
6
-0
-0
-0
-0
-0
-0
n-
n-
ov
ec
ar
ec
c
ct
De
Ju
Ju
O
M
N
D
D
5
06
6
06
6
6
05
5
05
6
06
6
-0
-0
-0
0
r-0
0
l-0
-
p-
c-
n-
b-
n-
g-
ov
ay
ar
ct
SPX 1w Imp Vol Chg (95%) SPX 1w Imp Vol Chg (100%) SPX 1w Imp Vol Chg (105%)
Ju
Ap
De
Fe
Se
Ja
Ju
Au
O
M
M
N
Source: Lehman Brothers, OptionMetrics Source: Lehman Brothers
Note: The 30-delta skew is calculated as the difference between the 30-delta put and 30-delta call implied volatililty. Weekly changes of implied volatility at the 95% and 105% strike versus the at-the-money strike
provide a measure of richening/cheapening of skew.
Term Structure of ATM Implied Volatility (S&P 500) History of S&P 500 Term Spread
18% 3%
17%
2%
16%
15% 1%
14%
0%
13%
12% -1%
11% Last 1-wk Back 1-mo Back SPX 12M-3M Term Spread
-2%
10% SPX 3M-1M Term Spread
9% -3%
6
6
7
07
7
08
8
6
5
06
6
06
6
6
05
5
5
6
06
6
-0
-0
-0
-0
-0
-0
0
-0
-0
-0
0
r-0
0
l-0
n-
n-
-
v-
p-
n-
b-
n-
g-
ar
ov
ec
ec
ec
ct
ay
ec
ar
ct
Ju
Ap
Ju
Ju
No
Se
Ja
Fe
Ju
Au
O
O
M
M
N
D
D
D
M
D
Source: Lehman Brothers
Note: The volatility term structure shows implied volatility for ATM strike options for each listed expiration. The term spread history plots the implied vol difference between 12-month and 3-month options and that
between 3-month and 1-month options for the last 1 year.
Source: Lehman Brothers, OptionMetrics, Bloomberg, FAME
September 26, 2006 4
5. Equity Derivatives Strategy | Index Volatility Commentary
Figure 8: Nasdaq 100 Index Volatility Summary
Nasdaq 100 Implied and Realized Volatility Nasdaq 100 Weekly Returns vs Vol Changes
25% 8%
6%
20% 4%
2%
0%
15%
-2%
-4%
10%
-6%
5
6
6
6
05
5
06
6
06
5
6
6
0
-0
0
-0
0
-0
-0
r-0
l-0
v-
p-
n-
b-
n-
g-
ay
ec
ar
ct
Ju
Ap
No
Fe
Se
Ja
Ju
Au
O
M
6
06
06
6
6
06
06
06
6
6
M
D
-0
-0
-0
r-0
l-0
n-
b-
n-
g-
p-
ay
ar
ar
Ju
Ap
Ja
Fe
Ju
Au
Se
M
M
M
NDX Implied Vol (3-month) NDX Realized Vol (3-month)
NDX Implied Vol (1-month) NDX Realized Vol (1-month) NDX Weekly Return NDX Weekly Change in Implied Vol (1m)
Source: Lehman Brothers, OptionMetrics Source: Lehman Brothers, OptionMetrics, Bloomberg
Note: 1-month and 3-month implied volatility are interpolated volatilities for rolling maturities. 3-month realized volatility is calculated as the standard deviation of daily log returns over a 66 trading day historical window. 1-
month realized volatility uses 22 days. Weekly spot returns in the index are compared with weekly changes in 1-month ATM implied volatility.
Nasdaq 100 Put-Call Skew Nasdaq 100 Skew (1-week Changes)
6% 0.0%
NDX 30-delta Skew (3-month)
5%
NDX 30-delta Skew (1-month)
4%
3% -1.0%
2%
1%
0%
-2.0%
-1%
6
6
7
07
7
6
-0
-0
-0
-0
-0
n-
ov
ec
ar
ec
ct
Ju
O
M
N
D
D
5
06
6
06
6
6
05
5
05
6
06
6
-0
-0
-0
0
r-0
0
l-0
-
p-
c-
n-
b-
n-
g-
ov
ay
ar
ct
NDX 1w Imp Vol Chg (95%) NDX 1w Imp Vol Chg (100%) NDX 1w Imp Vol Chg (105%)
Ju
Ap
De
Fe
Se
Ja
Ju
Au
O
M
M
N
Source: Lehman Brothers, OptionMetrics Source: Lehman Brothers
Note: The 30-delta skew is calculated as the difference between the 30-delta put and 30-delta call implied volatililty. Weekly changes of implied volatility at the 95% and 105% strike versus the at-the-money strike
provide a measure of richening/cheapening of skew.
Term Structure of ATM Implied Volatility (Nasdaq 100) History of Nasdaq 100 Term Spread
21% 3%
20% 2%
19%
1%
18%
0%
17%
Last 1-wk Back 1-mo Back NDX 12M-3M Term Spread
-1%
16%
NDX 3M-1M Term Spread
15% -2%
6
6
7
07
7
6
5
06
6
06
6
6
05
5
5
6
06
6
-0
-0
-0
-0
-0
0
-0
-0
-0
0
r-0
0
l-0
n-
-
v-
p-
n-
b-
n-
g-
ar
ov
ec
ec
ct
ay
ec
ar
ct
Ju
Ap
Ju
No
Se
Ja
Fe
Ju
Au
O
O
M
M
N
D
D
M
D
Source: Lehman Brothers
Note: The volatility term structure shows implied volatility for ATM strike options for each listed expiration. The term spread history plots the implied vol difference between 12-month and 3-month options and that
between 3-month and 1-month options for the last 1 year.
Source: Lehman Brothers, OptionMetrics, Bloomberg, FAME
September 26, 2006 5