Downloaded 21 times

![Wind
energy
– challenges
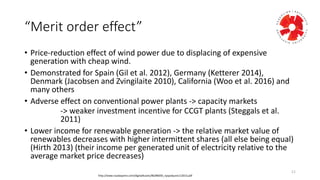
• “Merit
order
effect”
• Increased
price
volatility
• Increased
wear
and
tear
• Balancing
issues
• Towards
the
European
Balancing
Market
• “[…]
a
cross
border
balancing
market
will
help
to
counteract
the
effects
of
intermittent
generation
and
allow
the
integration
of
more
renewable
energy
sources”.
9](https://image.slidesharecdn.com/04ewawindchallengessiteenergyday-161014101104/85/Wind-energy-challenges-9-320.jpg)

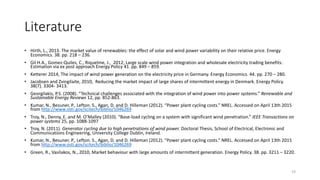

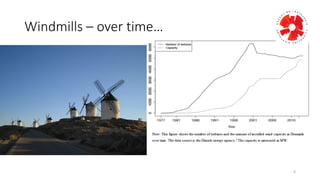
The document discusses the challenges and statistics of wind energy in Europe, outlining the increasing capacity and share of wind power in electricity generation, particularly in Denmark. It highlights issues such as price volatility, wear and tear on conventional power plants, and the integration of renewable sources into the energy market. The document also references the need for cross-border balancing markets to manage the intermittent nature of wind generation and improve overall system efficiency.


