Download to read offline
![VARIABLE RENEWABLES
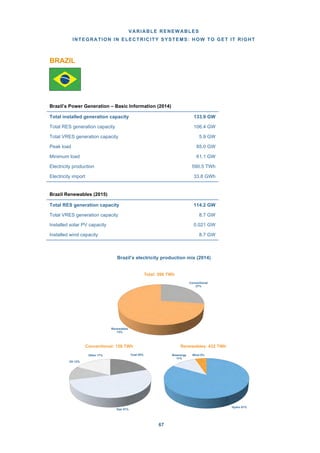
INTEGRATION IN ELECTRICITY SYSTEMS: HOW TO GET IT RIGHT
3
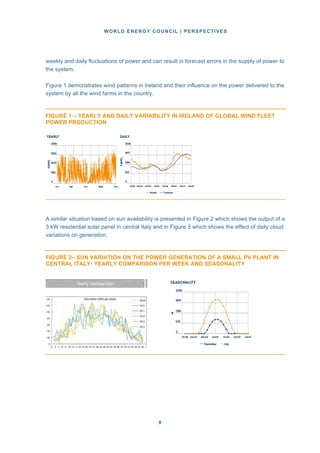
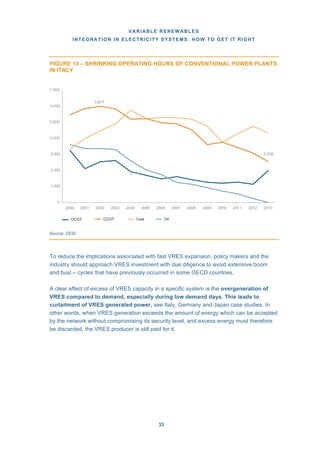
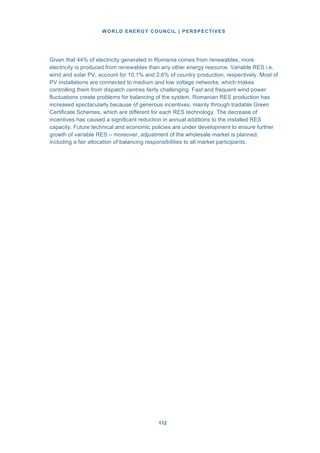
5. THE EXAMPLE OF THE EUROPEAN UNION (EU) HIGHLIGHTS THE
CONSEQUENCES OF REDUCTIONS IN SUBSIDIES and other support schemes
for investment in renewables: as subsidies decreased, the EU’s share of global solar
PV installed capacity dropped over the past four years from 75% to 41%, the share
of wind from 41% to 33%.
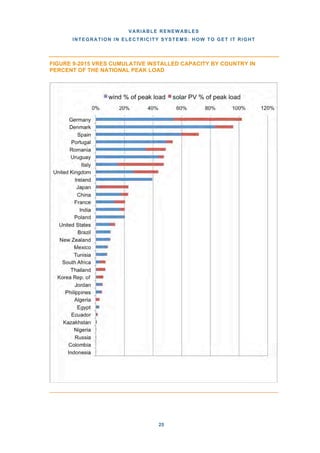
6. A RIGHT LOCATION WITH HIGH WIND OR SOLAR LOAD FACTORS AND LOW
GRID CONNECTION COSTS is the key to success for new, large variable
renewables projects.
7. A REAL CHALLENGE FOR VARIABLE RENEWABLES INTEGRATION IS TO
RAPIDLY MANAGE THE IMPLICATIONS OF VARIABLE NATURE OF WIND AND
SUN.
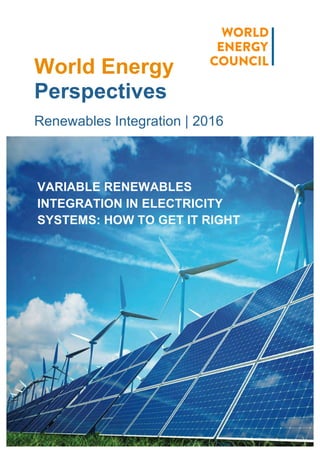
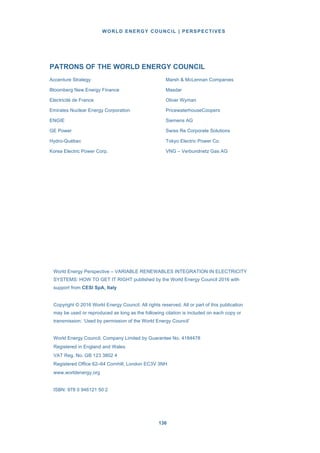
RENEWABLES IN THE GLOBAL ENERGY SYSTEM
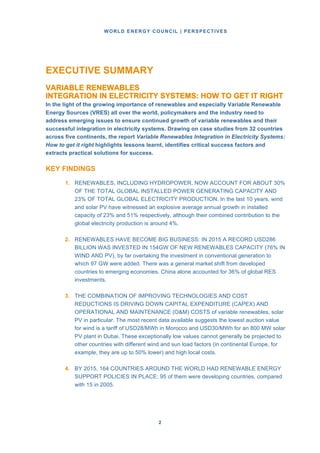
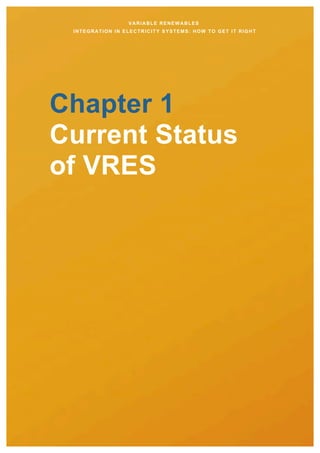
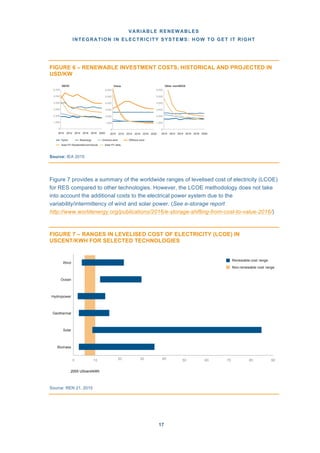
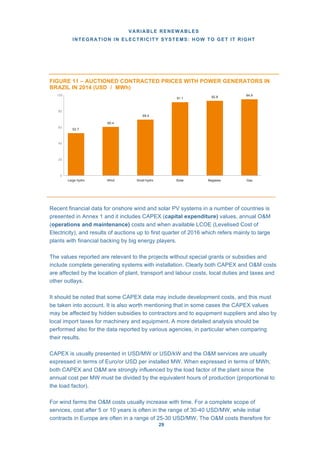
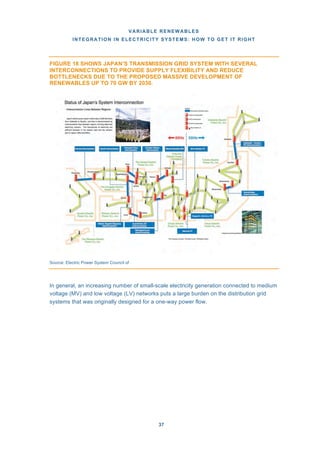
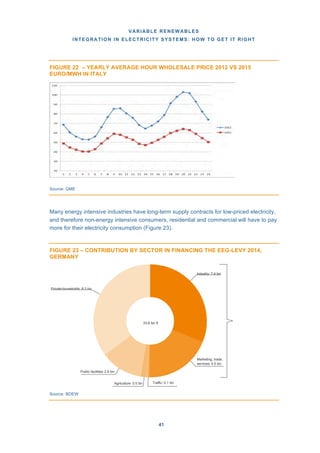
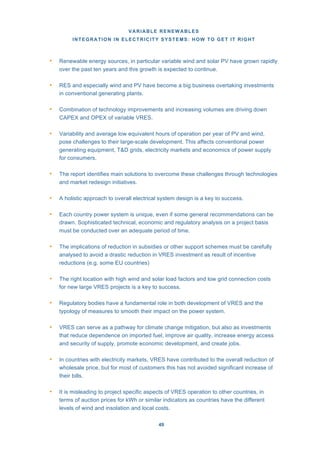
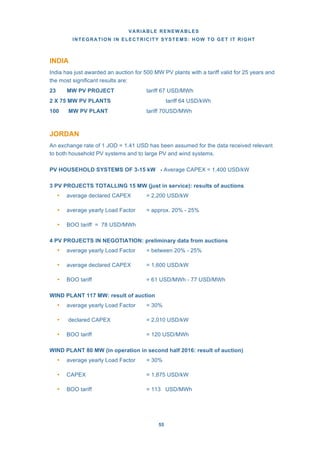
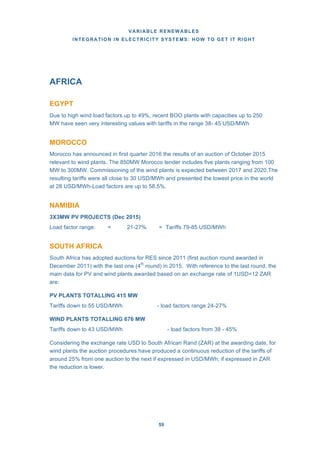
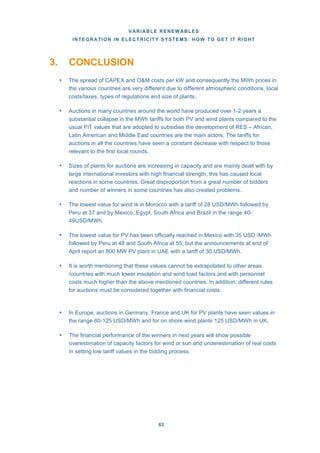
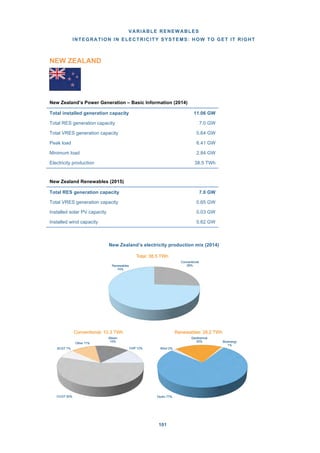
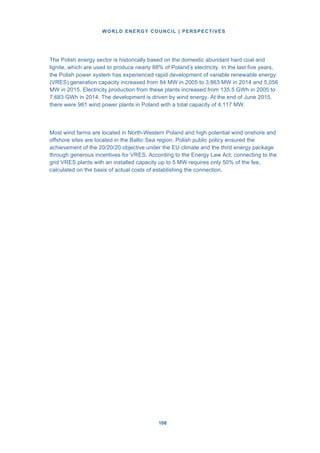
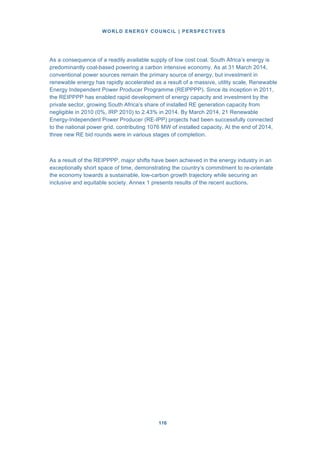
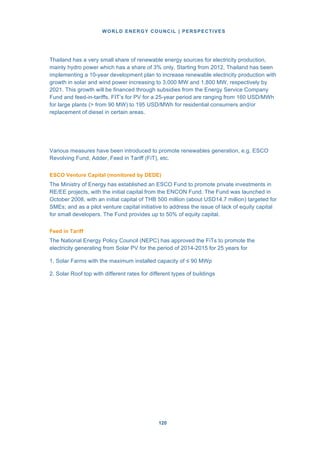
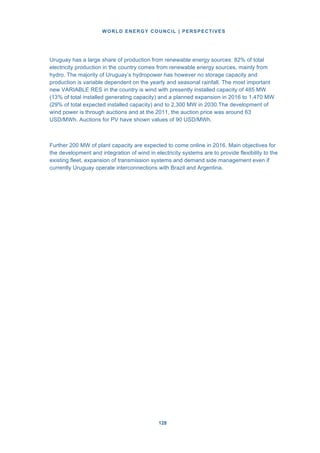
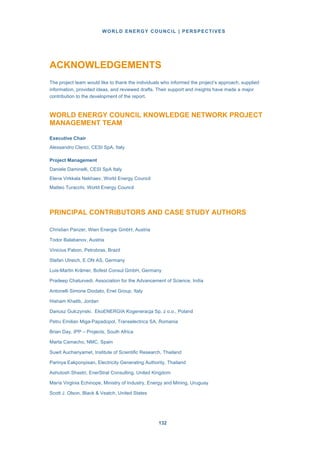
World global power capacity additions and energy production by source 2004-2014.
Source: CESI S.p.A., based on REN21 2015
Source Installed Capacity
2004 [GW] and
(%) share
Installed Capacity
2014 [GW] and
(%) share
Average
Annual
Growth
Rate (%)
2014 Production Average
[TWh] and (%) share Equivalent
Operating
Hours [h]
Hydro 715GW 18.8% 1,055 GW 17.1% 4% 3,898TWh 16.6% 3,694
Wind 48GW 1.3% 370GW 6.0% 23% 728TWh 3.1% 1,967
Biomass 39GW 1.0% 93GW 1.5% 9% 423TWh 1.8% 4,545
Solar 3GW 0.1% 181GW 2.9% 51% 211TWh 0.9% 1,168
Geothermal 9GW 0.2% 13GW 0.2% 4% 94TWh 0.4% 7,225
Total
Renewables
814GW 21.4% 1,712GW 27.7% 8% 5,353TWh 22.8% 3,127
Total Conventional
(Oil, Gas, Coal)
and Nuclear
2,986GW 78.6% 4,468GW 72.3% 4% 18,127TWh 77.2% 4,057
TOTAL 3,800GW 100% 6,180GW 100% 5% 23,480TWh 100% 3,799](https://image.slidesharecdn.com/renewablesfullreportsmcpack-161221110155/85/Renewablesfullreportsmcpack-5-320.jpg)
![WORLD ENERGY COUNCIL | PERSPECTIVES
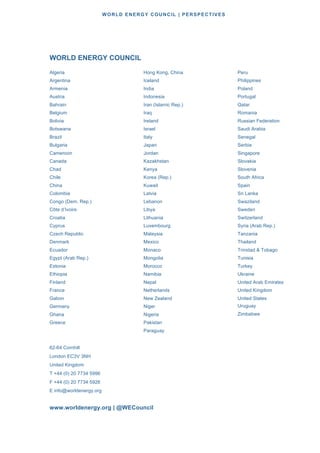
44
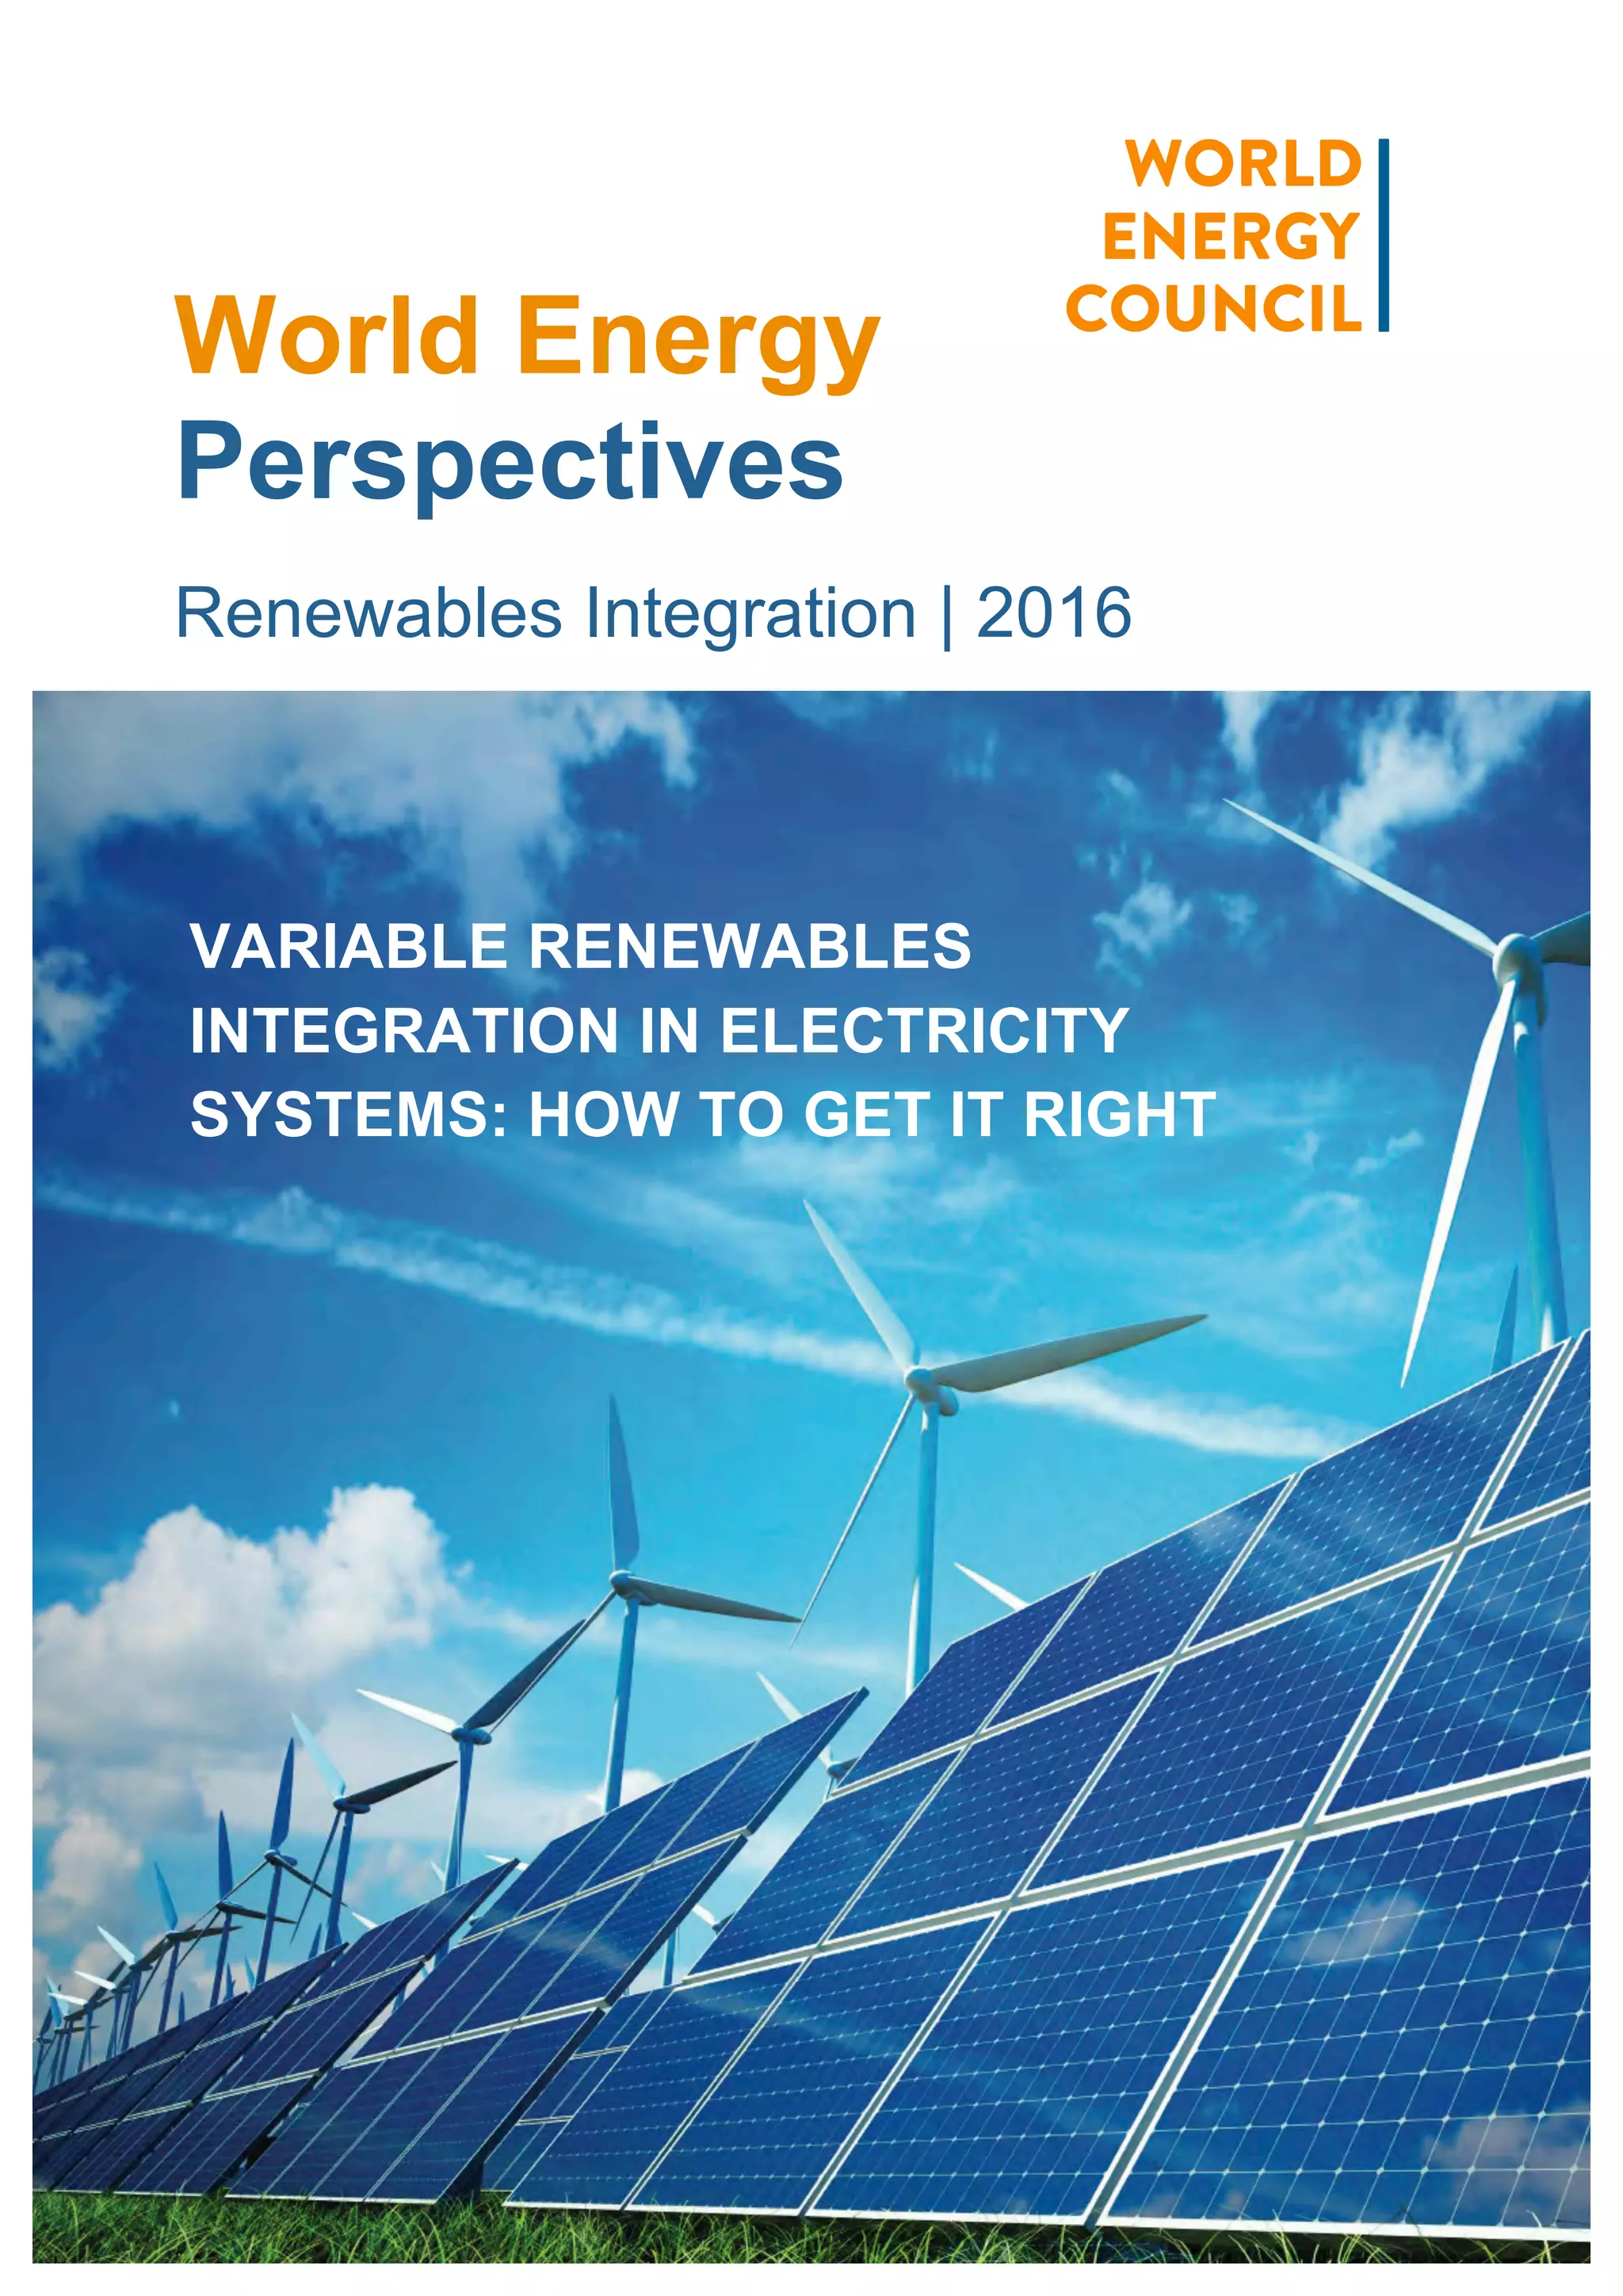
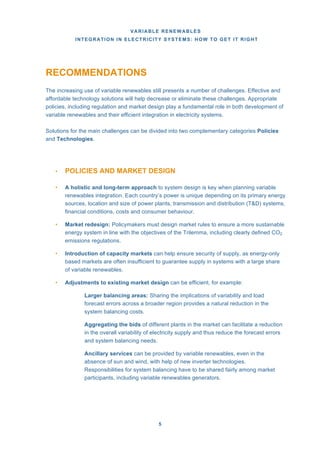
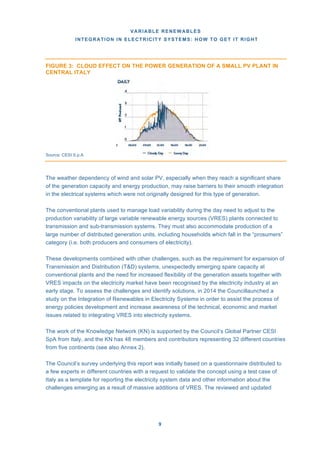
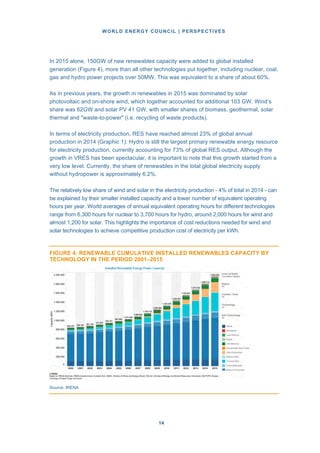
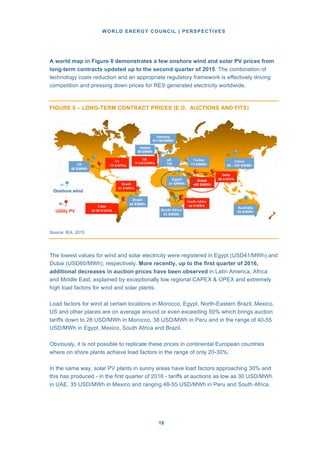
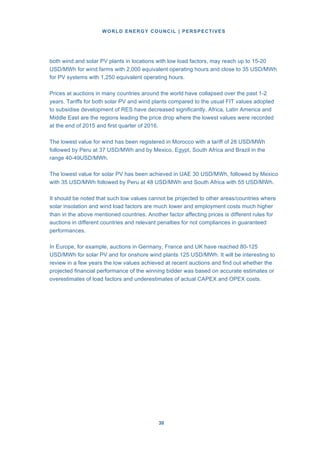
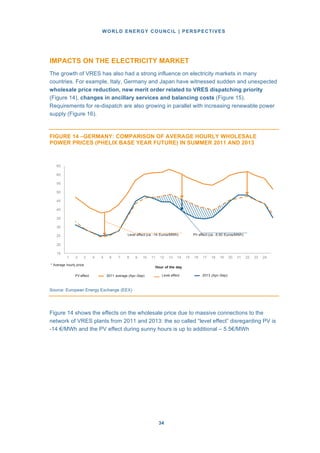
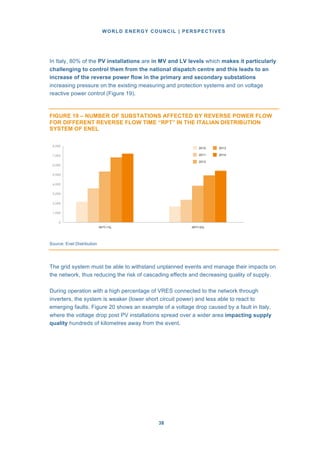
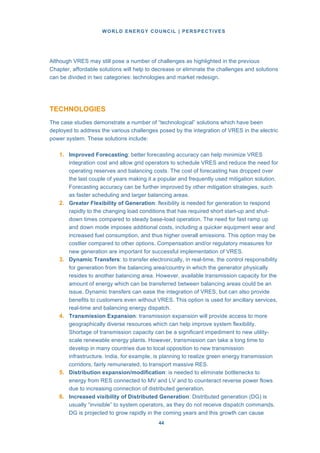
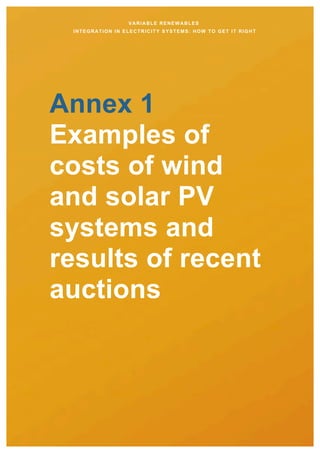
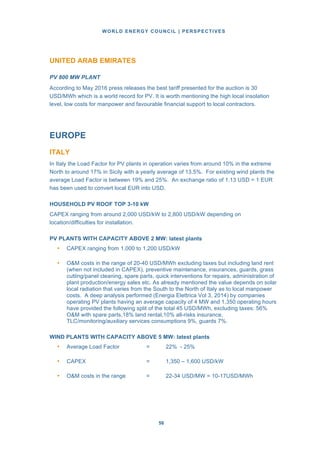
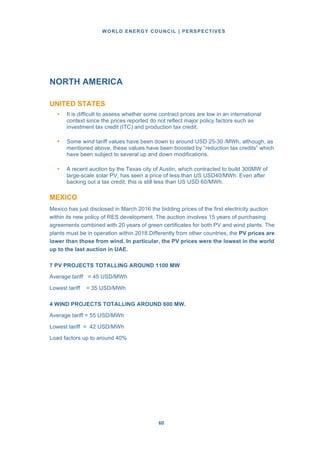
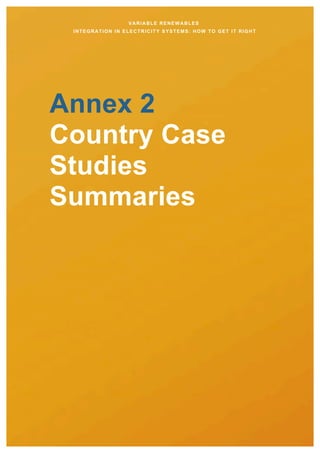
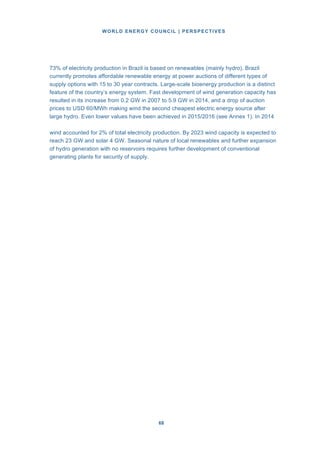
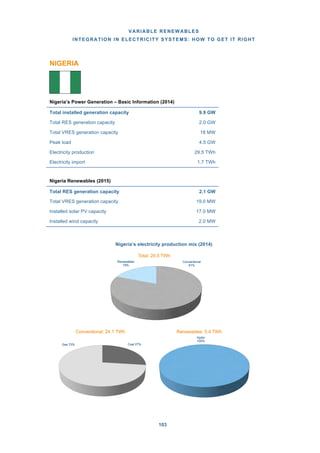
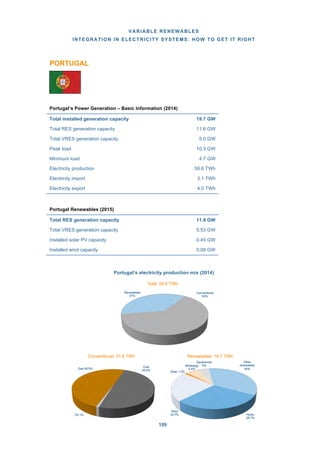
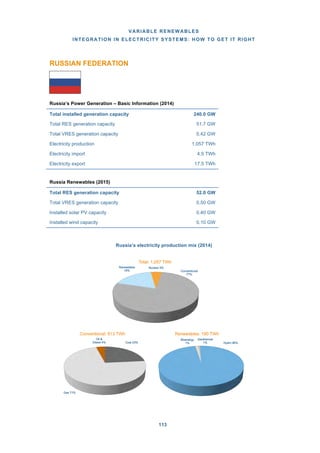
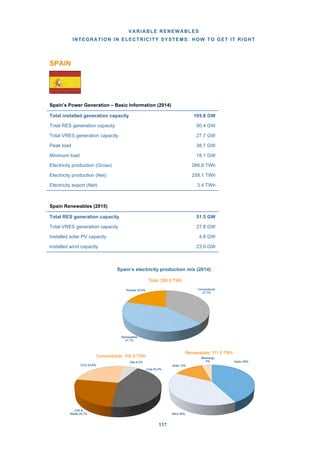
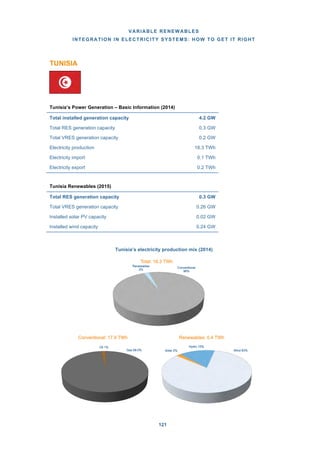
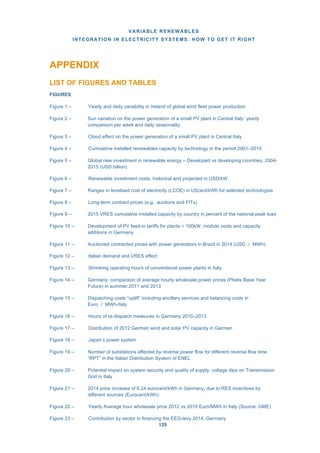
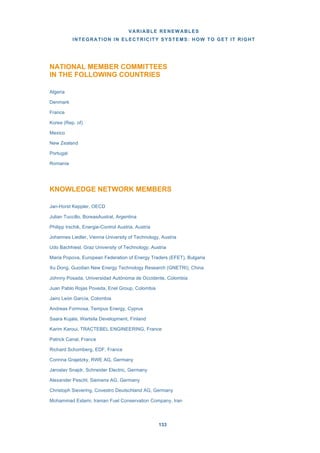
The graphs below illustrate the effects of wind variability in Ireland on the global wind fleet
power production and the variations of sun on a small PV installation in central Italy.
YEARLY AND DAILY VARIABILITY IN IRELAND OF GLOBAL WIND FLEET POWER
PRODUCTION
SEASONAL AND DAILY VARIATION OF THE POWER GENERATION FOR A SMALL PV
PLANT IN CENTRAL ITALY
Source: CESI S.p.A
P[MW]
P[MW]
YEARLY
1500
1000
500
DAILY
1875
1250
625
0
Jan Apr Jun Sept Dec
0
0:00 03:23 06:47 10:10 13:34 16:58 20:21 23:45
Actual Forecast
0 08:00 2 24:00 18:00 2
J
W[M]
YE
W[M]
RAYE LYYL
1500
1000
W]P[M]W
DAILY
1875
1250
PP
500
0
nJa rAp nJu
625
tpSe cDe
0
000: 2303: 06:4706: 1010: 3413: 5816: 2120: 4523:
Actual stcareoF
W
kWProduced
03:23 2
SEASONALITY
2500
1875
1250
625
0
DAILY
4
3
2
1
0
01:00 04:00 08:00 12:00 16:00 20:00 24:00 06:00 09:00 12:00 15:00 18:00 21:00
Source: CESI S.p.A
December July Cloudy Day Sunny Day
W
SEA
W
TYILANSOSEA
2500
1875
1250
kWdecudoPr
4
DAILYYL
3
2
625
0
0001: 0008:0004: 0012: 16:
Source: CESI Ap.S.
rebmceeD ulJ
1
0
0000 0020: 0024: 06: 0009:
Cloudyyul
0012: 0015: 0018: 0021:
Cloudy Day ynnSu Day](https://image.slidesharecdn.com/renewablesfullreportsmcpack-161221110155/85/Renewablesfullreportsmcpack-6-320.jpg)
![VARIABLE RENEWABLES
INTEGRATION IN ELECTRICITY SYSTEMS: HOW TO GET IT RIGHT
13
By 2015, 164 out of 196 countries in the world had set renewable energy targets, and 138
countries had renewable energy support policies in place. The recent wave of energy
policies in support of RES has been led by 95 developing and emerging economies, an
increase from only 15 countries in 2005.
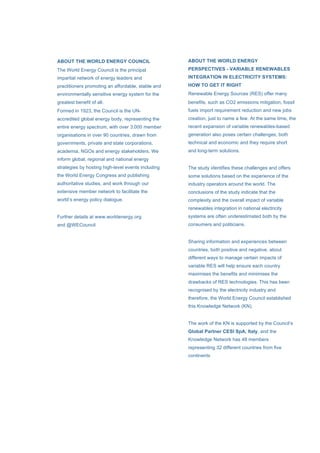
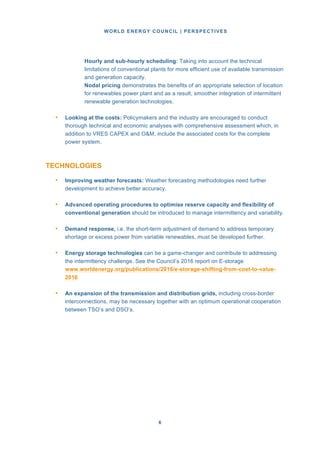
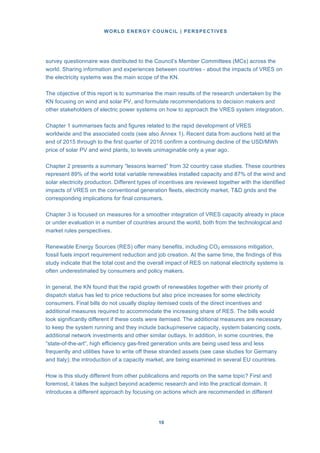
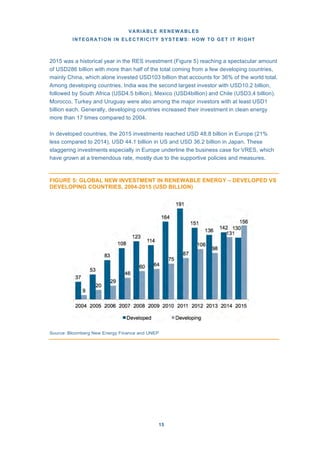
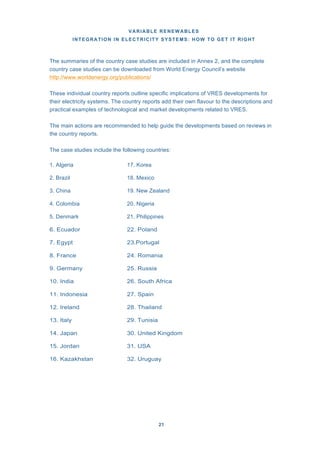
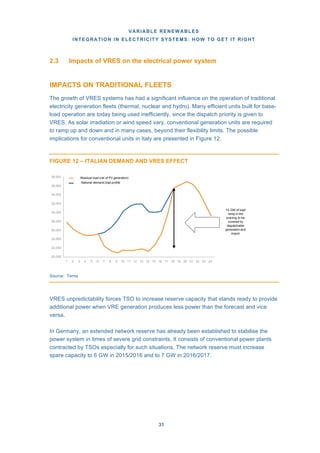
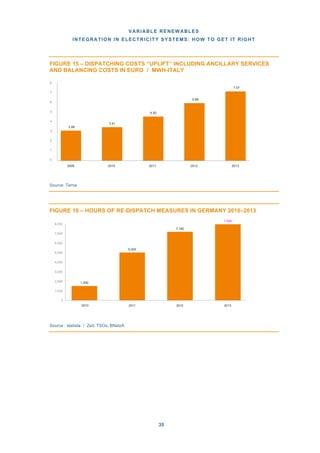
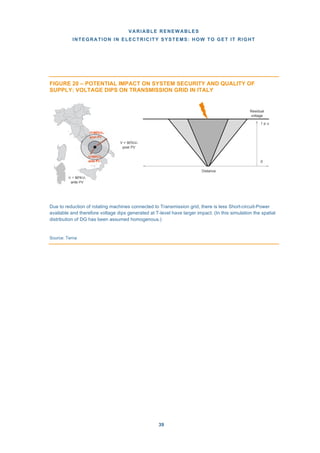
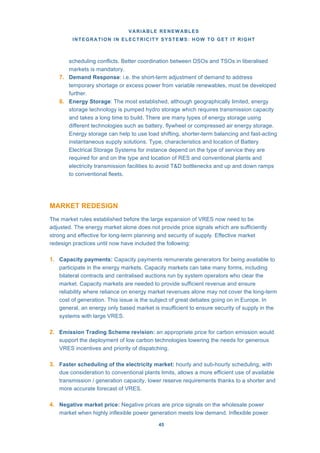
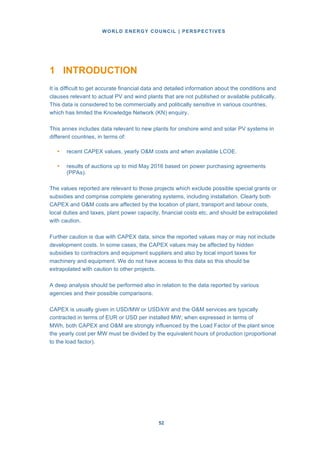
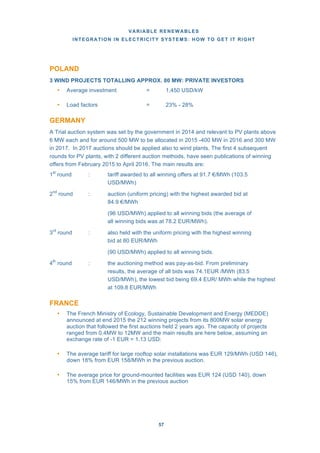
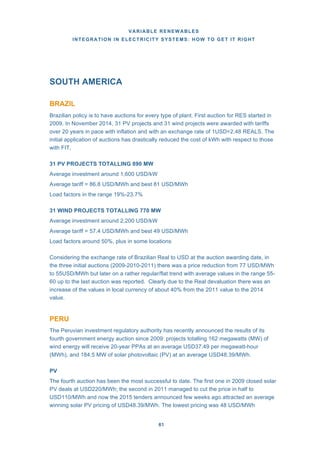
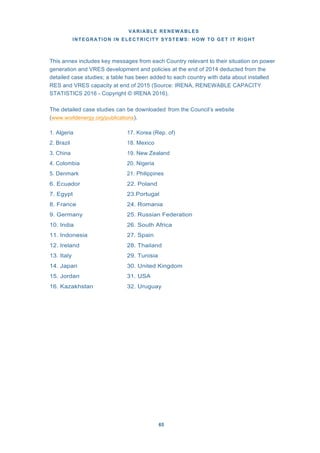
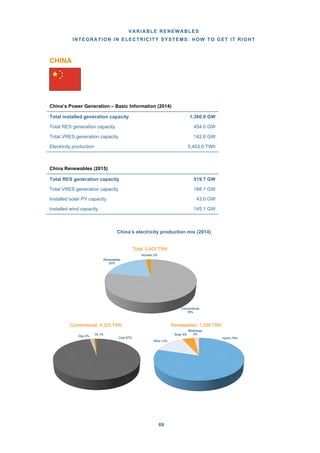
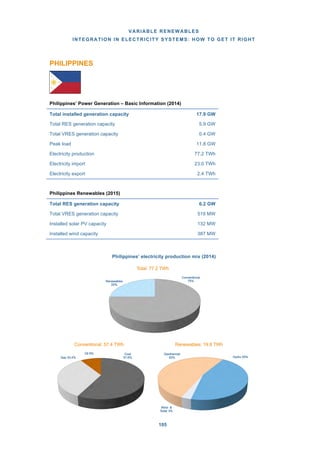
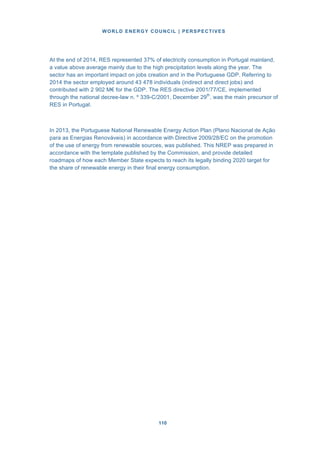
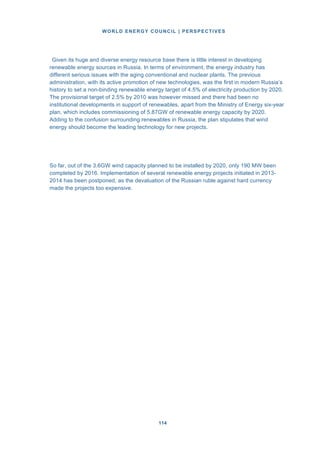
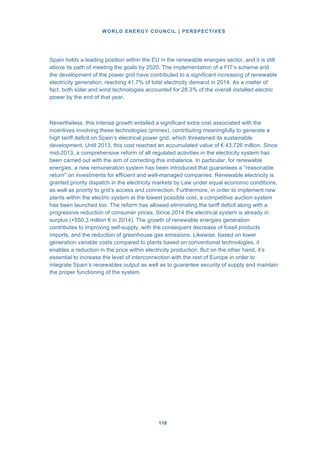
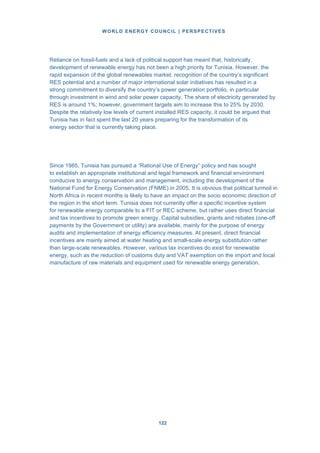
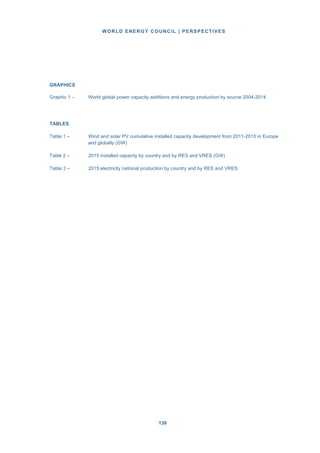
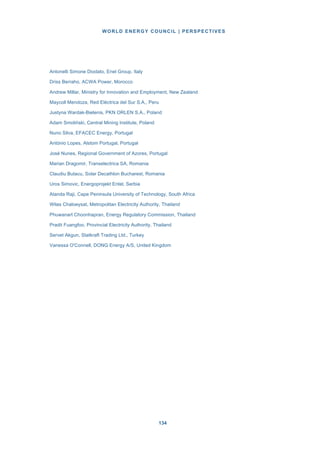
The global installed RES capacity has more than doubled over the past ten years, from
814GW in 2004 to 1,712GW by the end of 2014. As Graphic 1 shows, this growth was
mainly driven by wind and solar power which increased from 48 GW and 3 GW in 2004 to
370 GW of wind and 181 GW of solar power in 2014, with an average annual growth rate of
23% and 51.0%, respectively.
GRAPHIC 1 - WORLD GLOBAL POWER CAPACITY ADDITIONS AND ENERGY
PRODUCTION BY SOURCE 2004-2014
2004
INSTALLED
CAPACITY 2014
INSTALLED
CAPACITY
2004
INSTALLED
CAPACITY 2014
INSTALLED
CAPACITY
AVERAGE
ANNUAL
GW
GROWTH
RATE
2014
PRODUCTION
[TWh]
AND SHARE
OF TOTAL (%)
Conventional: 2,986 GW (78.6%)
(coal, gas, oil)
and nuclear
Renewables: 814 GW (21.4%)
Conventional: 4,468 GW (72.3%)
(coal, gas, oil)
and nuclear
Renewables: 1,712 GW (27.7%)
WIND: 48.0 GW
Share of total: 1.3%
SOLAR PV: 3.0 GW
Share of total: 0.1%
WIND: 370 GW
Share of total: 6.0%
SOLAR PV: 181 GW
Share of total: 2.9%
2004 – 2014
Total conventional: 4%
Total renewables: 8%
Wind: 23%
Solar PV: 51%
Conventional: 18,127 TWh (77.2%)
Renewables: 5,353 TWh (22.8%)*
Wind: 728 TWh (3.1%)
Solar PV: 211 TWh (0.8%)
TOTAL: 3,800 GW
TOTAL: 6,180 GW
Total wind & solar PV: 51.0GW
share of total: 1.4%
Total wind & solar PV: 551.0 GW
share of total: 8.9%
Total average annual growth: 5%
Total 23,480 TWh
*wind and solar pv are also included
Graphic Source: CESI S.p.A., based on REN21, 2015](https://image.slidesharecdn.com/renewablesfullreportsmcpack-161221110155/85/Renewablesfullreportsmcpack-15-320.jpg)


![VARIABLE RENEWABLES
INTEGRATION IN ELECTRICITY SYSTEMS: HOW TO GET IT RIGHT
23
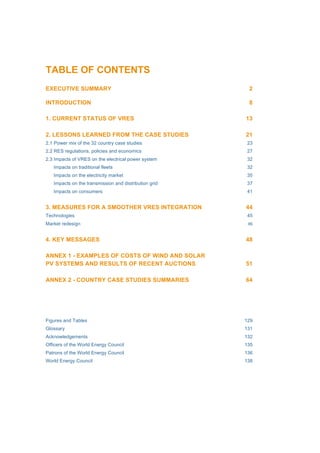
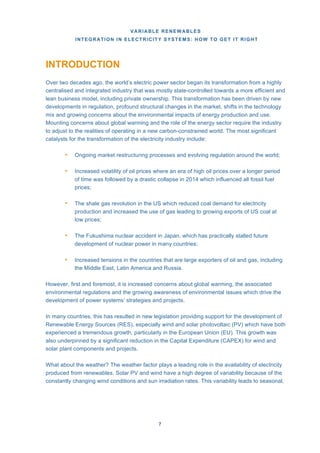
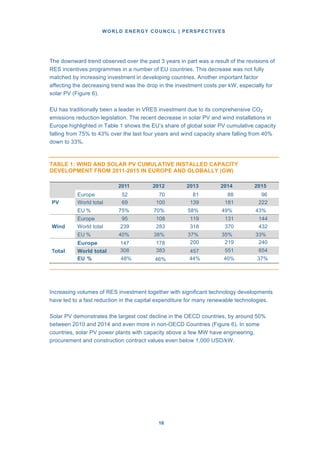
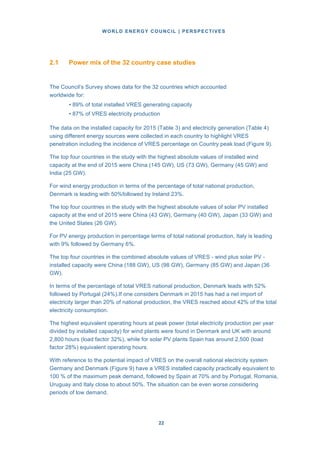
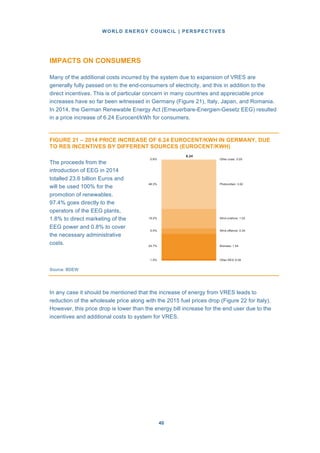
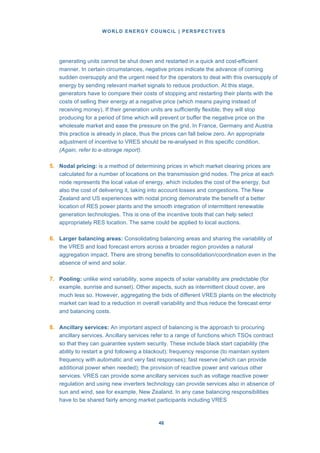
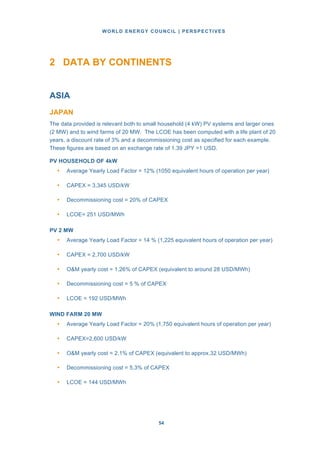
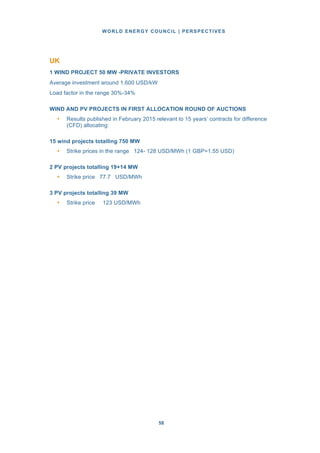
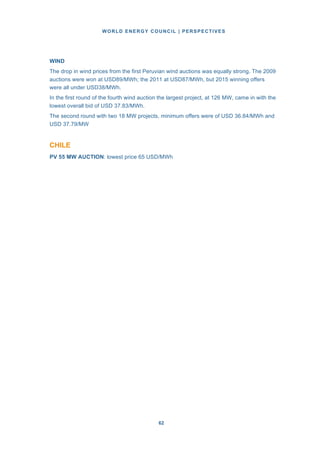
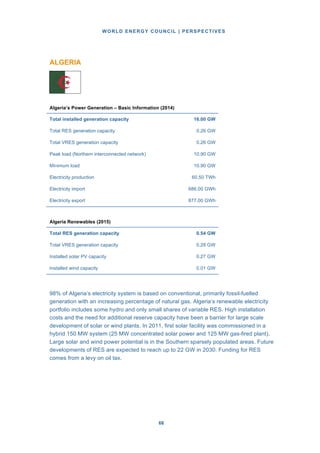
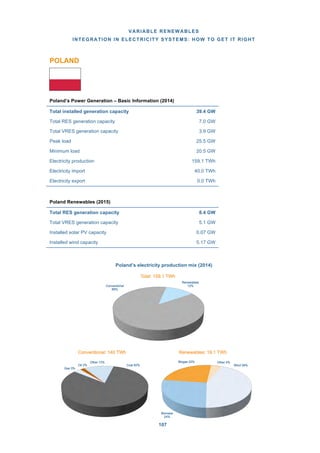
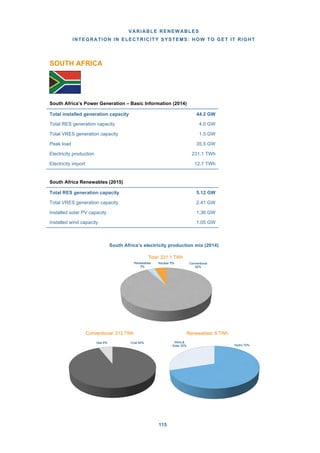
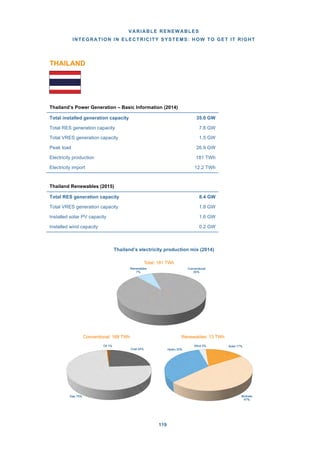
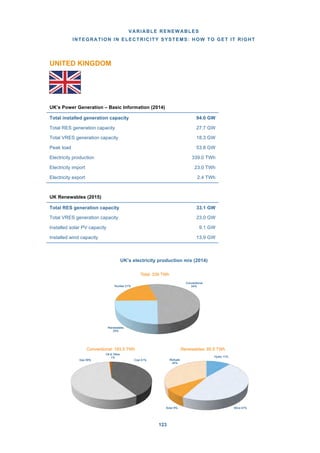
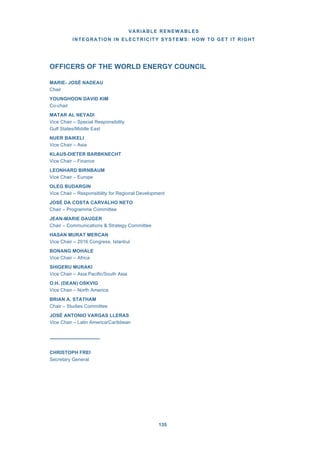
TABLE 2 – 2015 INSTALLED CAPACITY BY COUNTRY AND BY RES AND VRES (GW)
Continent Country
Peak
Demand
[GW]
RES
installed
capacity
[GW]
VRES
installed
capacity
[GW]
Wind
installed
capacity
[GW]
Solar PV
installed
capacity
[GW]
AFRICA
Algeria 10.9 0.5 0.3 0.0 0.3
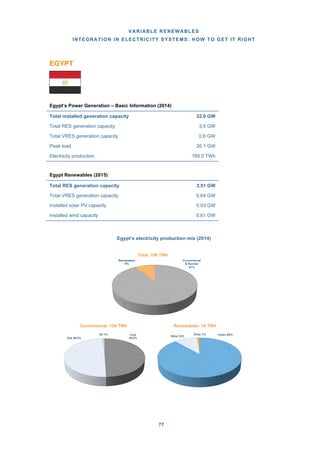
Egypt 26.1 3.5 0.6 0.6 0.0
Nigeria 4.5 2.1 0.0 0.0 0.0
South Africa 35.5 5.1 2.5 1.1 1.4
Tunisia 3.3 0.3 0.2 0.2 0.0
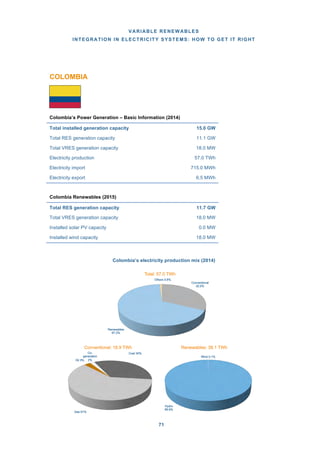
Colombia 9.6 11.7 0.0 0.0 0.0
AMERICA
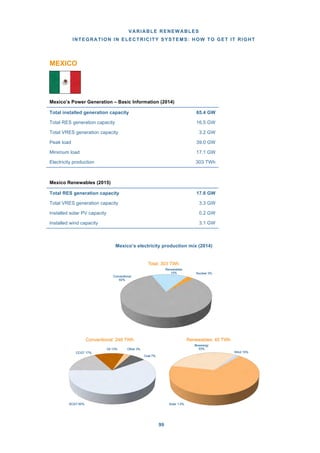
Mexico 39.0 17.6 3.3 3.1 0.2
United States 723.0 219.3 98.1 72.6 25.5
Brazil 85.0 114.2 8.7 8.7 0.0
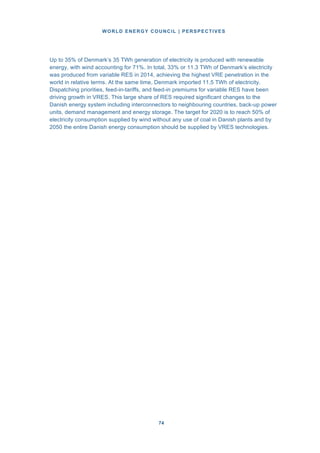
Ecuador 3.5 2.6 0.0 0.0 0.0
Uruguay 1.9 2.7 0.9 0.8 0.1
ASIA
China 830.0 519.7 188.2 145.1 43.1
India 148.2 82.1 30.1 25.1 5.0
Indonesia 53.8 8.3 0.0 0.0 0.0
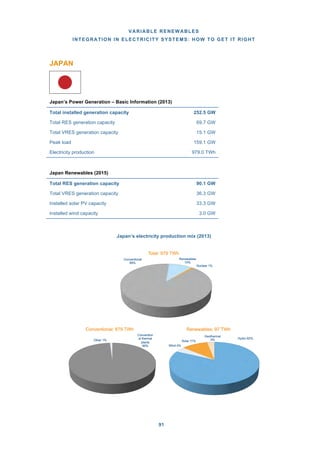
Japan 159.1 90.1 36.3 3.0 33.3
Jordan 3.0 0.2 0.1 0.1 0.0
Kazakhstan 15.0 2.8 0.2 0.1 0.1
Philippines 11.8 6.2 0.5 0.4 0.1
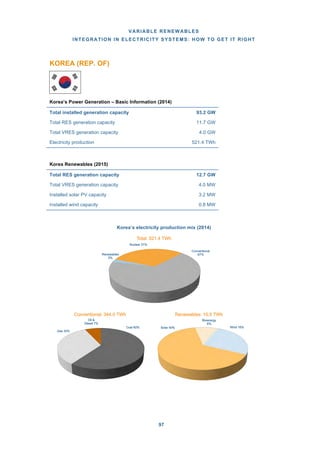
Korea Rep. of 76.5 12.7 4.1 0.9 3.2
Thailand 26.9 8.4 1.8 0.2 1.6
EUROPE
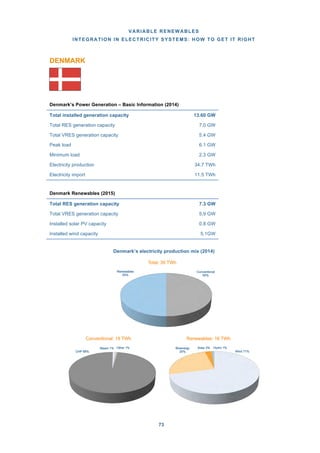
Denmark 6.1 7.3 5.9 5.1 0.8
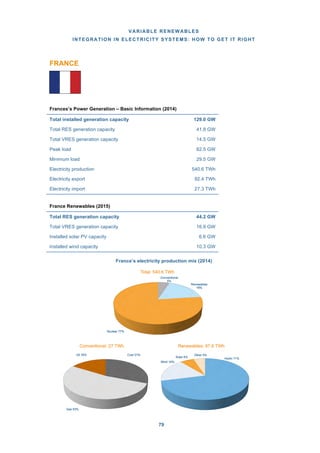
France 82.5 44.3 16.9 10.4 6.5
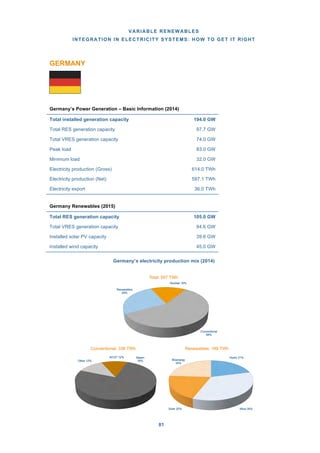
Germany 83.0 105.0 84.6 45.0 39.6
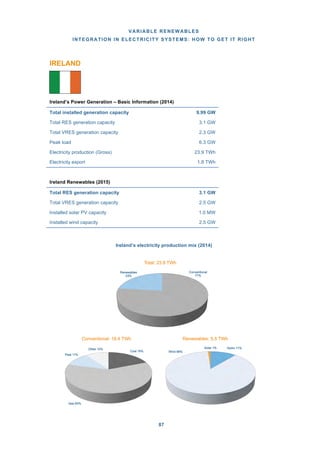
Ireland 6.3 3.1 2.5 2.5 0.0
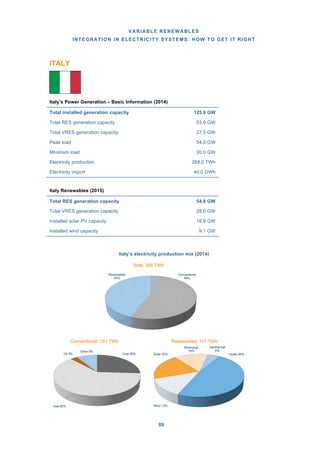
Italy 59.0 54.8 28.0 9.1 18.9
Poland 25.5 8.4 5.2 5.1 0.1
Portugal 10.3 11.9 5.6 5.1 0.5
Romania 9.3 11.3 4.5 3.2 1.3
Spain 38.7 51.5 27.8 23.0 4.8
United Kingdom 52.5 33.1 23.0 13.9 9.1
Russia 155.0 52.0 0.5 0.1 0.4
OCEANIA New Zealand 6.4 7.0 0.7 0.6 0.0
TOTAL 32 Countries 1,499.7 581.4 385.1 195.9
2015 TOTAL WORLD 1,985.1 654.3 431.9 222.4
% 32 Countries of TOTAL 76% 89% 89% 88%
Source: Country Cases and public sources](https://image.slidesharecdn.com/renewablesfullreportsmcpack-161221110155/85/Renewablesfullreportsmcpack-25-320.jpg)
![WORLD ENERGY COUNCIL | PERSPECTIVES
2424
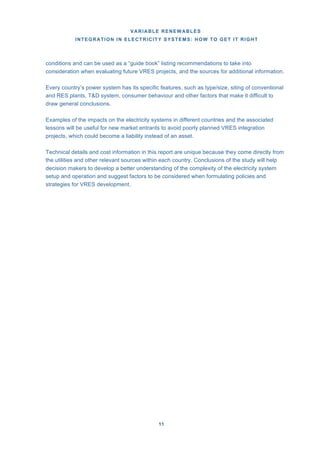
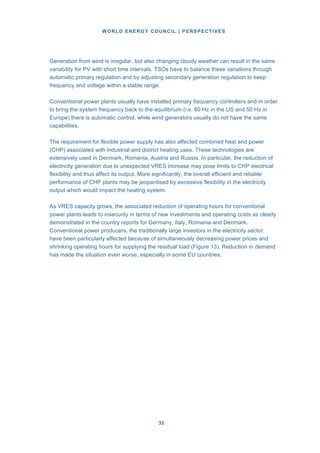
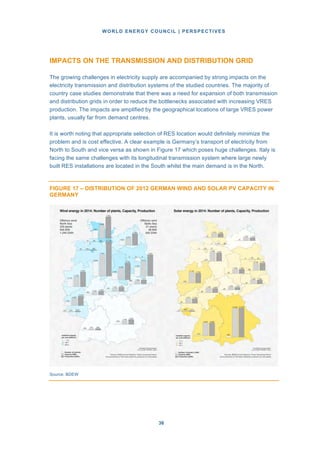
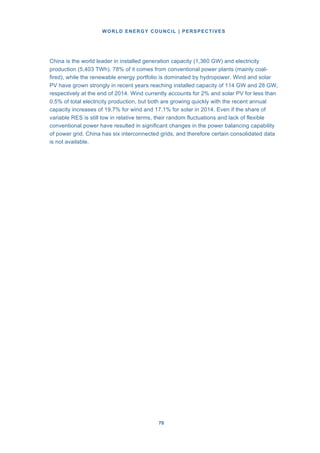
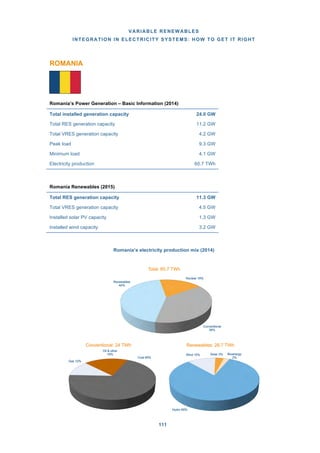
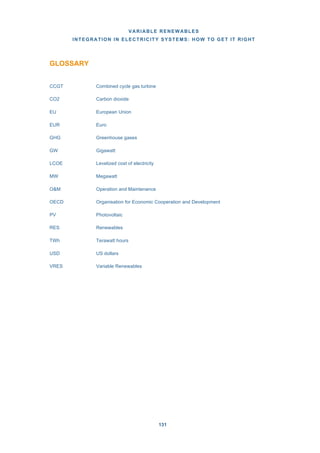
TABLE 3 – 2015 ELECTRICITY NATIONAL PRODUCTION BY COUNTRY AND BY RES
AND VRES (TWH)
Continent Country
Total Gen
[TWh]
RES
gen
[TWh]
VRES
gen
[TWh]
Wind
generation
[TWh]
Solar
PV
gen
[TWh]
Ratio
VRES/Total
gen [%]
AFRICA
Algeria 68.5 0.2 0.1 0.0 0.1 0.1%
Egypt 180.6 14.6 1.6 1.5 0.1 0.9%
Nigeria
1
29.5 5.4 0.0 0.0 0.0 0.0%
South Africa 249.7 5.3 4.0 2.1 1.9 1.6%
Tunisia
1
18.3 0.4 0.4 0.4 0.0 2.3%
Colombia 77.0 46.3 0.1 0.1 0.0 0.1%
AMERICA
Mexico 306.7 45.6 8.2 7.9 0.3 2.7%
USA 4.303.0 570.8 231.9 192.9 39.0 5.4%
Brazil 579.8 432.8 21.7 21.7 0.0 3.7%
Ecuador 25.9 13.6 0.1 0.1 0.0 0.5%
Uruguay 12.1 11.2 1.9 1.8 0.0 15.4%
ASIA
China 5.810.6 1.403.6 224.3 185.1 39.2 3.9%
India 1.304.8 192.9 48.0 41.4 6.6 3.7%
Indonesia 234.7 26.5 0.0 0.0 0.0 0.0%
Japan 1.035.5 160.6 36.3 5.4 30.9 3.5%
Jordan
1
18.0 1.0 0.1 0.1 0.0 0.6%
Kazakhstan 91.1 8.0 0.1 0.1 0.0 0.1%
Philippines 82.6 21.7 0.7 0.6 0.1 0.8%
South Korea 522.3 16.0 5.4 1.6 3.8 1.0%
Thailand 177.8 13.7 2.8 0.4 2.4 1.6%
EUROPE
Denmark
2
28.7 18.9 14.9 14.3 0.6 51.8%
France 568.8 88.6 27.5 20.2 7.3 4.8%
Germany 647.1 195.9 126.4 88.0 38.4 19.5%
Ireland 28.7 7.8 6.6 6.6 0.0 22.9%
Italy 281.8 108.8 39.9 14.7 25.2 14.2%
Poland 164.7 22.2 10.9 10.8 0.1 6.6%
Portugal 51.9 24.2 12.4 11.6 0.8 23.9%
Romania 65.6 25.9 9.0 7.0 2.0 13.8%
Spain 278.5 95.8 63.2 49.3 13.9 22,7%
United Kingdom 337.7 83.3 48.0 40.4 7.6 14.2%
Russia 1,063.4 170.5 0.1 0.0 0.1 0.0%
OCEANIA New Zealand 44.3 35.3 2.2 2.2 0.0 5.1%
TOTAL 32 Countries 18.690 3.868 949 728 221 5.1%
2015 TOTAL WORLD 24.098 5.559 1.094 841 253 4.5%
% 32 Countries of TOTAL 78% 70% 87 % 87% 87%
1
2014 values
2
Net import represents more than 20% of its production TWh, the VRES reached 42% of the total
consumption in 2015.
1
2014 values
2
Net import represents more than 20% of its production TWh, the VRES reached 42% of
the total consumption in 2015.
Source: Country Cases and public sources](https://image.slidesharecdn.com/renewablesfullreportsmcpack-161221110155/85/Renewablesfullreportsmcpack-26-320.jpg)


This document summarizes a report by the World Energy Council on integrating variable renewable energy sources like wind and solar into electricity systems. It finds that while renewables now make up 27.7% of global power capacity and their costs are declining, integrating their variable output poses technical and economic challenges for grid operations. The report examines case studies from 32 countries to identify lessons learned and solutions. It recommends policies like market reforms and capacity markets, along with technologies like improved forecasting, flexible generation, demand response, energy storage, and transmission upgrades to help renewable energy maintain growth while maintaining grid reliability.


