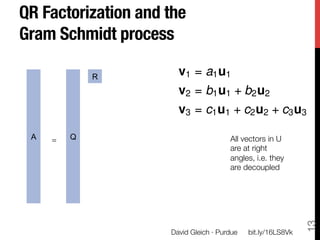
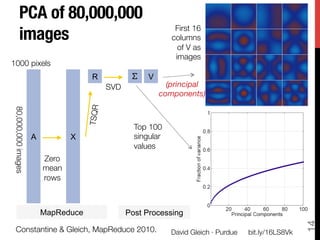
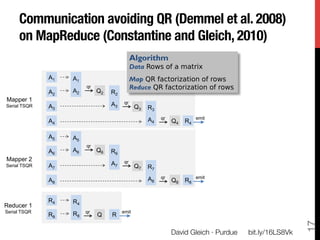
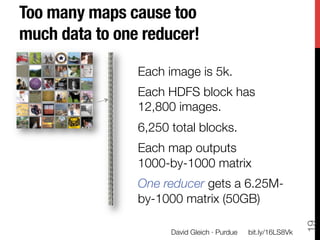
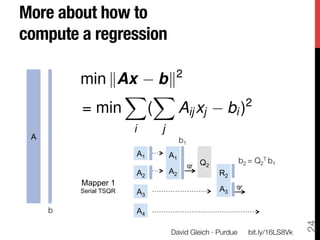
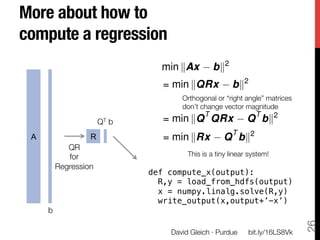
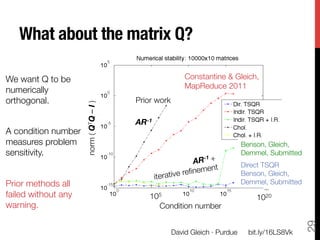
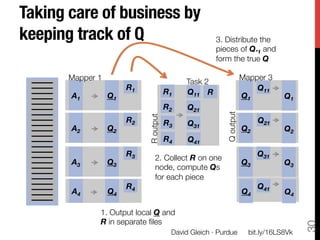
The document discusses David Gleich's presentation on using QR factorization and the Gram-Schmidt process to perform large-scale regression and principal component analysis on tall-and-skinny matrices with many rows of data. Specifically, it describes how QR factorization can be used to decompose a tall-and-skinny matrix into orthogonal and triangular matrices, allowing regression and PCA to be performed efficiently on very large datasets. The presentation code and slides are available online for learning about computing singular values and vectors of huge matrices on Hadoop.
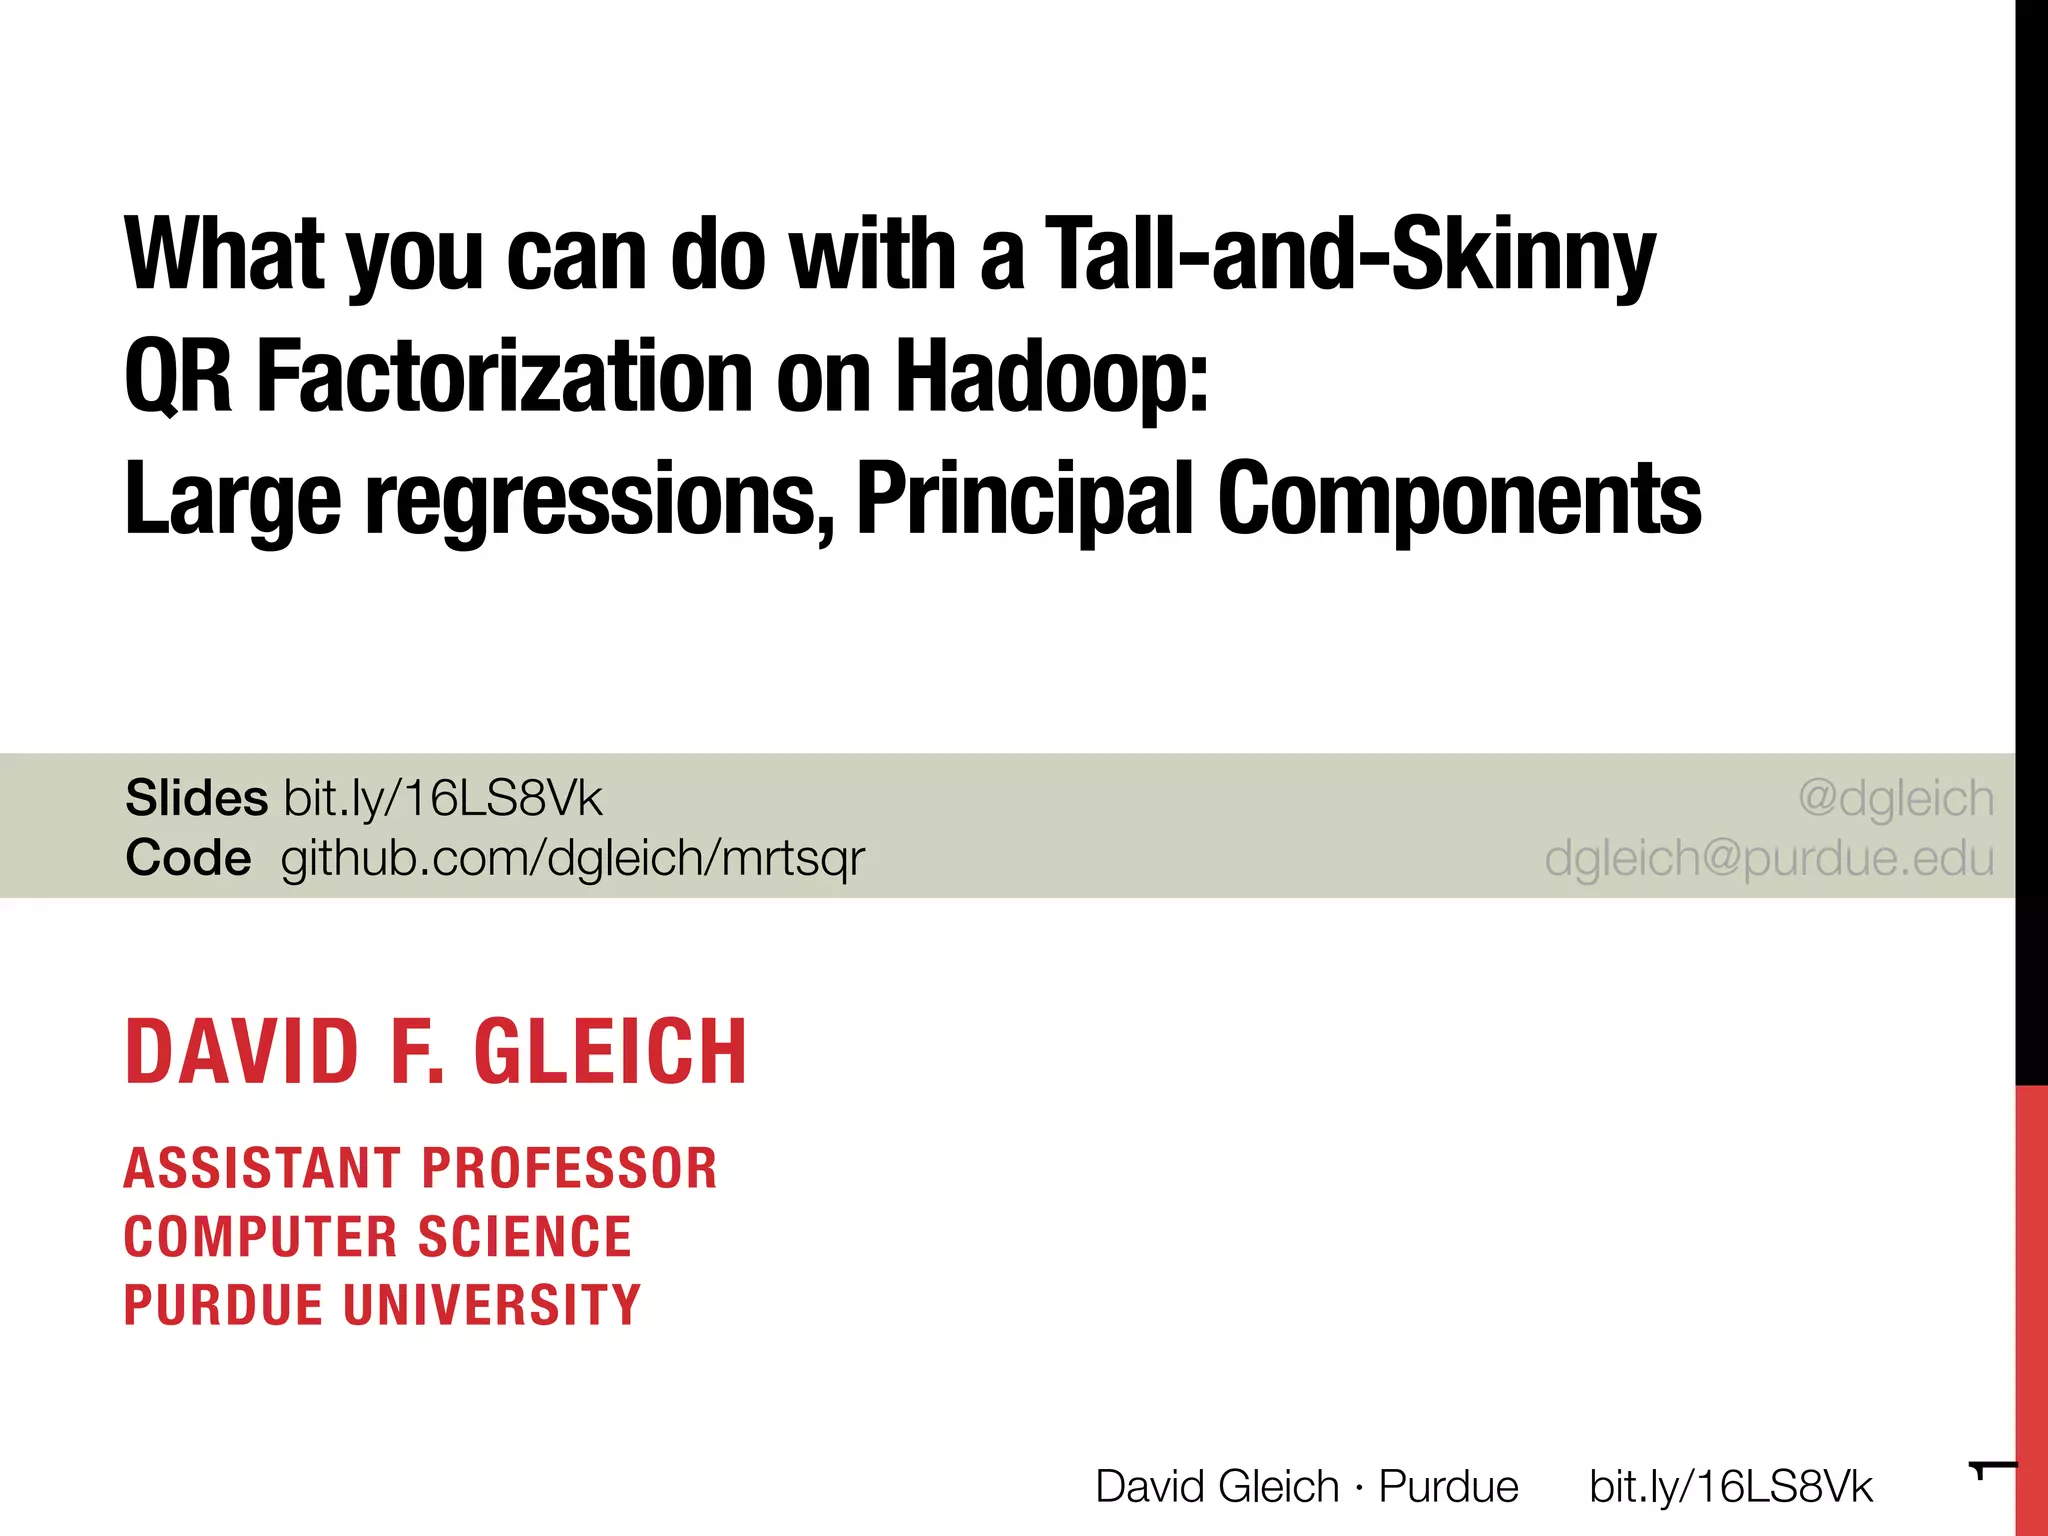


![The rest of the talk!
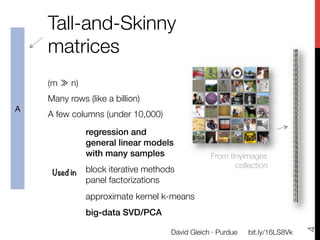
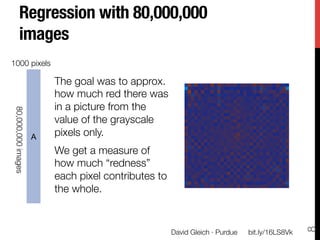
Full TSQR code in hadoopy
import random, numpy, hadoopy def close(self):
class SerialTSQR: self.compress()
def __init__(self,blocksize,isreducer): for row in self.data:
self.bsize=blocksize key = random.randint(0,2000000000)
self.data = [] yield key, row
if isreducer: self.__call__ = self.reducer
else: self.__call__ = self.mapper def mapper(self,key,value):
self.collect(key,value)
def compress(self):
R = numpy.linalg.qr( def reducer(self,key,values):
numpy.array(self.data),'r') for value in values: self.mapper(key,value)
# reset data and re-initialize to R
self.data = [] if __name__=='__main__':
for row in R: mapper = SerialTSQR(blocksize=3,isreducer=False)
self.data.append([float(v) for v in row]) reducer = SerialTSQR(blocksize=3,isreducer=True)
hadoopy.run(mapper, reducer)
def collect(self,key,value):
self.data.append(value)
if len(self.data)>self.bsize*len(self.data[0]):
self.compress()
16
David Gleich · Purdue
bit.ly/16LS8Vk](https://image.slidesharecdn.com/techcon-qr-short-130409233040-phpapp01/85/What-you-can-do-with-a-tall-and-skinny-QR-factorization-in-Hadoop-Principal-components-and-large-regressions-16-320.jpg)
![The rest of the talk!
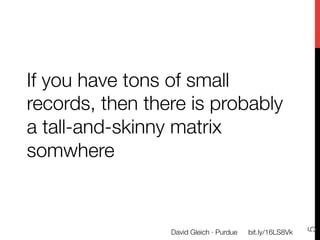
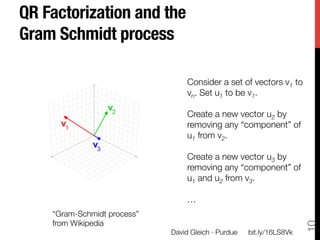
Full TSQR code in hadoopy
import random, numpy, hadoopy def close(self):
class SerialTSQR: self.compress()
def __init__(self,blocksize,isreducer): for row in self.data:
self.bsize=blocksize key = random.randint(0,2000000000)
self.data = [] yield key, row
if isreducer: self.__call__ = self.reducer
else: self.__call__ = self.mapper def mapper(self,key,value):
self.collect(key,value)
def compress(self):
R = numpy.linalg.qr( def reducer(self,key,values):
numpy.array(self.data),'r') for value in values: self.mapper(key,value)
# reset data and re-initialize to R
self.data = [] if __name__=='__main__':
for row in R: mapper = SerialTSQR(blocksize=3,isreducer=False)
self.data.append([float(v) for v in row]) reducer = SerialTSQR(blocksize=3,isreducer=True)
hadoopy.run(mapper, reducer)
def collect(self,key,value):
self.data.append(value)
if len(self.data)>self.bsize*len(self.data[0]):
self.compress()
18
David Gleich · Purdue
bit.ly/16LS8Vk](https://image.slidesharecdn.com/techcon-qr-short-130409233040-phpapp01/85/What-you-can-do-with-a-tall-and-skinny-QR-factorization-in-Hadoop-Principal-components-and-large-regressions-18-320.jpg)
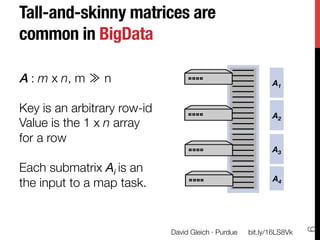
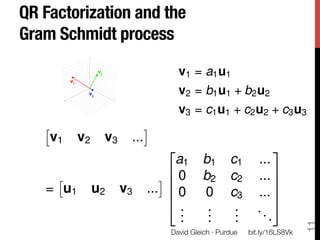
![TSQR code in hadoopy for
regressions
import random, numpy, hadoopy def close(self):
class SerialTSQR: self.compress()
def __init__(self,blocksize,isreducer): for i,row in enumerate(self.data):
[…] key = random.randint(0,2000000000)
yield key, (row, self.rhs[i])
def compress(self):
Q,R = numpy.linalg.qr( def mapper(self,key,value):
numpy.array(self.data), ‘full’) self.collect(key,unpack(value))
# reset data and re-initialize to R
self.data = [] def reducer(self,key,values):
for row in R: for value in values: self.mapper(key,
self.data.append([float(v) for v in row]) unpack(value))
self.rhs = list( numpy.dot(Q.T,
numpy.array(self.rhs) ) if __name__=='__main__':
mapper = SerialTSQR(blocksize=3,isreducer=False)
def collect(self,key,valuerhs): reducer = SerialTSQR(blocksize=3,isreducer=True)
self.data.append(valuerhs[0]) hadoopy.run(mapper, reducer)
self.rhs.append(valuerhs[1])
if len(self.data)>self.bsize*len(self.data[0]):
self.compress()
25
David Gleich · Purdue
bit.ly/16LS8Vk](https://image.slidesharecdn.com/techcon-qr-short-130409233040-phpapp01/85/What-you-can-do-with-a-tall-and-skinny-QR-factorization-in-Hadoop-Principal-components-and-large-regressions-25-320.jpg)


![Getting Started with Apache Spark: Big Data Made Simple [Free Meetup]](https://cdn.slidesharecdn.com/ss_thumbnails/apachesparkgettingstarted-260203175547-8361bcc3-thumbnail.jpg?width=640&height=640&fit=bounds)


