Downloaded 216 times
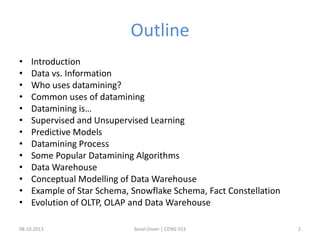

The document outlines the concept of data mining, highlighting its definition, processes, applications, and the distinction between data and information. It discusses various techniques such as supervised and unsupervised learning, popular algorithms, and the importance of data warehouses in data mining. The concluding remarks emphasize the necessity of quality data and collaboration between database and data mining specialists for successful outcomes.