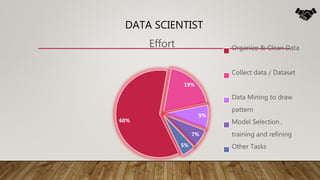
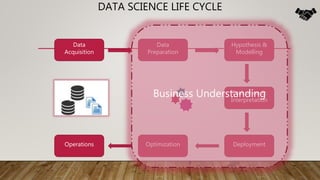
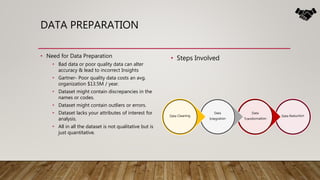
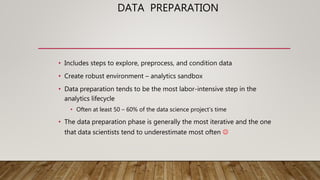
Manoj Mishra
November 23, 2017
DataScience Lifecycle
 Introduction
 LifeCycle
 SkillTree
 Questions
AGENDA
DATA SCIENTIST
60%
19%
9%
7%
5%
Effort Organize & Clean Data
Collect data / Dataset
Data Mining to draw
pattern
Model Selection ,
training and refining
Other Tasks
Data
Acquisition
Data
Preparation
Hypothesis &
Modelling
DATA SCIENCE LIFE CYCLE
Evaluation &
Interpretation
DeploymentOperations Optimization
Business Understanding
DATA ACQUISITION
Static
• Feedback system
• CSV Data sets / text files
Live
• Logs data, memory dumps
• Sensors, controllers etc.
Virtual
• Data Virtualization
• Caching , Storing
DATA SAMPLE DATASET INVENTORY
PROJECT - PREDICTING FAILURE – PROACTIVE
MAINTENANCE
• Baseline normal operational
patterns by modelling the
unstructured Log data.
• Use Domain Experts to identify
patterns before failures.
• Use statistical measurements &
Machine Learning to determine
threshold.
• Identify patterns of activity to
anticipate and react to
circumstances that might
otherwise disrupt operations
SME -
Domain
DATA PREPARATION
• Need for Data Preparation
• Bad data or poor quality data can alter
accuracy & lead to incorrect Insights
• Gartner- Poor quality data costs an avg.
organization $13.5M / year.
• Dataset might contain discrepancies in the
names or codes.
• Dataset might contain outliers or errors.
• Dataset lacks your attributes of interest for
analysis.
• All in all the dataset is not qualitative but is
just quantitative.
• Steps Involved
DATA PREPARATION
• Includes steps to explore, preprocess, and condition data
• Create robust environment – analytics sandbox
• Data preparation tends to be the most labor-intensive step in the
analytics lifecycle
• Often at least 50 – 60% of the data science project’s time
• The data preparation phase is generally the most iterative and the one
that data scientists tend to underestimate most often 
Database :
Understand the data
Understand the Business
Airlines :
NYC FLIGHTS 13
e.g. tailnum :
A tail number refers to an
identification number painte
d on an aircraft, frequently
on the tail
Goal : Predicting
flight delays Modelling
PREDICTING FLIGHT DELAYS - NYC FLIGHTS 13
• Exploratory Data Analysis
of the flight data for
inbound and outbound
flights for year 2013 in
NYC.
• Find patterns, benchmark,
model and find
predictors.
• To predict the flight
delays for NYC Inbound/
Outbound flights.
• Ref. DataSet
PREDICTING FLIGHT DELAYS - NYC FLIGHTS 13
• Exploratory Data Analysis
of the flight data for
inbound and outbound
flights for year 2013 in
NYC.
• Find patterns, benchmark,
model and find
predictors.
• To predict the flight
delays for NYC Inbound/
Outbound flights.
• Ref. DataSet
OBSERVATIONS - NYC FLIGHTS 13
REF. DATASET
COMMON TOOLS - FOR DATA
PREPARATION
• Alpine Miner provides a graphical user interface for creating analytic
workflows
• OpenRefine (formerly Google Refine) is a free, open source tool for
working with messy data
• Similar to OpenRefine, Data Wrangler is an interactive tool for data
cleansing an transformation
• Alteryx and Informatica also can be tried.
HYPOTHESIS & MODELLING
• There are three main tasks addressed in this stage:
• Feature engineering: Create data features from the raw data to
facilitate model training.
• Model training: Find the model that answers the question most
accurately by comparing their success metrics.
• Determine if your model is suitable for production.
FEATURE SELECTION & ENGINEERING
Select
Features
Research
feature
relevance
Experiment
& Validate
Change the
feature set
if required
Go back to
feature
selection
FEATURE ENGINEERING
Date # footfalls in Dubai Mall
01/07/2017 124532
02/07/2017 65434
03/07/2017 12333
04/07/2017 60009
05/07/2017 46567
06/07/2017 98001
07/07/2017 146543
08/07/2017 112345
09/07/2017 76543
Date # footfalls in Dubai Mall IsHoliday?
01/07/2017 124532Yes
02/07/2017 65434No
03/07/2017 12333No
04/07/2017 60009No
05/07/2017 46567No
06/07/2017 98001No
07/07/2017 146543yes
08/07/2017 112345yes
09/07/2017 76543No
FEATURE ENGINEERING
Seasonality (holiday season):
Jun, Jul & Dec account for the
highest avg. delays
MODELLING
CREATE YOUR MODEL & EVALUATE
• Split the input data randomly for modeling into a training data set and a test data
set.
• Build the models by using the training data set.
• Evaluate the training and the test data set. Use a series of competing machine-
learning algorithms along with the various associated tuning parameters (known as
a parameter sweep) that are geared toward answering the question of interest with
the current data.
• Determine the “best” solution to answer the question by comparing the success
metrics between alternative methods.
CREATE YOUR MODEL & EVALUATE
• Supervised Learning
• Naive Bayes
• KNN
• Support Vector Machines
(SVM)
• Linear Regression
• Unsupervised Learning
• Principal Component Analysis.
• K Means
• Classification Metrics
• Accuracy Score
• Classification Report
• Confusion Matrix
• Regression Metrics
• Mean Absolute Error.
• Mean Squared Error
• R2 Score
• Clustering Metrics
• Adjusted Rand Index.
• Homogeneity
• V - measure
DEPLOYMENT
After you have a set of models that perform well, you can operationalize
them for other applications through APIs or other interface to consume
from various applications, such as:
• Online websites
• Spreadsheets
• Dashboards
• Line-of-business applications
• Back-end applications
THANK YOU !

Data science life cycle

  • 1.
    Manoj Mishra November 23,2017 DataScience Lifecycle
  • 2.
     Introduction  LifeCycle SkillTree  Questions AGENDA
  • 3.
    DATA SCIENTIST 60% 19% 9% 7% 5% Effort Organize& Clean Data Collect data / Dataset Data Mining to draw pattern Model Selection , training and refining Other Tasks
  • 4.
    Data Acquisition Data Preparation Hypothesis & Modelling DATA SCIENCELIFE CYCLE Evaluation & Interpretation DeploymentOperations Optimization Business Understanding
  • 5.
    DATA ACQUISITION Static • Feedbacksystem • CSV Data sets / text files Live • Logs data, memory dumps • Sensors, controllers etc. Virtual • Data Virtualization • Caching , Storing
  • 6.
  • 7.
    PROJECT - PREDICTINGFAILURE – PROACTIVE MAINTENANCE • Baseline normal operational patterns by modelling the unstructured Log data. • Use Domain Experts to identify patterns before failures. • Use statistical measurements & Machine Learning to determine threshold. • Identify patterns of activity to anticipate and react to circumstances that might otherwise disrupt operations SME - Domain
  • 8.
    DATA PREPARATION • Needfor Data Preparation • Bad data or poor quality data can alter accuracy & lead to incorrect Insights • Gartner- Poor quality data costs an avg. organization $13.5M / year. • Dataset might contain discrepancies in the names or codes. • Dataset might contain outliers or errors. • Dataset lacks your attributes of interest for analysis. • All in all the dataset is not qualitative but is just quantitative. • Steps Involved
  • 9.
    DATA PREPARATION • Includessteps to explore, preprocess, and condition data • Create robust environment – analytics sandbox • Data preparation tends to be the most labor-intensive step in the analytics lifecycle • Often at least 50 – 60% of the data science project’s time • The data preparation phase is generally the most iterative and the one that data scientists tend to underestimate most often 
  • 10.
    Database : Understand thedata Understand the Business Airlines : NYC FLIGHTS 13 e.g. tailnum : A tail number refers to an identification number painte d on an aircraft, frequently on the tail Goal : Predicting flight delays Modelling
  • 11.
    PREDICTING FLIGHT DELAYS- NYC FLIGHTS 13 • Exploratory Data Analysis of the flight data for inbound and outbound flights for year 2013 in NYC. • Find patterns, benchmark, model and find predictors. • To predict the flight delays for NYC Inbound/ Outbound flights. • Ref. DataSet
  • 12.
    PREDICTING FLIGHT DELAYS- NYC FLIGHTS 13 • Exploratory Data Analysis of the flight data for inbound and outbound flights for year 2013 in NYC. • Find patterns, benchmark, model and find predictors. • To predict the flight delays for NYC Inbound/ Outbound flights. • Ref. DataSet
  • 13.
    OBSERVATIONS - NYCFLIGHTS 13 REF. DATASET
  • 14.
    COMMON TOOLS -FOR DATA PREPARATION • Alpine Miner provides a graphical user interface for creating analytic workflows • OpenRefine (formerly Google Refine) is a free, open source tool for working with messy data • Similar to OpenRefine, Data Wrangler is an interactive tool for data cleansing an transformation • Alteryx and Informatica also can be tried.
  • 15.
    HYPOTHESIS & MODELLING •There are three main tasks addressed in this stage: • Feature engineering: Create data features from the raw data to facilitate model training. • Model training: Find the model that answers the question most accurately by comparing their success metrics. • Determine if your model is suitable for production.
  • 16.
    FEATURE SELECTION &ENGINEERING Select Features Research feature relevance Experiment & Validate Change the feature set if required Go back to feature selection
  • 17.
    FEATURE ENGINEERING Date #footfalls in Dubai Mall 01/07/2017 124532 02/07/2017 65434 03/07/2017 12333 04/07/2017 60009 05/07/2017 46567 06/07/2017 98001 07/07/2017 146543 08/07/2017 112345 09/07/2017 76543 Date # footfalls in Dubai Mall IsHoliday? 01/07/2017 124532Yes 02/07/2017 65434No 03/07/2017 12333No 04/07/2017 60009No 05/07/2017 46567No 06/07/2017 98001No 07/07/2017 146543yes 08/07/2017 112345yes 09/07/2017 76543No
  • 18.
    FEATURE ENGINEERING Seasonality (holidayseason): Jun, Jul & Dec account for the highest avg. delays
  • 19.
  • 20.
    CREATE YOUR MODEL& EVALUATE • Split the input data randomly for modeling into a training data set and a test data set. • Build the models by using the training data set. • Evaluate the training and the test data set. Use a series of competing machine- learning algorithms along with the various associated tuning parameters (known as a parameter sweep) that are geared toward answering the question of interest with the current data. • Determine the “best” solution to answer the question by comparing the success metrics between alternative methods.
  • 21.
    CREATE YOUR MODEL& EVALUATE • Supervised Learning • Naive Bayes • KNN • Support Vector Machines (SVM) • Linear Regression • Unsupervised Learning • Principal Component Analysis. • K Means • Classification Metrics • Accuracy Score • Classification Report • Confusion Matrix • Regression Metrics • Mean Absolute Error. • Mean Squared Error • R2 Score • Clustering Metrics • Adjusted Rand Index. • Homogeneity • V - measure
  • 22.
    DEPLOYMENT After you havea set of models that perform well, you can operationalize them for other applications through APIs or other interface to consume from various applications, such as: • Online websites • Spreadsheets • Dashboards • Line-of-business applications • Back-end applications
  • 24.