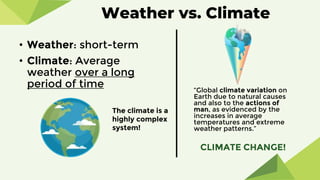
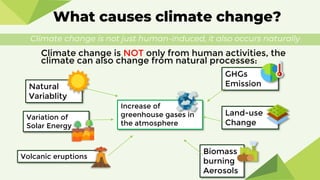
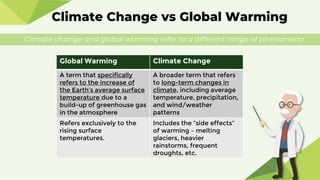
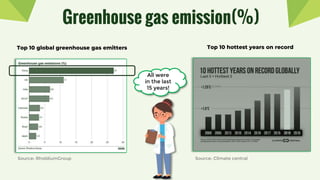
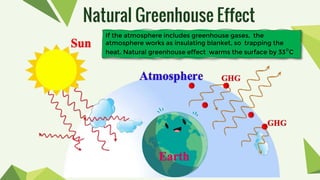
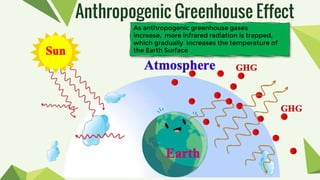
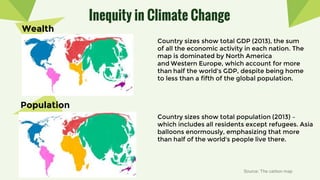
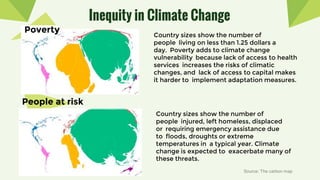
The document discusses climate change versus global warming. Climate change refers to long-term shifts in weather patterns due to both natural causes and human activities that release greenhouse gases. Global warming refers specifically to rising surface temperatures from increased greenhouse gases. The document notes that climate change is caused by both natural factors like solar activity and volcanic eruptions, as well as human activities like burning fossil fuels and deforestation that release greenhouse gases. It provides data showing that the top greenhouse gas emitters and hottest years on record have all occurred in the last 15 years. The document examines the natural and enhanced greenhouse effects and the anthropogenic impact on increasing global temperatures. It discusses risks from extreme weather events and inequities in how climate change burdens

![Climate in global mean temperature
Source: [WG1AR5/Figure
SPM.1]](https://image.slidesharecdn.com/whatisclimatechange-210817105545/85/What-is-climate-change-10-320.jpg)
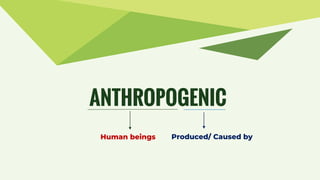
![Anthropogenic Impact
With Anthropogenic GHGs Without Anthropogenic GHGs
Source: [WG1AR5/Figure TS.9]
There is significant anthropogenic warming over the past 50 years
It is “extremely likely” that human influence has been the dominant cause
of observed warming since the mid 20th century.](https://image.slidesharecdn.com/whatisclimatechange-210817105545/85/What-is-climate-change-11-320.jpg)
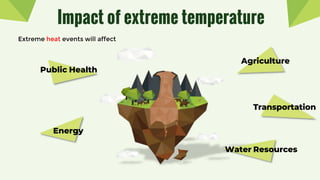
![Assessment of Risks from Extreme
Events
Source: [WG2AR5/Figure SPM.1]](https://image.slidesharecdn.com/whatisclimatechange-210817105545/85/What-is-climate-change-12-320.jpg)
![Where is the hottest location in the world?
Spatial distribution of the maximum temperature climatology
Does the region characterized by the highest maximum temperature coincide with
the region where the people suffer from the worst heat stress Source: [WG2AR5/Figure SPM.1]](https://image.slidesharecdn.com/whatisclimatechange-210817105545/85/What-is-climate-change-13-320.jpg)


![Climate_Change_&_Its_Impact_PPT[2][2][1][2].pptx](https://cdn.slidesharecdn.com/ss_thumbnails/climatechangeitsimpactppt2212-251010054513-21112abb-thumbnail.jpg?width=640&height=640&fit=bounds)