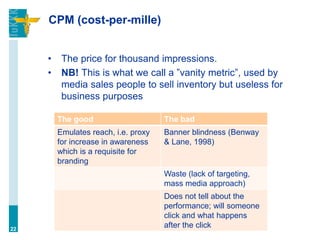
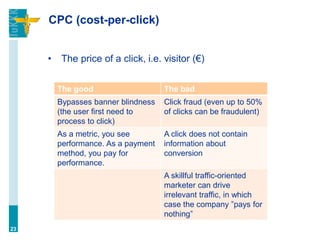
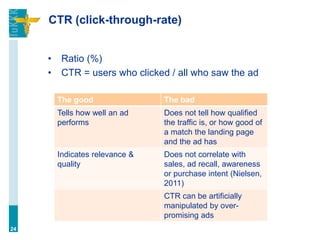
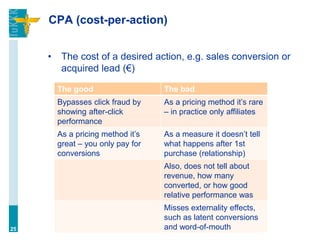
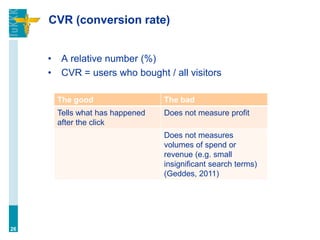
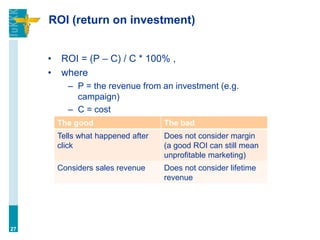
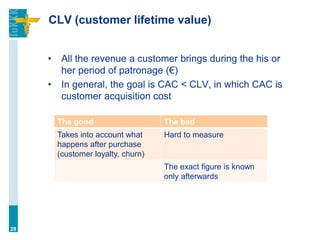
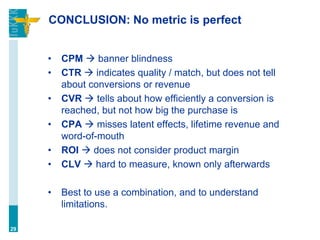
PhD Joni Salminen
joolsa@utu.fi
Turku School of Economics,
presented at Oulu University
2015
DIGITAL ANALYTICS –
WEB ANALYTICS & DIGITAL
MARKETING METRCS
1
Why learn analytics?
2
Two problems.
3
Problem 1: Wanamaker’s dilemma (ca. 1901)
“Half the money I spend on advertising is wasted;
the trouble is I don’t know which half.”
‱ The marketer uses several channels for advertising.
‱ He knows advertising increases sales.
‱ But: which channel and how much?
If we cannot measure the results, it’s harder to improve (i.e.
kill bad channels and scale up good ones).
4
VoilĂ ! Wanamaker dilemma solved
(let’s go home
)
5
Channel Sales
Problem solved?
Problem 2: Marketer’s intuition
6
The more experienced a
marketer is, the better he thinks
he knows things beforehand
 However, even an
experienced professional can
be wrong.
With experience, the speed for
evaluating different alternatives
increases. Simultaneously the
ability to think beyond them
decreases.
 Never forget the fallacy of
marketer’s intuition

Analytics overcomes marketer’s intuition
“After analyzing the online buying behavior of over
600,000 consumers across numerous e-commerce
sites, I learned that surprisingly 75 percent of
shopping cart abandoners would actually return to
the site they abandoned within a 28-day period. This
defies conventional wisdom: we polled online
marketers and 81 percent believed that the majority
of abandoners never return.” (SeeWhy, 2013)
7
I’m a marketer.
I’m always
right!
Finally, don’t forget

There are good
opportunities in the job
market for people who
know analytics!
8
What is analytics?
9
What is analytics?
“Digital Analytics is the analysis of qualitative and
quantitative data from your business and your
competition to drive a continual improvement of the
online experience that your customers and potential
customers have which translates to your desired
outcomes, both offline and online.” (Kaushik, 2010)
10
Four types of analytics (Gartner, 2015)
11
Internal and external analytics
a. Internal analytics = analyzing the data from own
website and properties such as social media pages
in order to improve the likelihood of desired business
results (e.g. Google Analytics, CMS, CRM)
b. External analytics = analyzing competitors or the
market (cf. business intelligence, competitive
intelligence) (SimilarWeb, Google Trends, Facebook
Audience Insights)
12
There are two types of traffic
(hence, analytics
)
Analytics of organic
traffic
Analytics of paid traffic
Google Search Console Google AdWords
Facebook Facebook Insights Facebook Ads Manager
13
Google Analytics shows what happens
after the click, these show what happens
before the click (data is in the platforms).
Ways to set up an analytics infrastructure
a. In-house (tailored system)
b. Ready-made tools (e.g. Google Analytics,
KissMetrics)
Each one has advantages and disadvantages; for
example, in-house systems give the most accurate
conversion data, but take time and money to build.
14
In-house analytics: an example
15
How does analytics work? (Mullins, 2011)
16
Website
Javascript code
Server
Processing
The application of analytics
‱ analytics can be used for two things (Salenius &
Salminen, 2015):
1) reporting
2) optimizing
3) strategic insight
‱ While analytics (data) is the requisite for optimization,
it’s also the pathway to automatization.
17
What kind of questions can we answer with
the help of analytics?
‱ What’s the most profitable source of visitors?
‱ What products are people buying? How much is the
average order size?
‱ Where do users come from? How long do they stay
on the site?
‱ How do new visitors behave in comparison to old
ones?
‱ What content is the most/less viewed?
‱ What keywords people use to find our site?
‱ Where do people exit the site?
18
Basic metrics
19
Objective → Goal → Metric
‱ Objective: a broader goal, i.e. capture market share
from competitors
‱ Goal: a specific goal, like gain 30% of market share
by the end of 2015
‱ Metrics: market share, market growth, generated
leads, sent quotes, closed sales
20
Let’s look at the most common digital
marketing metrics. In addition to showing
performance, some of them are used as
pricing models for online advertising.
21
CPM (cost-per-mille)
‱ The price for thousand impressions.
‱ NB! This is what we call a ”vanity metric”, used by
media sales people to sell inventory but useless for
business purposes
22
The good The bad
Emulates reach, i.e. proxy
for increase in awareness
which is a requisite for
branding
Banner blindness (Benway
& Lane, 1998)
Waste (lack of targeting,
mass media approach)
Does not tell about the
performance; will someone
click and what happens
after the click
CPC (cost-per-click)
‱ The price of a click, i.e. visitor (€)
23
The good The bad
Bypasses banner blindness
(the user first need to
process to click)
Click fraud (even up to 50%
of clicks can be fraudulent)
As a metric, you see
performance. As a payment
method, you pay for
performance.
A click does not contain
information about
conversion
A skillful traffic-oriented
marketer can drive
irrelevant traffic, in which
case the company ”pays for
nothing”
CTR (click-through-rate)
‱ Ratio (%)
‱ CTR = users who clicked / all who saw the ad
24
The good The bad
Tells how well an ad
performs
Does not tell how qualified
the traffic is, or how good of
a match the landing page
and the ad has
Indicates relevance &
quality
Does not correlate with
sales, ad recall, awareness
or purchase intent (Nielsen,
2011)
CTR can be artificially
manipulated by over-
promising ads
CPA (cost-per-action)
‱ The cost of a desired action, e.g. sales conversion or
acquired lead (€)
25
The good The bad
Bypasses click fraud by
showing after-click
performance
As a pricing method it’s rare
– in practice only affiliates
As a pricing method it’s
great – you only pay for
conversions
As a measure it doesn’t tell
what happens after 1st
purchase (relationship)
Also, does not tell about
revenue, how many
converted, or how good
relative performance was
Misses externality effects,
such as latent conversions
and word-of-mouth
CVR (conversion rate)
‱ A relative number (%)
‱ CVR = users who bought / all visitors
26
The good The bad
Tells what has happened
after the click
Does not measure profit
Does not measures
volumes of spend or
revenue (e.g. small
insignificant search terms)
(Geddes, 2011)
ROI (return on investment)
‱ ROI = (P – C) / C * 100% ,
‱ where
– P = the revenue from an investment (e.g.
campaign)
– C = cost
27
The good The bad
Tells what happened after
click
Does not consider margin
(a good ROI can still mean
unprofitable marketing)
Considers sales revenue Does not consider lifetime
revenue
CLV (customer lifetime value)
‱ All the revenue a customer brings during the his or
her period of patronage (€)
‱ In general, the goal is CAC < CLV, in which CAC is
customer acquisition cost
28
The good The bad
Takes into account what
happens after purchase
(customer loyalty, churn)
Hard to measure
The exact figure is known
only afterwards
CONCLUSION: No metric is perfect
‱ CPM  banner blindness
‱ CTR  indicates quality / match, but does not tell
about conversions or revenue
‱ CVR  tells about how efficiently a conversion is
reached, but not how big the purchase is
‱ CPA  misses latent effects, lifetime revenue and
word-of-mouth
‱ ROI  does not consider product margin
‱ CLV  hard to measure, known only afterwards
‱ Best to use a combination, and to understand
limitations.
29
How to choose metrics? Some
considerations

30
Basic business objectives in digital
marketing (Google, 2015)
1. For ecommerce sites, an obvious objective is selling
products or services.
2. For lead generation sites, the goal is to collect user
information for sales teams to connect with potential
leads.
3. For content publishers, the goal is to encourage
engagement and frequent visitation.
4. For online informational or support sites, helping
users find the information they need at the right time
is of primary importance.
5. For branding, the main objective is to drive
awareness, engagement and loyalty.
31
Metrics differ by channel and campaign

Why?
Because of funnel thinking (AIDA), i.e. because at
different times people are at different stages of the
purchase process (customer journey). Thus, the
marketing goals naturally fluctuate; a direct response
like sales is not always the main point.
Metrics are therefore chosen based on platforms to
represent marketing performance in different stages of
the purchase process.
32
A brand may only have goals relating to
awareness creation

(
) click-through is not always what advertising online has to
be about. Do you think Pepsi or Coca-Cola (assuming they
buy FB ads) would give two shits if you click their ads?
You're not going to buy a Pepsi online! They don't get click-
through on TV, billboards, print ads, or any of their other
marketing material. But they spend millions every year on that
stuff because they get EXPOSURE. You see their logo and an
icy, fizzy, sweet-looking Pepsi enough times and you want
one. That’s what they’re banking on.” (Anonym, 2012)
33
How to choose metrics?
a. sales metrics (these are measured in campaigns
that are sales-oriented, e.g. product campaigns)
b. visibility metrics (these are measured for brand
identity and awareness campaigns)
It’s a crude but efficient division, as all campaigns can
ultimately divided between direct response and latent or
indirect response.
34
Metrics are like
lovers; they complete
each other.
Make sure you include both absolute and
relative metrics
a. absolute (€)
b. relative (%)
‱ use absolute metrics to find out the scale (e.g., is
Facebook a major source of sales compared to
Google?)
‱ use relative metrics to find out the potential (Could
Facebook become a major source of sales?)
35
Metrics are like
lovers; they complete
each other.
How to choose metrics? A summary
Consider:
‱ The overall goals of marketing efforts
‱ The role of the channel in achieving those goals
‱ The natural role of the channel in the purchase
process
36
But all is not well in the metrics kingdom

37
”Are we measuring what is easy to measure
or what is meaningful to measure?”
38
(JĂ€rvinen, 2015)
Challenges in measuring the
effectiveness of digital marketing
(JĂ€rvinen, 2015)
Organizational challenges:
1. Metrics selection
2. Refining metrics data into actionable insights
3. Contextual factors (internal):
– Analytical skills
– IT tools and infrastructure
– Senior management commitment
– Leadership
– Organizational culture
The real challenges:
1. Understanding the complexity of factors (endogenous & exogenous) that
affect consumer decision-making
2. Determining the long-term impacts of marketing communications on sales
(i.e., linking marketing actions on long-term outcomes)
39
Two risks in data
a. Analysis paralysis = we’re unable to act, because
there’s just too much data
b. Vanity metrics = we follow metrics that are
irrelevant for business goals and pretend we’re
working well.
The solution for both: focusing on the right questions
and metrics.
40
Actionable metrics vs. vanity metrics
(Maurya, 2010)
“An actionable metric is one that ties specific and
repeatable actions to observed results.”
– Examples: conversion rate in a direct response
campaign, number of leads generated from a lead
magnet campaign, bounce rate of campaign + landing
page in comparison to site average
“The opposite of actionable metrics are vanity
metrics (like web hits or number of downloads)
which only serve to document the current state of
the product but offer no insight into how we got
here or what to do next.”
– Examples: Facebook fans, ad impressions, even
visitors in some cases
41
Aggregation problem
‱ All data looks the same when looking from far
enough!
‱ The solution:
‱ segmentation
42
Segmentation
‱ Segmentation isolates your data into sub-sets for a
deeper analysis, and thereby solves the aggregation
problem.
‱ You can segment the data by
– date and time
– user’s device
– marketing channels
– geographical location
– etc. (dozens of options!)
43
Optimization for platform metrics can be in
conflict with business goals
44
Which ad is more successful?
Ad A Ad B
Quality score 10 3
CTR 10 % 3 %
Impressions 1000 1000
Clicks 100 30
Conversions 15 15
Revenue 1500 € 1500 €
Cost 500 € 150 €
Optimization for platform metrics can be in
conflict with business goals
45
Ad A Ad B
Quality score 10 3
CTR 10 % 3 %
Impressions 1000 1000
Clicks 100 30
Conversions 15 15
Revenue 1500 € 1500 €
Cost 500 € 150 €
ROI 200 900%
Attributing sales value
‱ You are the manager of an ecommerce site
‱ You have one sales conversion worth 1000€
‱ From analytics, you can see that four clicks have
preceded the conversion
‱ The last click came from a search-engine with a
specific keyword.
How do you allocate the value of
the sales conversion?
46
The conversion path (Google, 2013)
Some channels tend to have bad direct conversions,
therefore it’s important to see assisted conversions (you
can find them in Google Analytics).
47
1st touch Conversion
Assisting effect
Last touch2nd touch
What’s the length of the
conversion path?
Path length measures the number of
interactions leading to conversion
48
Less than half of the conversions take place
during the first interaction (ElÀmysLahjat.fi); a
similar result (47%) in Forrester study (2012)
Direct ROI of social media is oftentimes bad
49

but indirect ROI (assisted conversion)
might be better
50
So you see, this is partly the
solution! But there is another
one as well

”Last click fallacy”
a. Our analytics tool can only identify the last
interaction leading to conversion (i.e., we are blind
to the previous interactions).
b. Based on this information, we conclude that a
certain campaign or channel resulted in the
conversion, even though, when there are other
touch-points, at least some value should justifiably
be attributed to them as well.
‱ Why does this matter?
– the result is an attribution error, due to which we are
potentially making bad decisions. (think of funnel!)
– last-click model is the default choice in many systems
51
How can we solve last click fallacy?
52
Attribution models (Google, 2013)
Last touch  100% of conversion value to the last touch-point (e.g.
campaign, channel)
First touch  100% of conversion value to the first touch-point
Linear model  each touch-point receives an equal share of
conversion value (eg. 3 touches = 33% each)
Time-based model  based on a time factor, the touch-points
closest to conversion receive a larger share of conversion value
U-shape model  40% of conversion value to the first touch, 40% to
the last touch, and the rest 20% divided equally among the remaining
touch-points.
53
Which one is the best?
What do you think?
Attribution models: an example
First touch
model
Last touch
model
Linear
model
1 Facebook
2 Google organic
3 Google CPC
4 Blog article
54
‱ one conversion = 1000 €
‱ the conversion path includes four touch-points
in the following order
‱ how to attribute conversion value?
Attribution models: an example
First touch
model
Last touch
model
Linear
model
1 Facebook 1000€ 250€
2 Google organic 250€
3 Google CPC 250€
4 Blog article 1000€ 250€
55
‱ one conversion = 1000 €
‱ the conversion path includes four touch-points
in the following order
‱ how to attribute conversion value?
What are we still missing?
‱ multichannel effects
56
Universal analytics can help

57
Universal analytics (Brown, 2013)
‱ ”This is going to be a major factor in driving
organisations to migrate to Universal Analytics,
and a major benefit they’ll see as a result of doing
so. It’s all thanks to the Measurement Protocol
which is one of the core components of Universal
Analytics.
‱ It allows us to send data from pretty much any
device, and collect it in Universal Analytics. This
means we can finally link in-store transactions
with campaigns and, via a loyalty card tagged to a
User ID, with an entire history of user interactions
with our brand.”
58
Universal Analytics: combining online and
offline measurement (Intrieri, 2014)
59
Other means to measure offline actions

60
Basic ways to measure offline sales
“An eye doctor spends $5,000 in one year to bring 10,000 visitors to
her website. In the same year, the doctor spends $5,000 on an ad in
a local weekly newspaper. Discuss the limitations and advantages of
each type of advertising. Describe how you might track each type of
advertising.” (Google, 2007)
Measurement tactics:
a. Promotion code (shopping cart -> CMS)
a. code “OPTICAL”, -10%
b. Distinguishing URL (Analytics)
a. Carrefour.fr/Achan
61
We’re in the middle of the analytics
revolution. All these problems will be
solved, and you can be a part of the
solution!
62
Thank you. Keep it up guys!
63

Web Analytics (Digital Marketing '15 @ Oulu University)

  • 1.
    PhD Joni Salminen joolsa@utu.fi TurkuSchool of Economics, presented at Oulu University 2015 DIGITAL ANALYTICS – WEB ANALYTICS & DIGITAL MARKETING METRCS 1
  • 2.
  • 3.
  • 4.
    Problem 1: Wanamaker’sdilemma (ca. 1901) “Half the money I spend on advertising is wasted; the trouble is I don’t know which half.” ‱ The marketer uses several channels for advertising. ‱ He knows advertising increases sales. ‱ But: which channel and how much? If we cannot measure the results, it’s harder to improve (i.e. kill bad channels and scale up good ones). 4
  • 5.
    Voilà! Wanamaker dilemmasolved (let’s go home
) 5 Channel Sales Problem solved?
  • 6.
    Problem 2: Marketer’sintuition 6 The more experienced a marketer is, the better he thinks he knows things beforehand  However, even an experienced professional can be wrong. With experience, the speed for evaluating different alternatives increases. Simultaneously the ability to think beyond them decreases.  Never forget the fallacy of marketer’s intuition

  • 7.
    Analytics overcomes marketer’sintuition “After analyzing the online buying behavior of over 600,000 consumers across numerous e-commerce sites, I learned that surprisingly 75 percent of shopping cart abandoners would actually return to the site they abandoned within a 28-day period. This defies conventional wisdom: we polled online marketers and 81 percent believed that the majority of abandoners never return.” (SeeWhy, 2013) 7 I’m a marketer. I’m always right!
  • 8.
    Finally, don’t forget
 Thereare good opportunities in the job market for people who know analytics! 8
  • 9.
  • 10.
    What is analytics? “DigitalAnalytics is the analysis of qualitative and quantitative data from your business and your competition to drive a continual improvement of the online experience that your customers and potential customers have which translates to your desired outcomes, both offline and online.” (Kaushik, 2010) 10
  • 11.
    Four types ofanalytics (Gartner, 2015) 11
  • 12.
    Internal and externalanalytics a. Internal analytics = analyzing the data from own website and properties such as social media pages in order to improve the likelihood of desired business results (e.g. Google Analytics, CMS, CRM) b. External analytics = analyzing competitors or the market (cf. business intelligence, competitive intelligence) (SimilarWeb, Google Trends, Facebook Audience Insights) 12
  • 13.
    There are twotypes of traffic (hence, analytics
) Analytics of organic traffic Analytics of paid traffic Google Search Console Google AdWords Facebook Facebook Insights Facebook Ads Manager 13 Google Analytics shows what happens after the click, these show what happens before the click (data is in the platforms).
  • 14.
    Ways to setup an analytics infrastructure a. In-house (tailored system) b. Ready-made tools (e.g. Google Analytics, KissMetrics) Each one has advantages and disadvantages; for example, in-house systems give the most accurate conversion data, but take time and money to build. 14
  • 15.
  • 16.
    How does analyticswork? (Mullins, 2011) 16 Website Javascript code Server Processing
  • 17.
    The application ofanalytics ‱ analytics can be used for two things (Salenius & Salminen, 2015): 1) reporting 2) optimizing 3) strategic insight ‱ While analytics (data) is the requisite for optimization, it’s also the pathway to automatization. 17
  • 18.
    What kind ofquestions can we answer with the help of analytics? ‱ What’s the most profitable source of visitors? ‱ What products are people buying? How much is the average order size? ‱ Where do users come from? How long do they stay on the site? ‱ How do new visitors behave in comparison to old ones? ‱ What content is the most/less viewed? ‱ What keywords people use to find our site? ‱ Where do people exit the site? 18
  • 19.
  • 20.
    Objective → Goal→ Metric ‱ Objective: a broader goal, i.e. capture market share from competitors ‱ Goal: a specific goal, like gain 30% of market share by the end of 2015 ‱ Metrics: market share, market growth, generated leads, sent quotes, closed sales 20
  • 21.
    Let’s look atthe most common digital marketing metrics. In addition to showing performance, some of them are used as pricing models for online advertising. 21
  • 22.
    CPM (cost-per-mille) ‱ Theprice for thousand impressions. ‱ NB! This is what we call a ”vanity metric”, used by media sales people to sell inventory but useless for business purposes 22 The good The bad Emulates reach, i.e. proxy for increase in awareness which is a requisite for branding Banner blindness (Benway & Lane, 1998) Waste (lack of targeting, mass media approach) Does not tell about the performance; will someone click and what happens after the click
  • 23.
    CPC (cost-per-click) ‱ Theprice of a click, i.e. visitor (€) 23 The good The bad Bypasses banner blindness (the user first need to process to click) Click fraud (even up to 50% of clicks can be fraudulent) As a metric, you see performance. As a payment method, you pay for performance. A click does not contain information about conversion A skillful traffic-oriented marketer can drive irrelevant traffic, in which case the company ”pays for nothing”
  • 24.
    CTR (click-through-rate) ‱ Ratio(%) ‱ CTR = users who clicked / all who saw the ad 24 The good The bad Tells how well an ad performs Does not tell how qualified the traffic is, or how good of a match the landing page and the ad has Indicates relevance & quality Does not correlate with sales, ad recall, awareness or purchase intent (Nielsen, 2011) CTR can be artificially manipulated by over- promising ads
  • 25.
    CPA (cost-per-action) ‱ Thecost of a desired action, e.g. sales conversion or acquired lead (€) 25 The good The bad Bypasses click fraud by showing after-click performance As a pricing method it’s rare – in practice only affiliates As a pricing method it’s great – you only pay for conversions As a measure it doesn’t tell what happens after 1st purchase (relationship) Also, does not tell about revenue, how many converted, or how good relative performance was Misses externality effects, such as latent conversions and word-of-mouth
  • 26.
    CVR (conversion rate) ‱A relative number (%) ‱ CVR = users who bought / all visitors 26 The good The bad Tells what has happened after the click Does not measure profit Does not measures volumes of spend or revenue (e.g. small insignificant search terms) (Geddes, 2011)
  • 27.
    ROI (return oninvestment) ‱ ROI = (P – C) / C * 100% , ‱ where – P = the revenue from an investment (e.g. campaign) – C = cost 27 The good The bad Tells what happened after click Does not consider margin (a good ROI can still mean unprofitable marketing) Considers sales revenue Does not consider lifetime revenue
  • 28.
    CLV (customer lifetimevalue) ‱ All the revenue a customer brings during the his or her period of patronage (€) ‱ In general, the goal is CAC < CLV, in which CAC is customer acquisition cost 28 The good The bad Takes into account what happens after purchase (customer loyalty, churn) Hard to measure The exact figure is known only afterwards
  • 29.
    CONCLUSION: No metricis perfect ‱ CPM  banner blindness ‱ CTR  indicates quality / match, but does not tell about conversions or revenue ‱ CVR  tells about how efficiently a conversion is reached, but not how big the purchase is ‱ CPA  misses latent effects, lifetime revenue and word-of-mouth ‱ ROI  does not consider product margin ‱ CLV  hard to measure, known only afterwards ‱ Best to use a combination, and to understand limitations. 29
  • 30.
    How to choosemetrics? Some considerations
 30
  • 31.
    Basic business objectivesin digital marketing (Google, 2015) 1. For ecommerce sites, an obvious objective is selling products or services. 2. For lead generation sites, the goal is to collect user information for sales teams to connect with potential leads. 3. For content publishers, the goal is to encourage engagement and frequent visitation. 4. For online informational or support sites, helping users find the information they need at the right time is of primary importance. 5. For branding, the main objective is to drive awareness, engagement and loyalty. 31
  • 32.
    Metrics differ bychannel and campaign
 Why? Because of funnel thinking (AIDA), i.e. because at different times people are at different stages of the purchase process (customer journey). Thus, the marketing goals naturally fluctuate; a direct response like sales is not always the main point. Metrics are therefore chosen based on platforms to represent marketing performance in different stages of the purchase process. 32
  • 33.
    A brand mayonly have goals relating to awareness creation
 (
) click-through is not always what advertising online has to be about. Do you think Pepsi or Coca-Cola (assuming they buy FB ads) would give two shits if you click their ads? You're not going to buy a Pepsi online! They don't get click- through on TV, billboards, print ads, or any of their other marketing material. But they spend millions every year on that stuff because they get EXPOSURE. You see their logo and an icy, fizzy, sweet-looking Pepsi enough times and you want one. That’s what they’re banking on.” (Anonym, 2012) 33
  • 34.
    How to choosemetrics? a. sales metrics (these are measured in campaigns that are sales-oriented, e.g. product campaigns) b. visibility metrics (these are measured for brand identity and awareness campaigns) It’s a crude but efficient division, as all campaigns can ultimately divided between direct response and latent or indirect response. 34 Metrics are like lovers; they complete each other.
  • 35.
    Make sure youinclude both absolute and relative metrics a. absolute (€) b. relative (%) ‱ use absolute metrics to find out the scale (e.g., is Facebook a major source of sales compared to Google?) ‱ use relative metrics to find out the potential (Could Facebook become a major source of sales?) 35 Metrics are like lovers; they complete each other.
  • 36.
    How to choosemetrics? A summary Consider: ‱ The overall goals of marketing efforts ‱ The role of the channel in achieving those goals ‱ The natural role of the channel in the purchase process 36
  • 37.
    But all isnot well in the metrics kingdom
 37
  • 38.
    ”Are we measuringwhat is easy to measure or what is meaningful to measure?” 38 (JĂ€rvinen, 2015)
  • 39.
    Challenges in measuringthe effectiveness of digital marketing (JĂ€rvinen, 2015) Organizational challenges: 1. Metrics selection 2. Refining metrics data into actionable insights 3. Contextual factors (internal): – Analytical skills – IT tools and infrastructure – Senior management commitment – Leadership – Organizational culture The real challenges: 1. Understanding the complexity of factors (endogenous & exogenous) that affect consumer decision-making 2. Determining the long-term impacts of marketing communications on sales (i.e., linking marketing actions on long-term outcomes) 39
  • 40.
    Two risks indata a. Analysis paralysis = we’re unable to act, because there’s just too much data b. Vanity metrics = we follow metrics that are irrelevant for business goals and pretend we’re working well. The solution for both: focusing on the right questions and metrics. 40
  • 41.
    Actionable metrics vs.vanity metrics (Maurya, 2010) “An actionable metric is one that ties specific and repeatable actions to observed results.” – Examples: conversion rate in a direct response campaign, number of leads generated from a lead magnet campaign, bounce rate of campaign + landing page in comparison to site average “The opposite of actionable metrics are vanity metrics (like web hits or number of downloads) which only serve to document the current state of the product but offer no insight into how we got here or what to do next.” – Examples: Facebook fans, ad impressions, even visitors in some cases 41
  • 42.
    Aggregation problem ‱ Alldata looks the same when looking from far enough! ‱ The solution: ‱ segmentation 42
  • 43.
    Segmentation ‱ Segmentation isolatesyour data into sub-sets for a deeper analysis, and thereby solves the aggregation problem. ‱ You can segment the data by – date and time – user’s device – marketing channels – geographical location – etc. (dozens of options!) 43
  • 44.
    Optimization for platformmetrics can be in conflict with business goals 44 Which ad is more successful? Ad A Ad B Quality score 10 3 CTR 10 % 3 % Impressions 1000 1000 Clicks 100 30 Conversions 15 15 Revenue 1500 € 1500 € Cost 500 € 150 €
  • 45.
    Optimization for platformmetrics can be in conflict with business goals 45 Ad A Ad B Quality score 10 3 CTR 10 % 3 % Impressions 1000 1000 Clicks 100 30 Conversions 15 15 Revenue 1500 € 1500 € Cost 500 € 150 € ROI 200 900%
  • 46.
    Attributing sales value ‱You are the manager of an ecommerce site ‱ You have one sales conversion worth 1000€ ‱ From analytics, you can see that four clicks have preceded the conversion ‱ The last click came from a search-engine with a specific keyword. How do you allocate the value of the sales conversion? 46
  • 47.
    The conversion path(Google, 2013) Some channels tend to have bad direct conversions, therefore it’s important to see assisted conversions (you can find them in Google Analytics). 47 1st touch Conversion Assisting effect Last touch2nd touch What’s the length of the conversion path?
  • 48.
    Path length measuresthe number of interactions leading to conversion 48 Less than half of the conversions take place during the first interaction (ElÀmysLahjat.fi); a similar result (47%) in Forrester study (2012)
  • 49.
    Direct ROI ofsocial media is oftentimes bad 49
  • 50.
    
but indirect ROI(assisted conversion) might be better 50 So you see, this is partly the solution! But there is another one as well

  • 51.
    ”Last click fallacy” a.Our analytics tool can only identify the last interaction leading to conversion (i.e., we are blind to the previous interactions). b. Based on this information, we conclude that a certain campaign or channel resulted in the conversion, even though, when there are other touch-points, at least some value should justifiably be attributed to them as well. ‱ Why does this matter? – the result is an attribution error, due to which we are potentially making bad decisions. (think of funnel!) – last-click model is the default choice in many systems 51
  • 52.
    How can wesolve last click fallacy? 52
  • 53.
    Attribution models (Google,2013) Last touch  100% of conversion value to the last touch-point (e.g. campaign, channel) First touch  100% of conversion value to the first touch-point Linear model  each touch-point receives an equal share of conversion value (eg. 3 touches = 33% each) Time-based model  based on a time factor, the touch-points closest to conversion receive a larger share of conversion value U-shape model  40% of conversion value to the first touch, 40% to the last touch, and the rest 20% divided equally among the remaining touch-points. 53 Which one is the best? What do you think?
  • 54.
    Attribution models: anexample First touch model Last touch model Linear model 1 Facebook 2 Google organic 3 Google CPC 4 Blog article 54 ‱ one conversion = 1000 € ‱ the conversion path includes four touch-points in the following order ‱ how to attribute conversion value?
  • 55.
    Attribution models: anexample First touch model Last touch model Linear model 1 Facebook 1000€ 250€ 2 Google organic 250€ 3 Google CPC 250€ 4 Blog article 1000€ 250€ 55 ‱ one conversion = 1000 € ‱ the conversion path includes four touch-points in the following order ‱ how to attribute conversion value?
  • 56.
    What are westill missing? ‱ multichannel effects 56
  • 57.
  • 58.
    Universal analytics (Brown,2013) ‱ ”This is going to be a major factor in driving organisations to migrate to Universal Analytics, and a major benefit they’ll see as a result of doing so. It’s all thanks to the Measurement Protocol which is one of the core components of Universal Analytics. ‱ It allows us to send data from pretty much any device, and collect it in Universal Analytics. This means we can finally link in-store transactions with campaigns and, via a loyalty card tagged to a User ID, with an entire history of user interactions with our brand.” 58
  • 59.
    Universal Analytics: combiningonline and offline measurement (Intrieri, 2014) 59
  • 60.
    Other means tomeasure offline actions
 60
  • 61.
    Basic ways tomeasure offline sales “An eye doctor spends $5,000 in one year to bring 10,000 visitors to her website. In the same year, the doctor spends $5,000 on an ad in a local weekly newspaper. Discuss the limitations and advantages of each type of advertising. Describe how you might track each type of advertising.” (Google, 2007) Measurement tactics: a. Promotion code (shopping cart -> CMS) a. code “OPTICAL”, -10% b. Distinguishing URL (Analytics) a. Carrefour.fr/Achan 61
  • 62.
    We’re in themiddle of the analytics revolution. All these problems will be solved, and you can be a part of the solution! 62
  • 63.
    Thank you. Keepit up guys! 63