Downloaded 216 times

![Definitive Guide to Marketing Metrics and Analytics
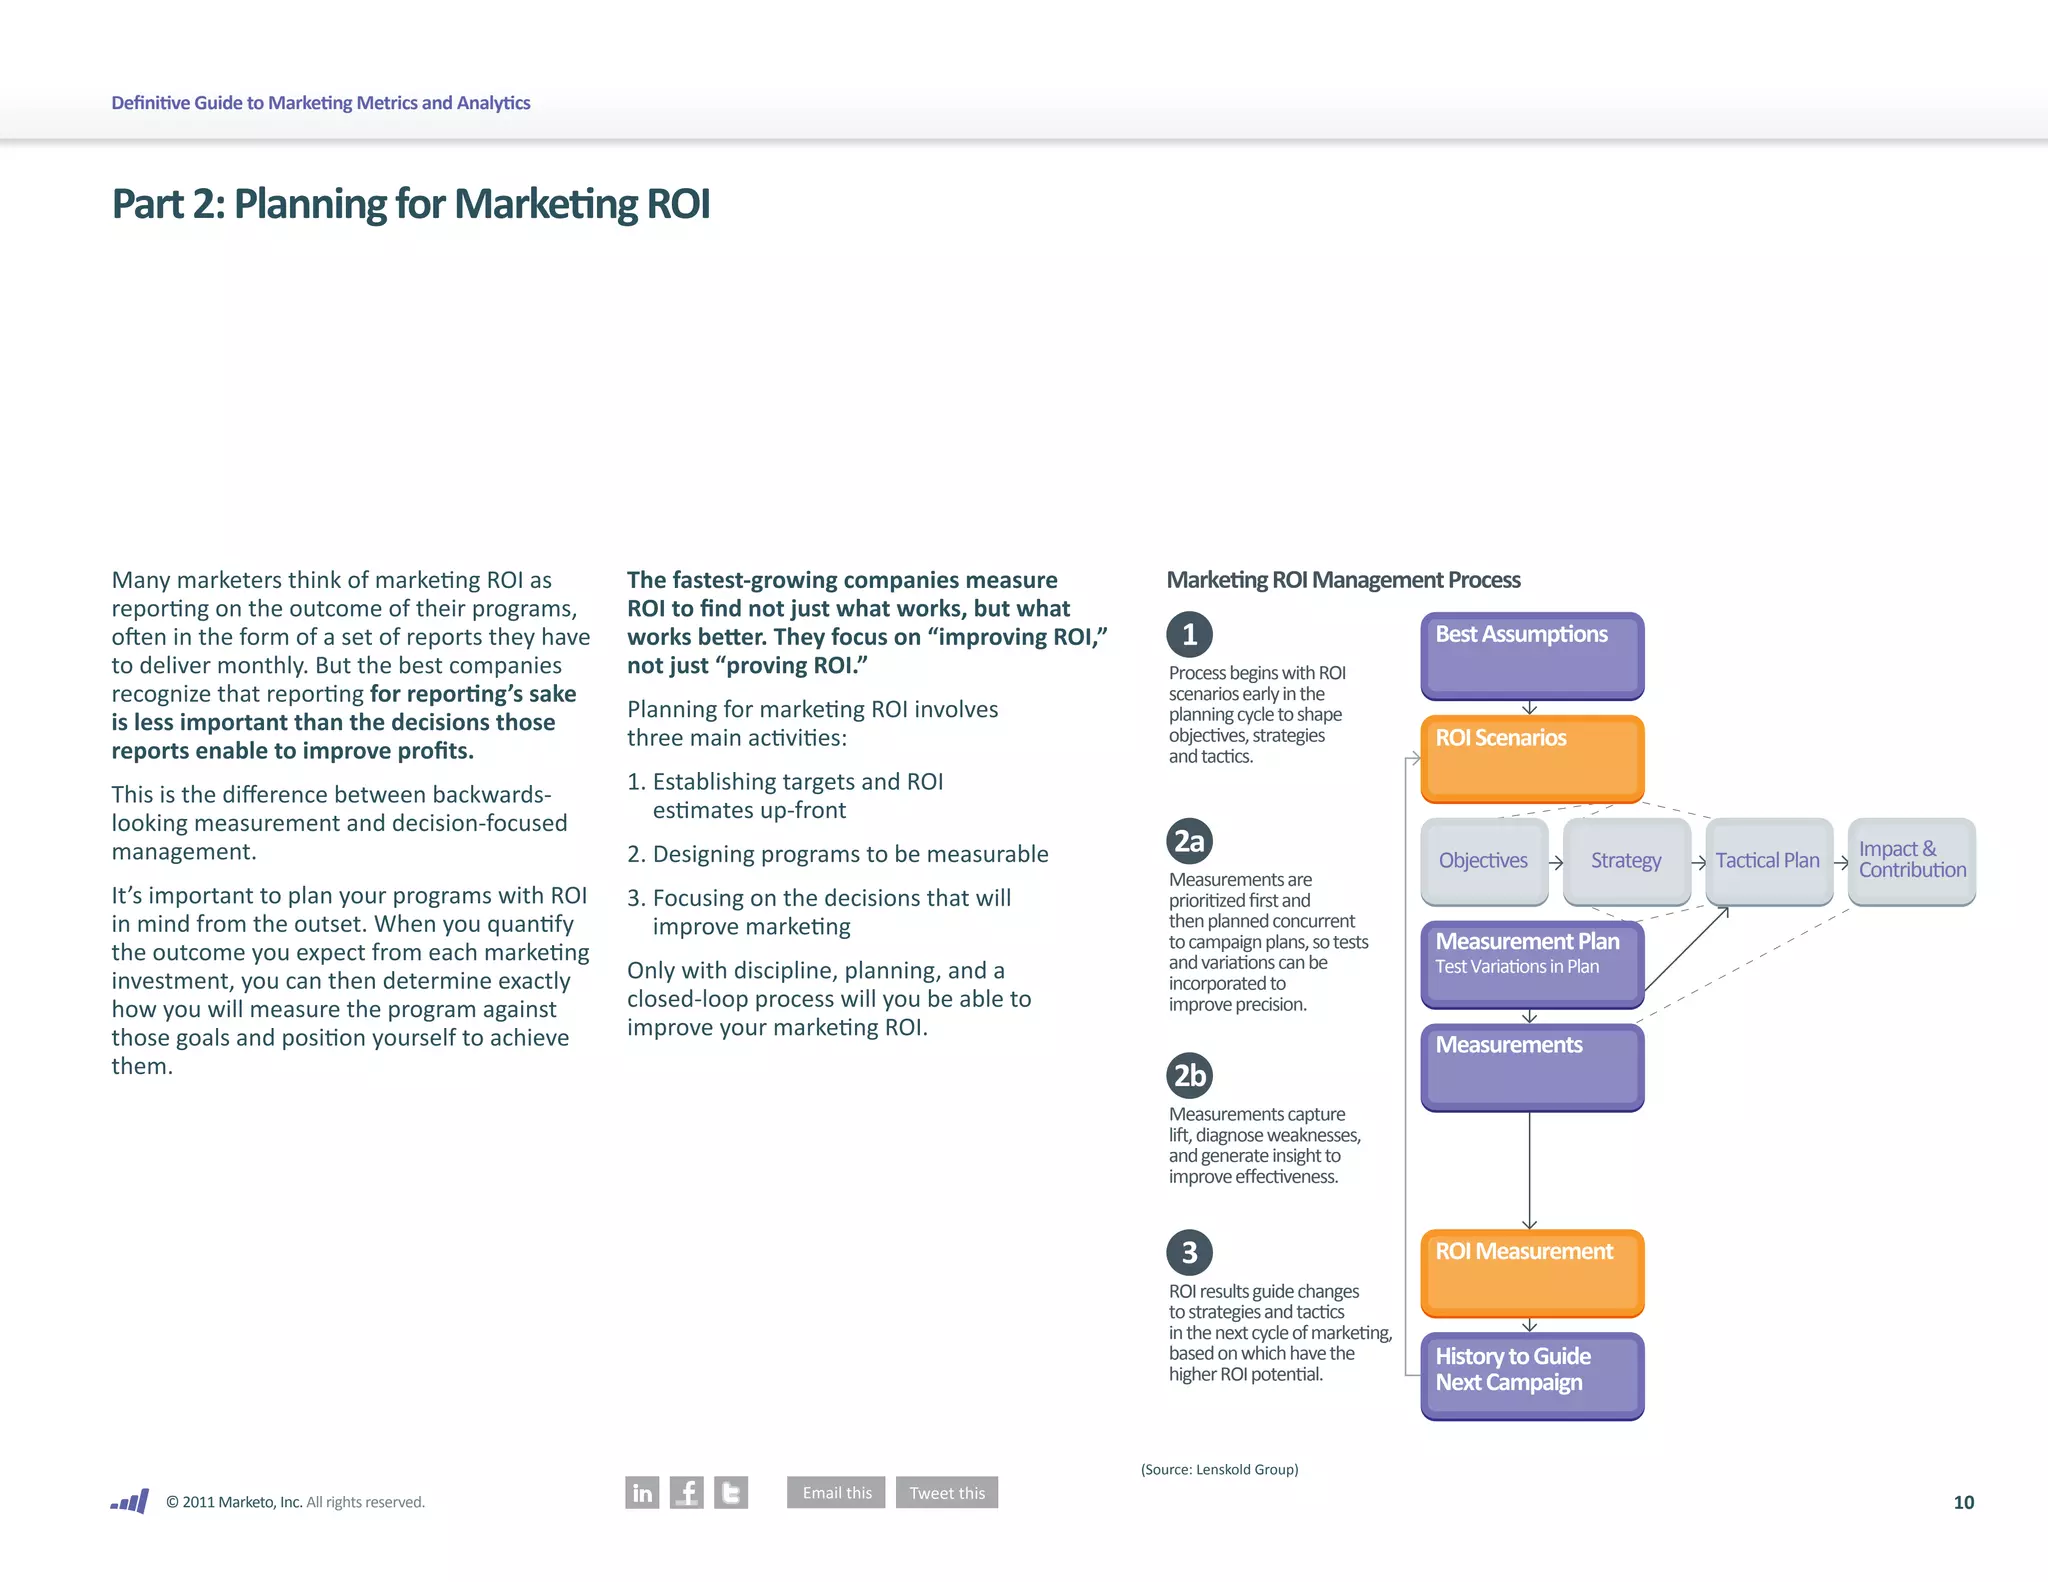
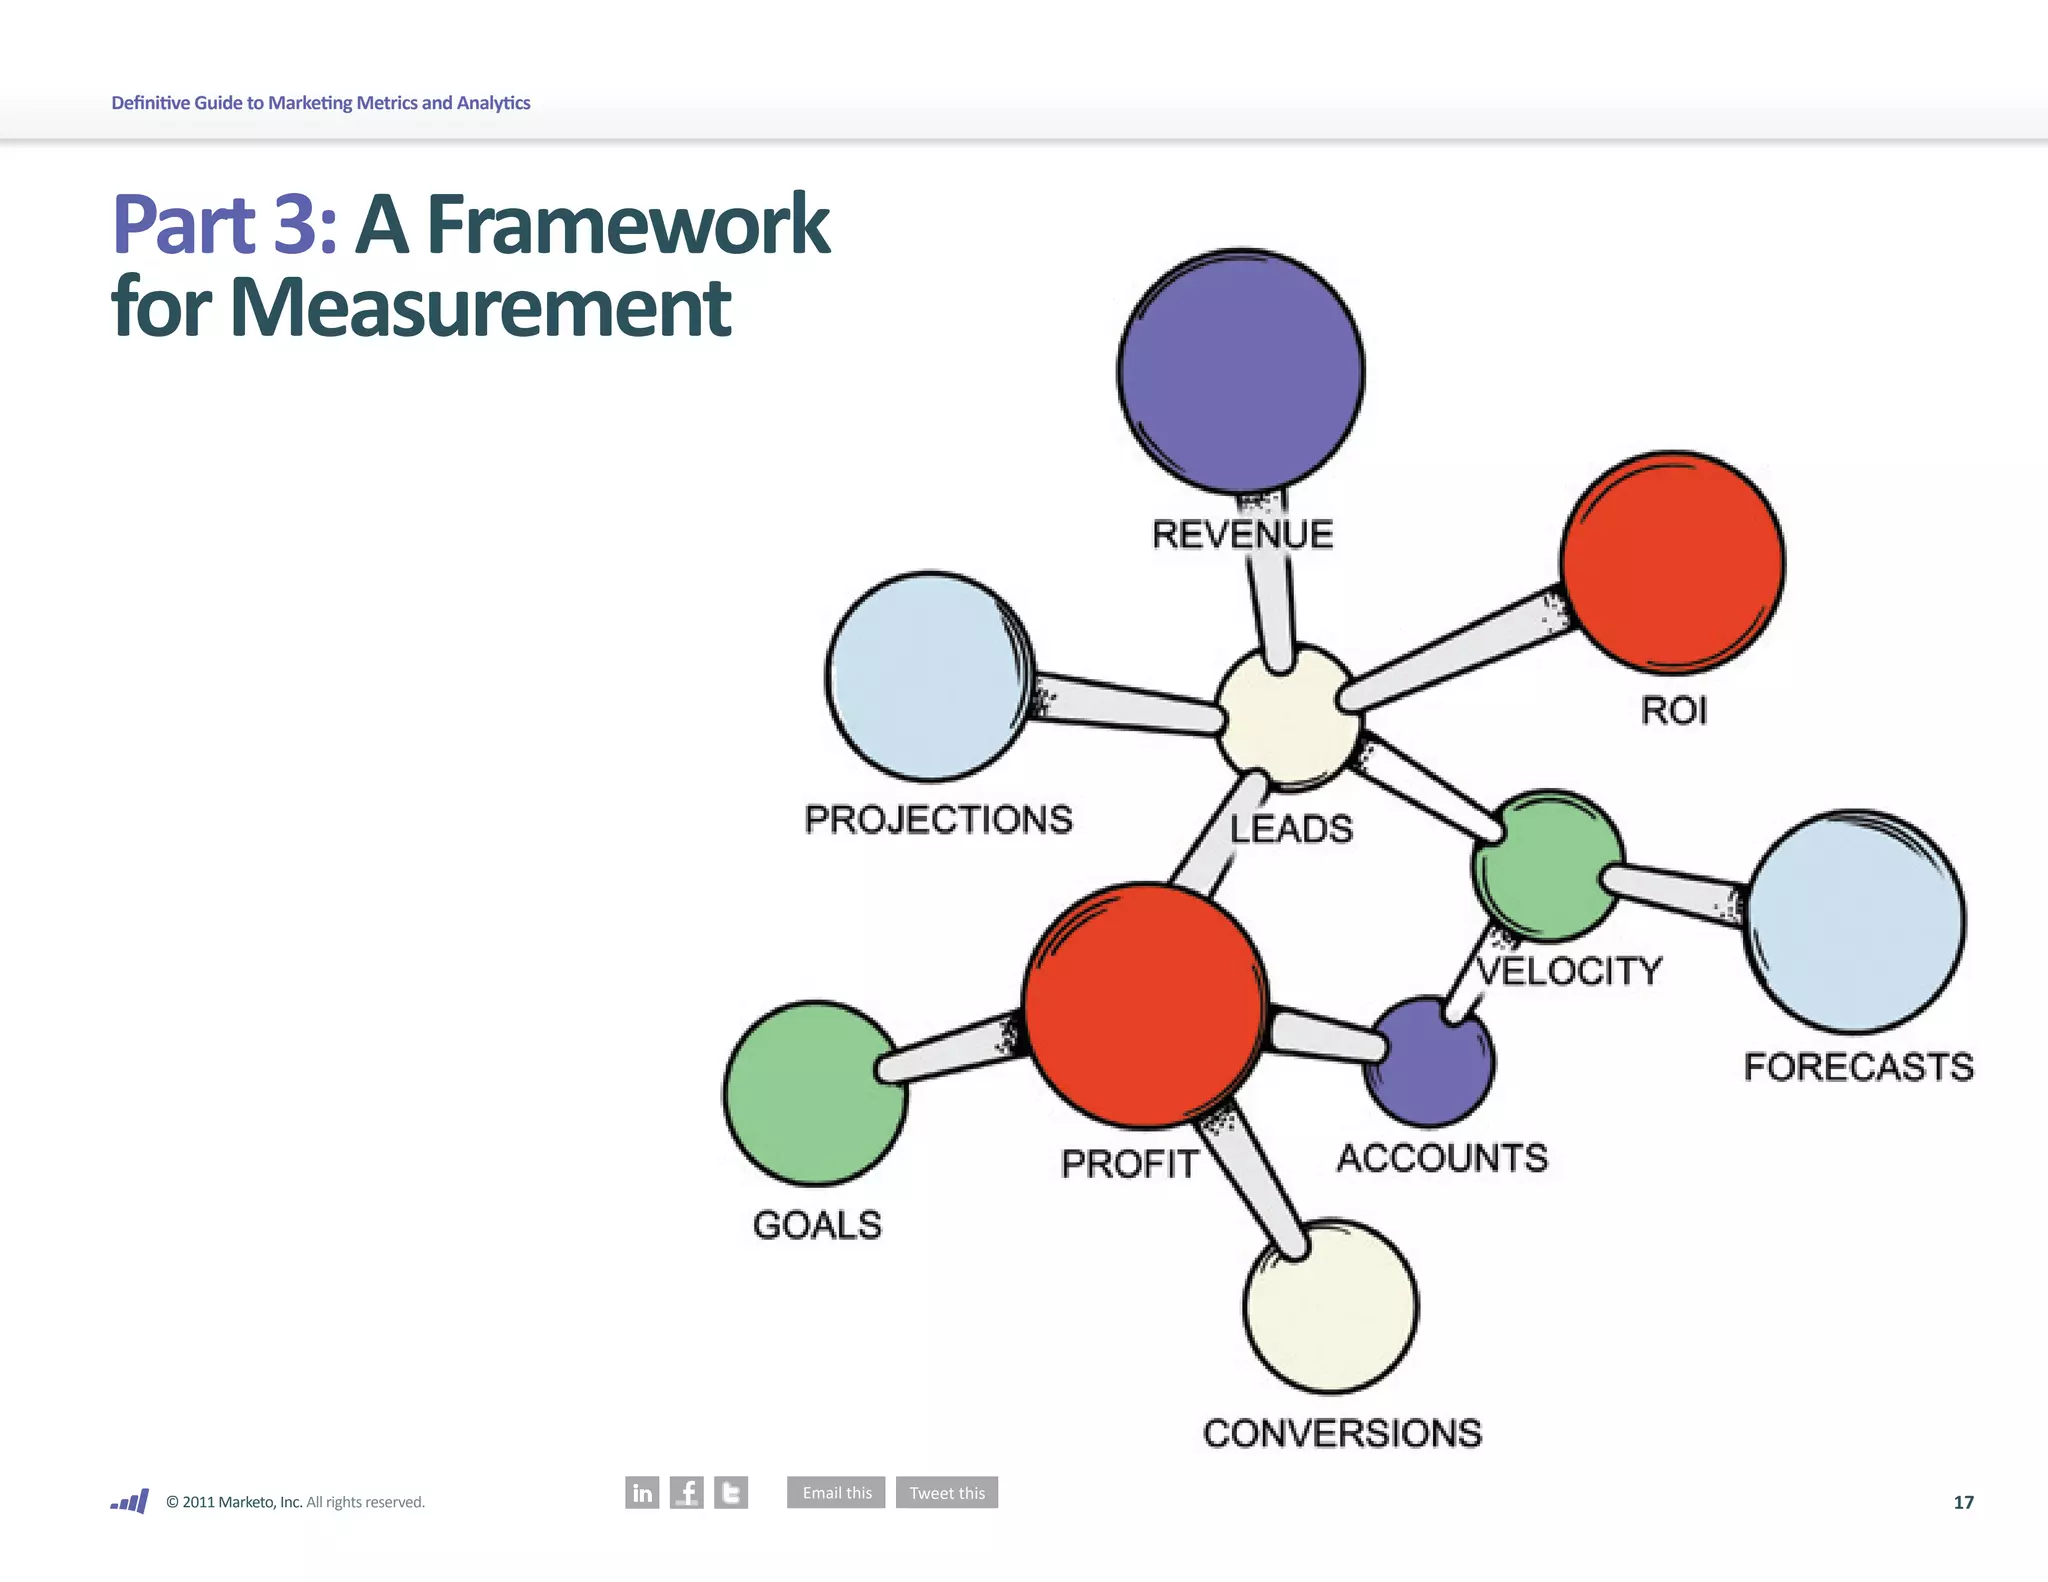
Part 3: A Framework for Measurement
CEOs and boards don’t care about 99% of There are many other areas of marketing
the metrics that marketers track – but they metrics that are not addressed directly in this
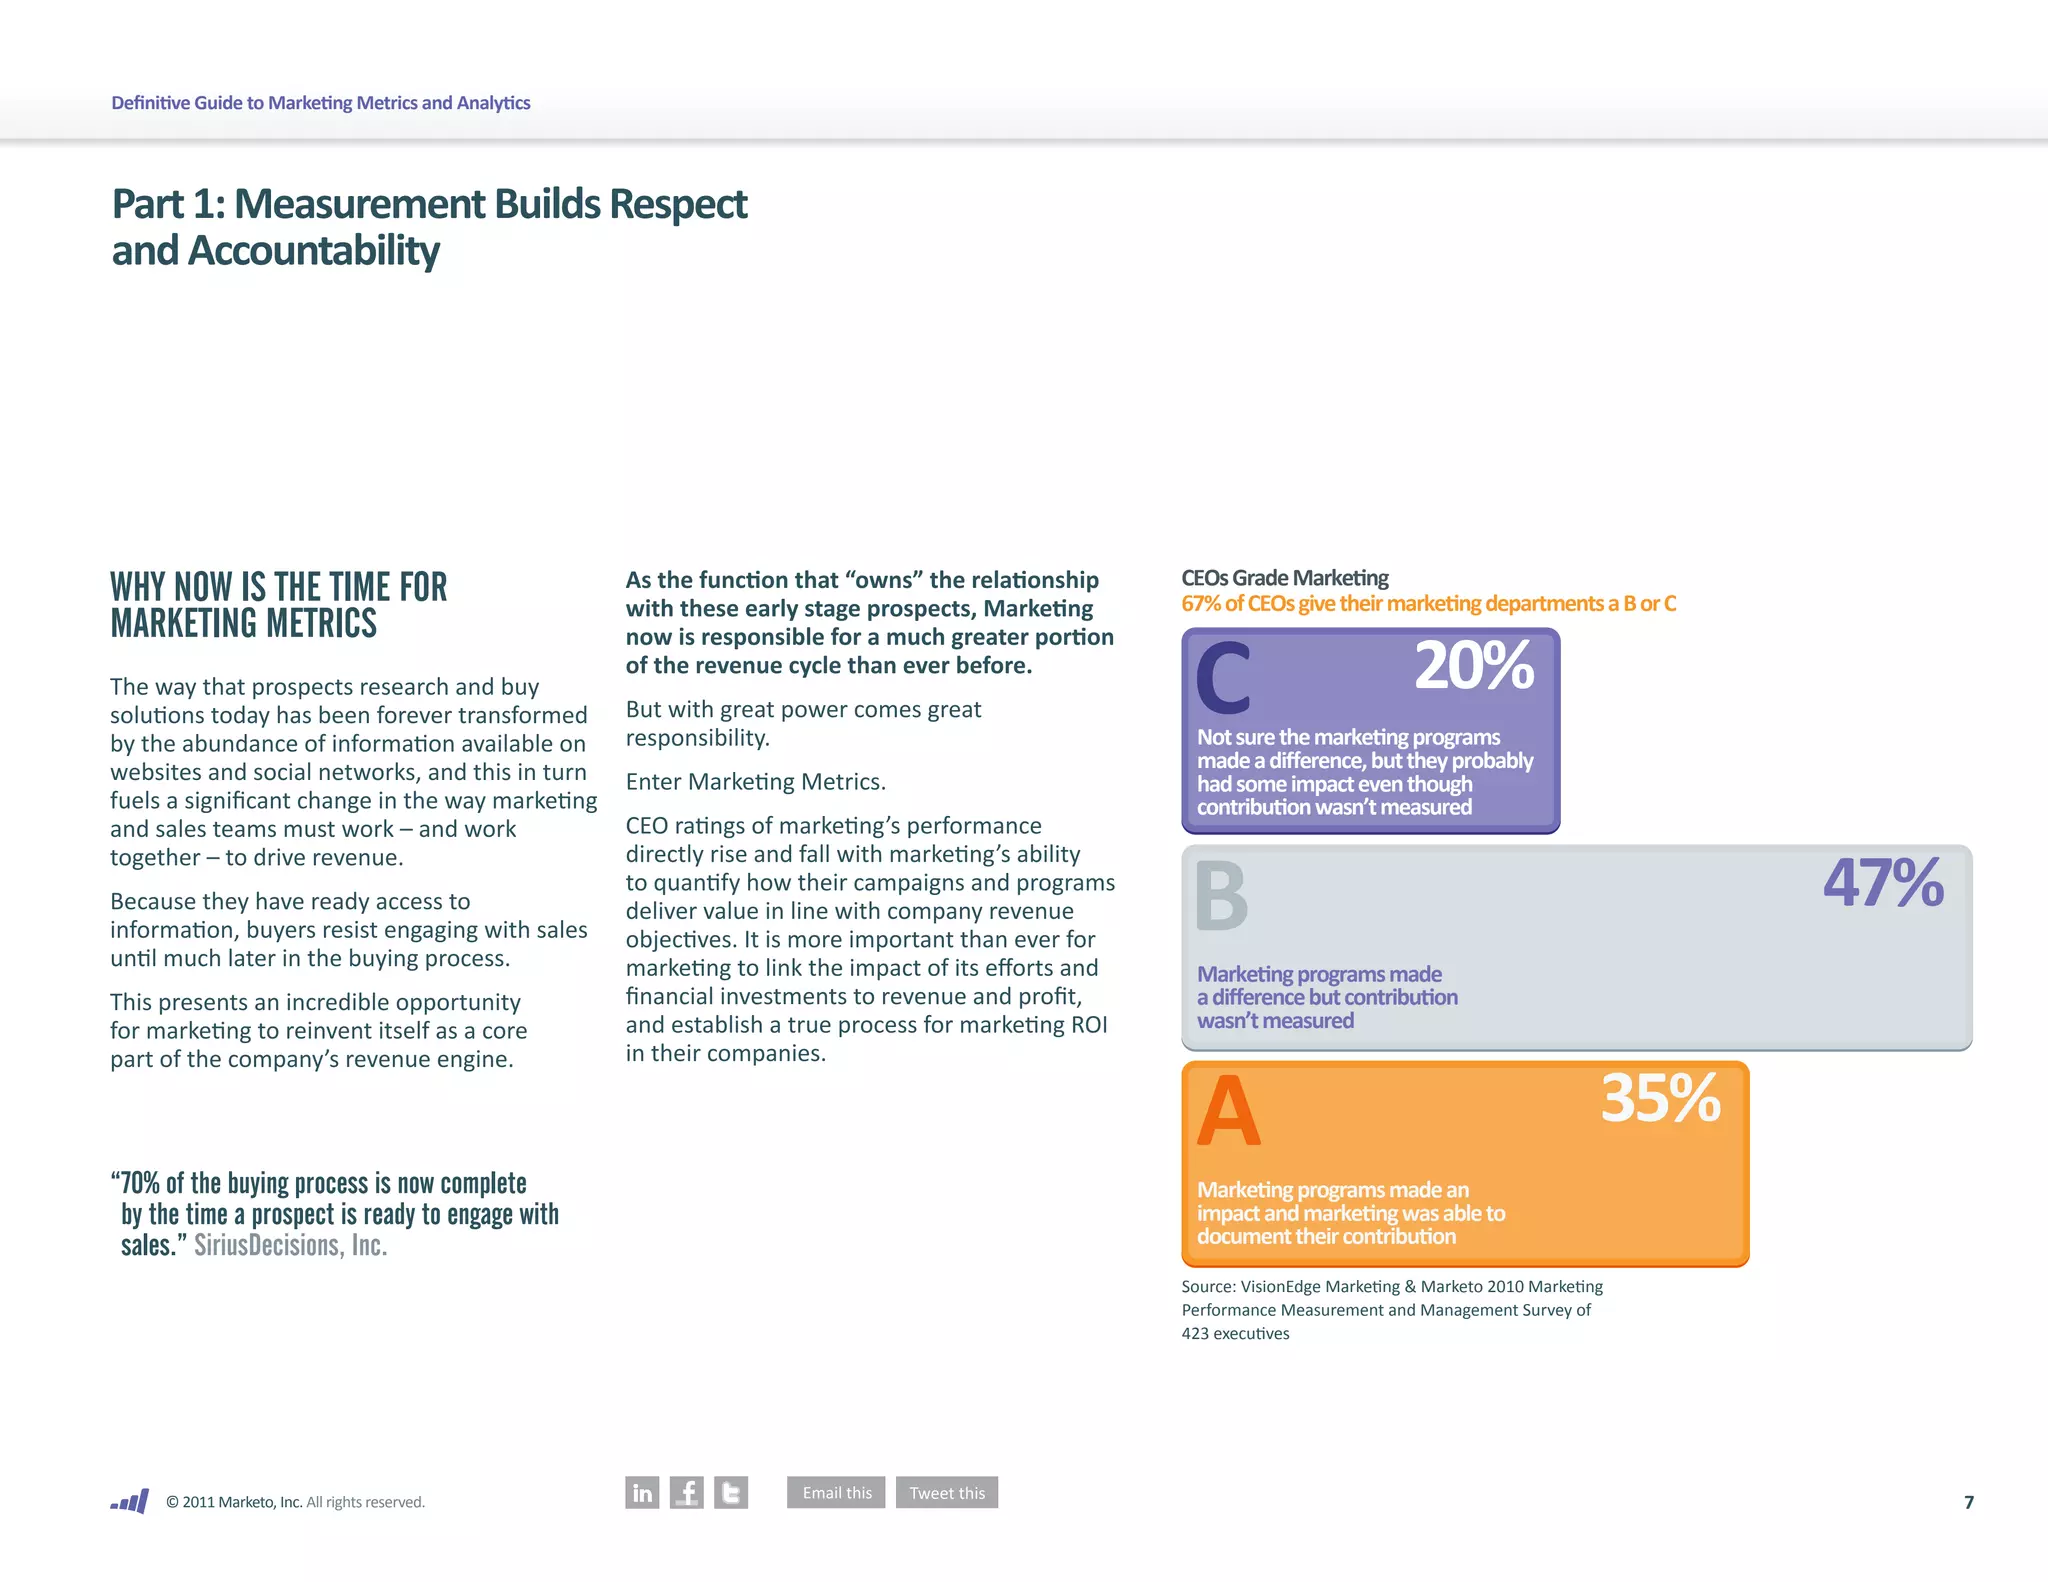
do care about revenue and profit growth. Guide. These include: CUSTOMER SATISFACTION AND NET PROMOTER SCORES
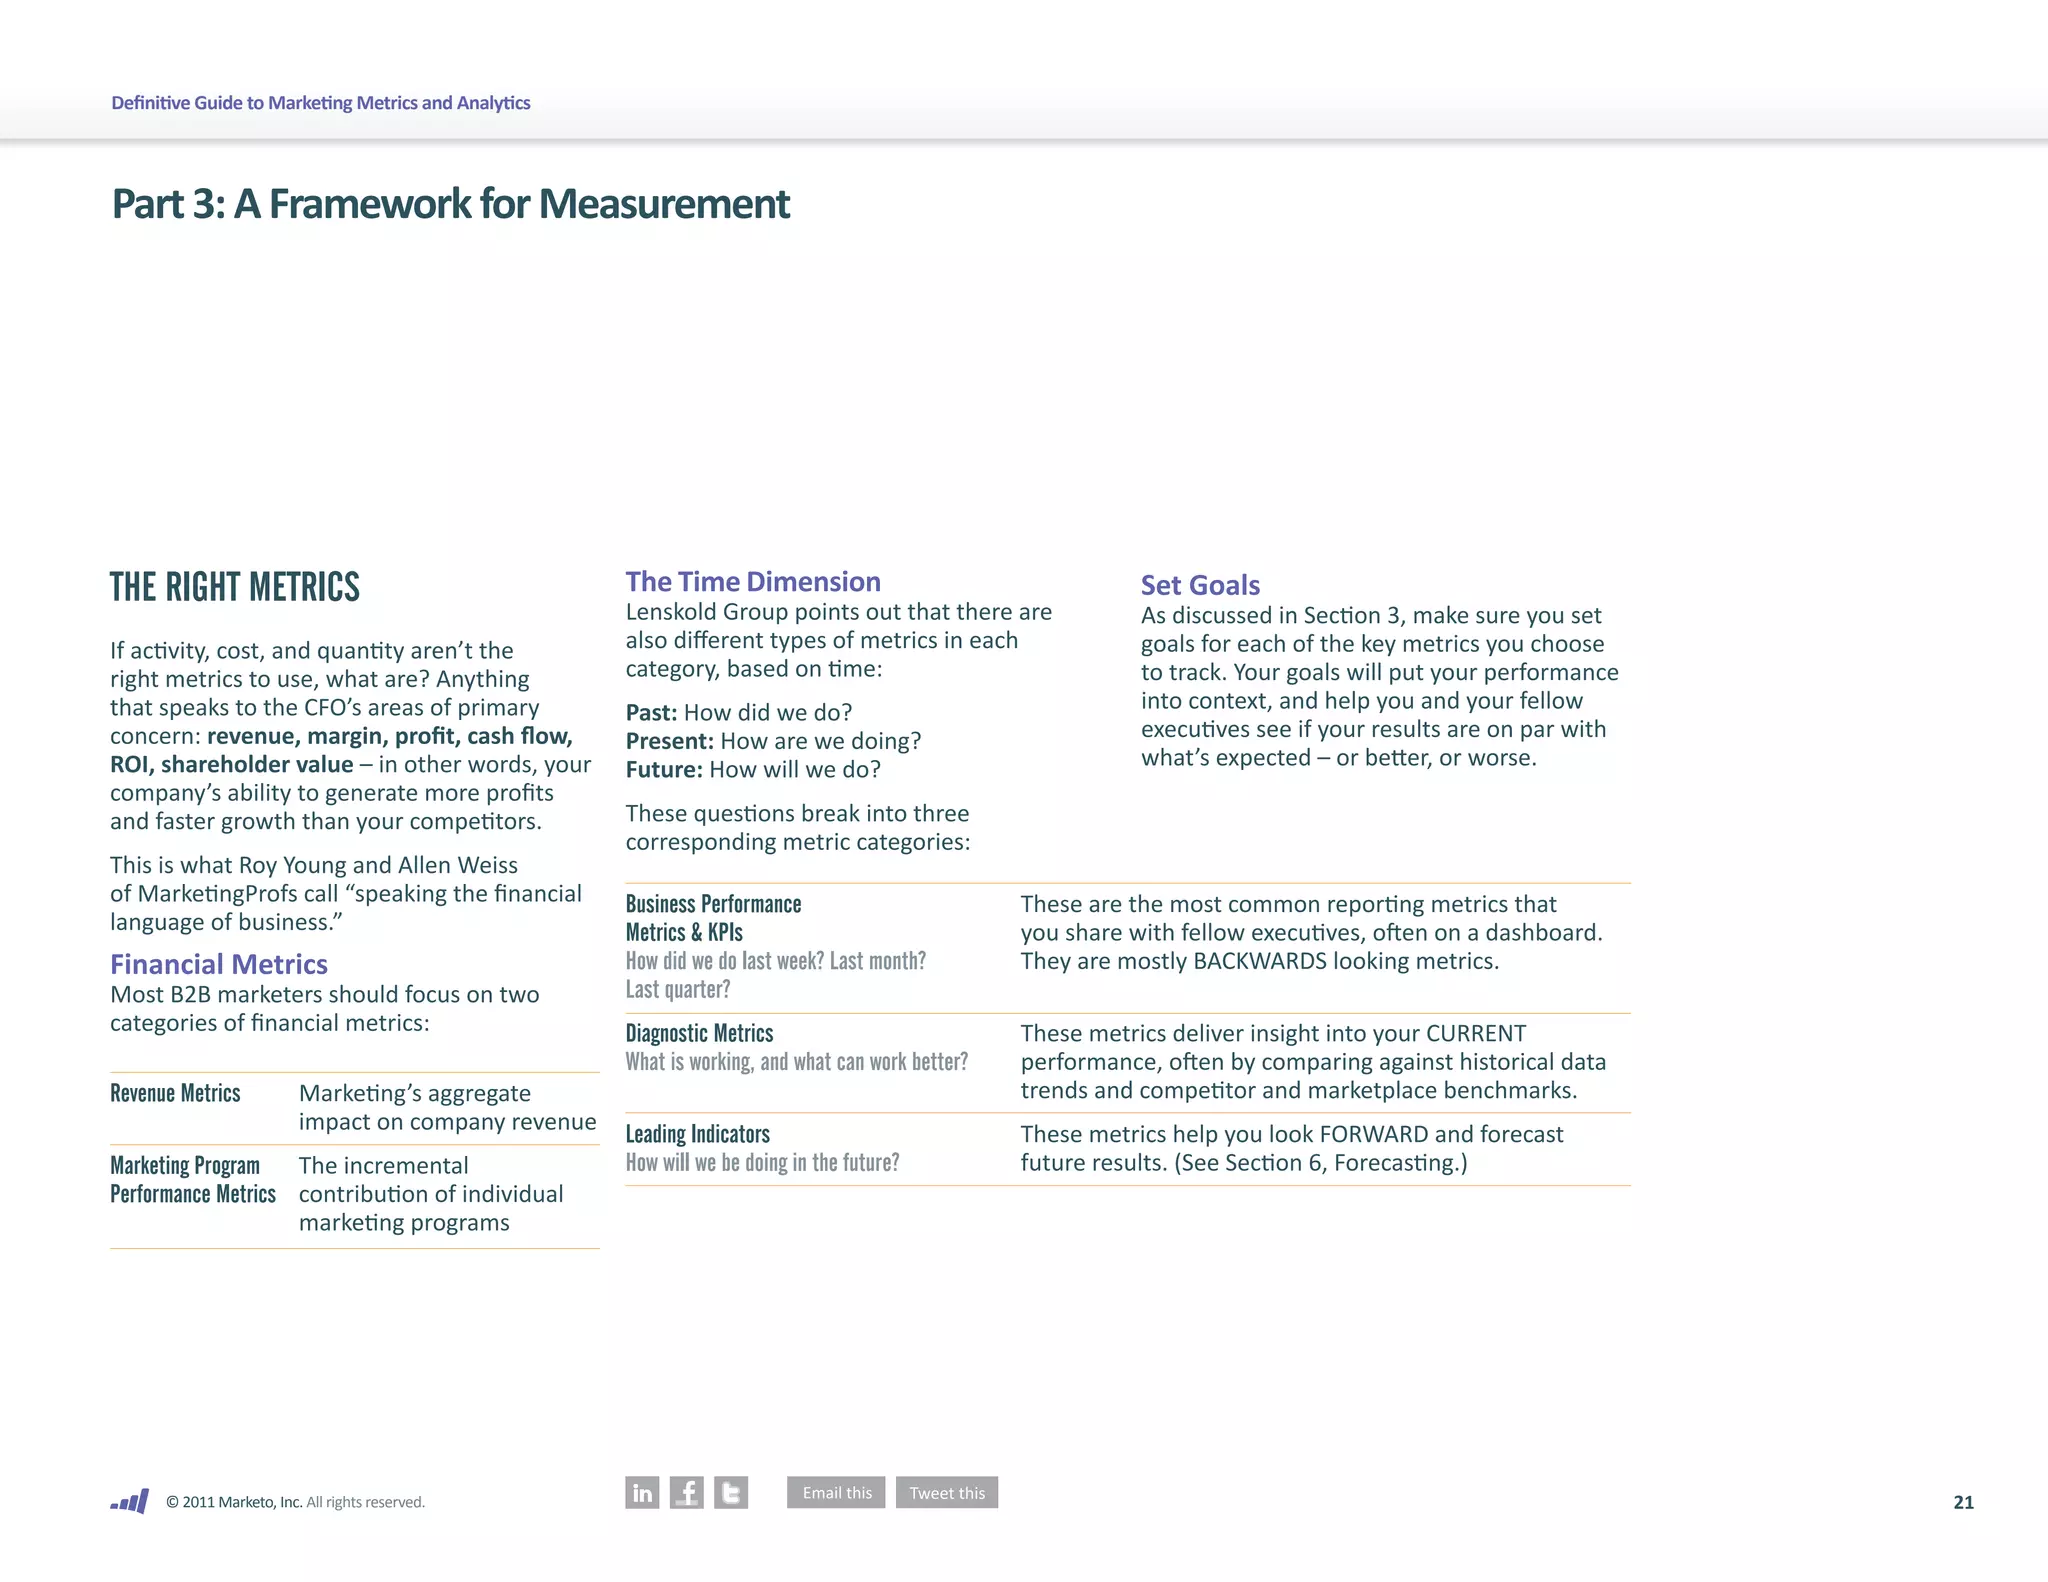
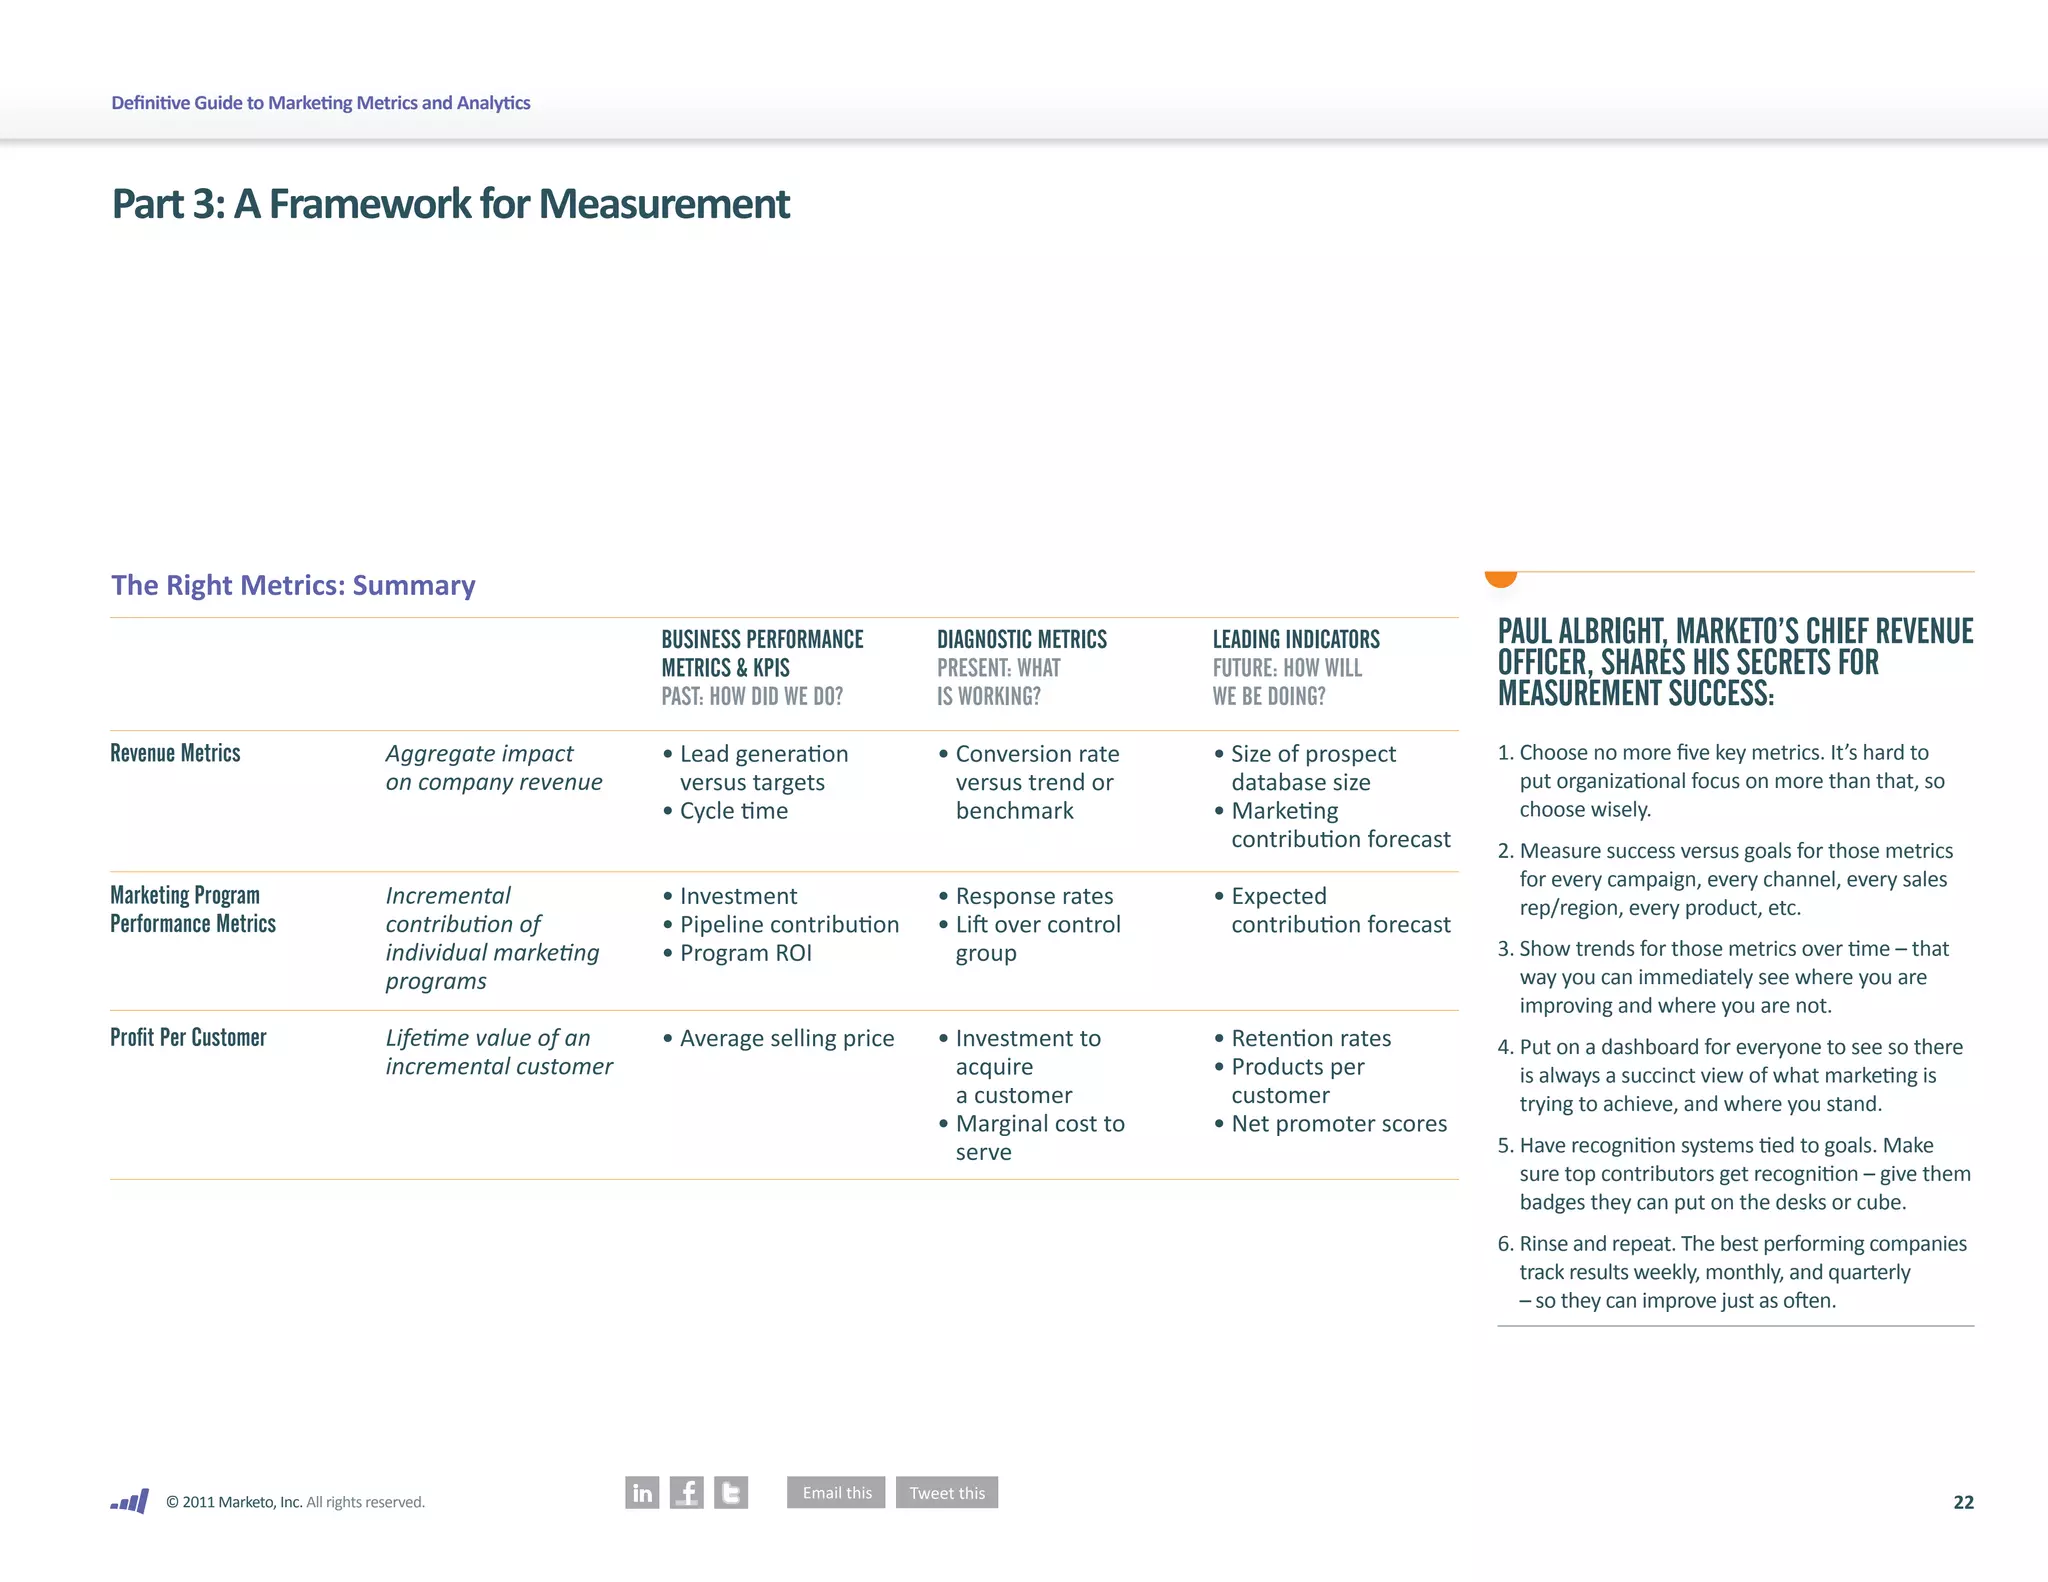
There are two primary categories of financial Customer Profitability: Lifetime value of an For many companies, a key metric is their Net Promoter Score (NPS),
metrics that directly affect revenue and profits: incremental customer a customer loyalty metric based on customer answers to the question,
• Revenue Metrics: Marketing’s aggregate Web Analytics: Measures Web visibility to “how likely are you to refer us to friend or colleague?” According to
impact on company revenue target audiences against potential audiences, answers on a 0-to-10 rating scale, customers are grouped into three
and compares against industry and competitor categories:
• Marketing Program Performance Metrics: benchmarks Promoters (9-10)
The incremental contribution of individual
marketing programs Public Relations: Measures views and impact Enthusiastic customers who will fuel growth with repeat and referral
of corporate communications initiatives business.
Passives (7-8)
Product Performance: Comparatively
Current customers susceptible to competitor offerings and thus have a
measures the total sales and margins of
neutral brand impact.
individual products
Detractors (0-6)
Brand Preference and Health: Assesses
Customers who voiced dissatisfaction and harm
brand preference in relation to preference for
the brand.
competing brands
To calculate a brand’s NPS, use the following equation:
Sales Tool Usage: Measures which product NPS = [% of Promoters] – [% of Detractors]
marketing materials are being used the most
A company’s Net Promoter Score has been shown to have positive
And many other areas… correlations with faster growth and profits. Marketo’s own research
This is not to imply that these metrics are not provides support for measuring customer satisfaction: high-growth
important for marketers to track – just that companies are more likely than low-growth companies to incorporate
they are likely to be less relevant to financially- customer satisfaction into their marketing executives’ compensation.
focused executives outside of marketing.
© 2011 Marketo, Inc. All rights reserved. 18](https://image.slidesharecdn.com/definitive-guide-to-marketing-metrics-marketing-analytics-111204170949-phpapp02/75/Definitive-guide-to-marketing-metrics-marketing-analytics-18-2048.jpg)


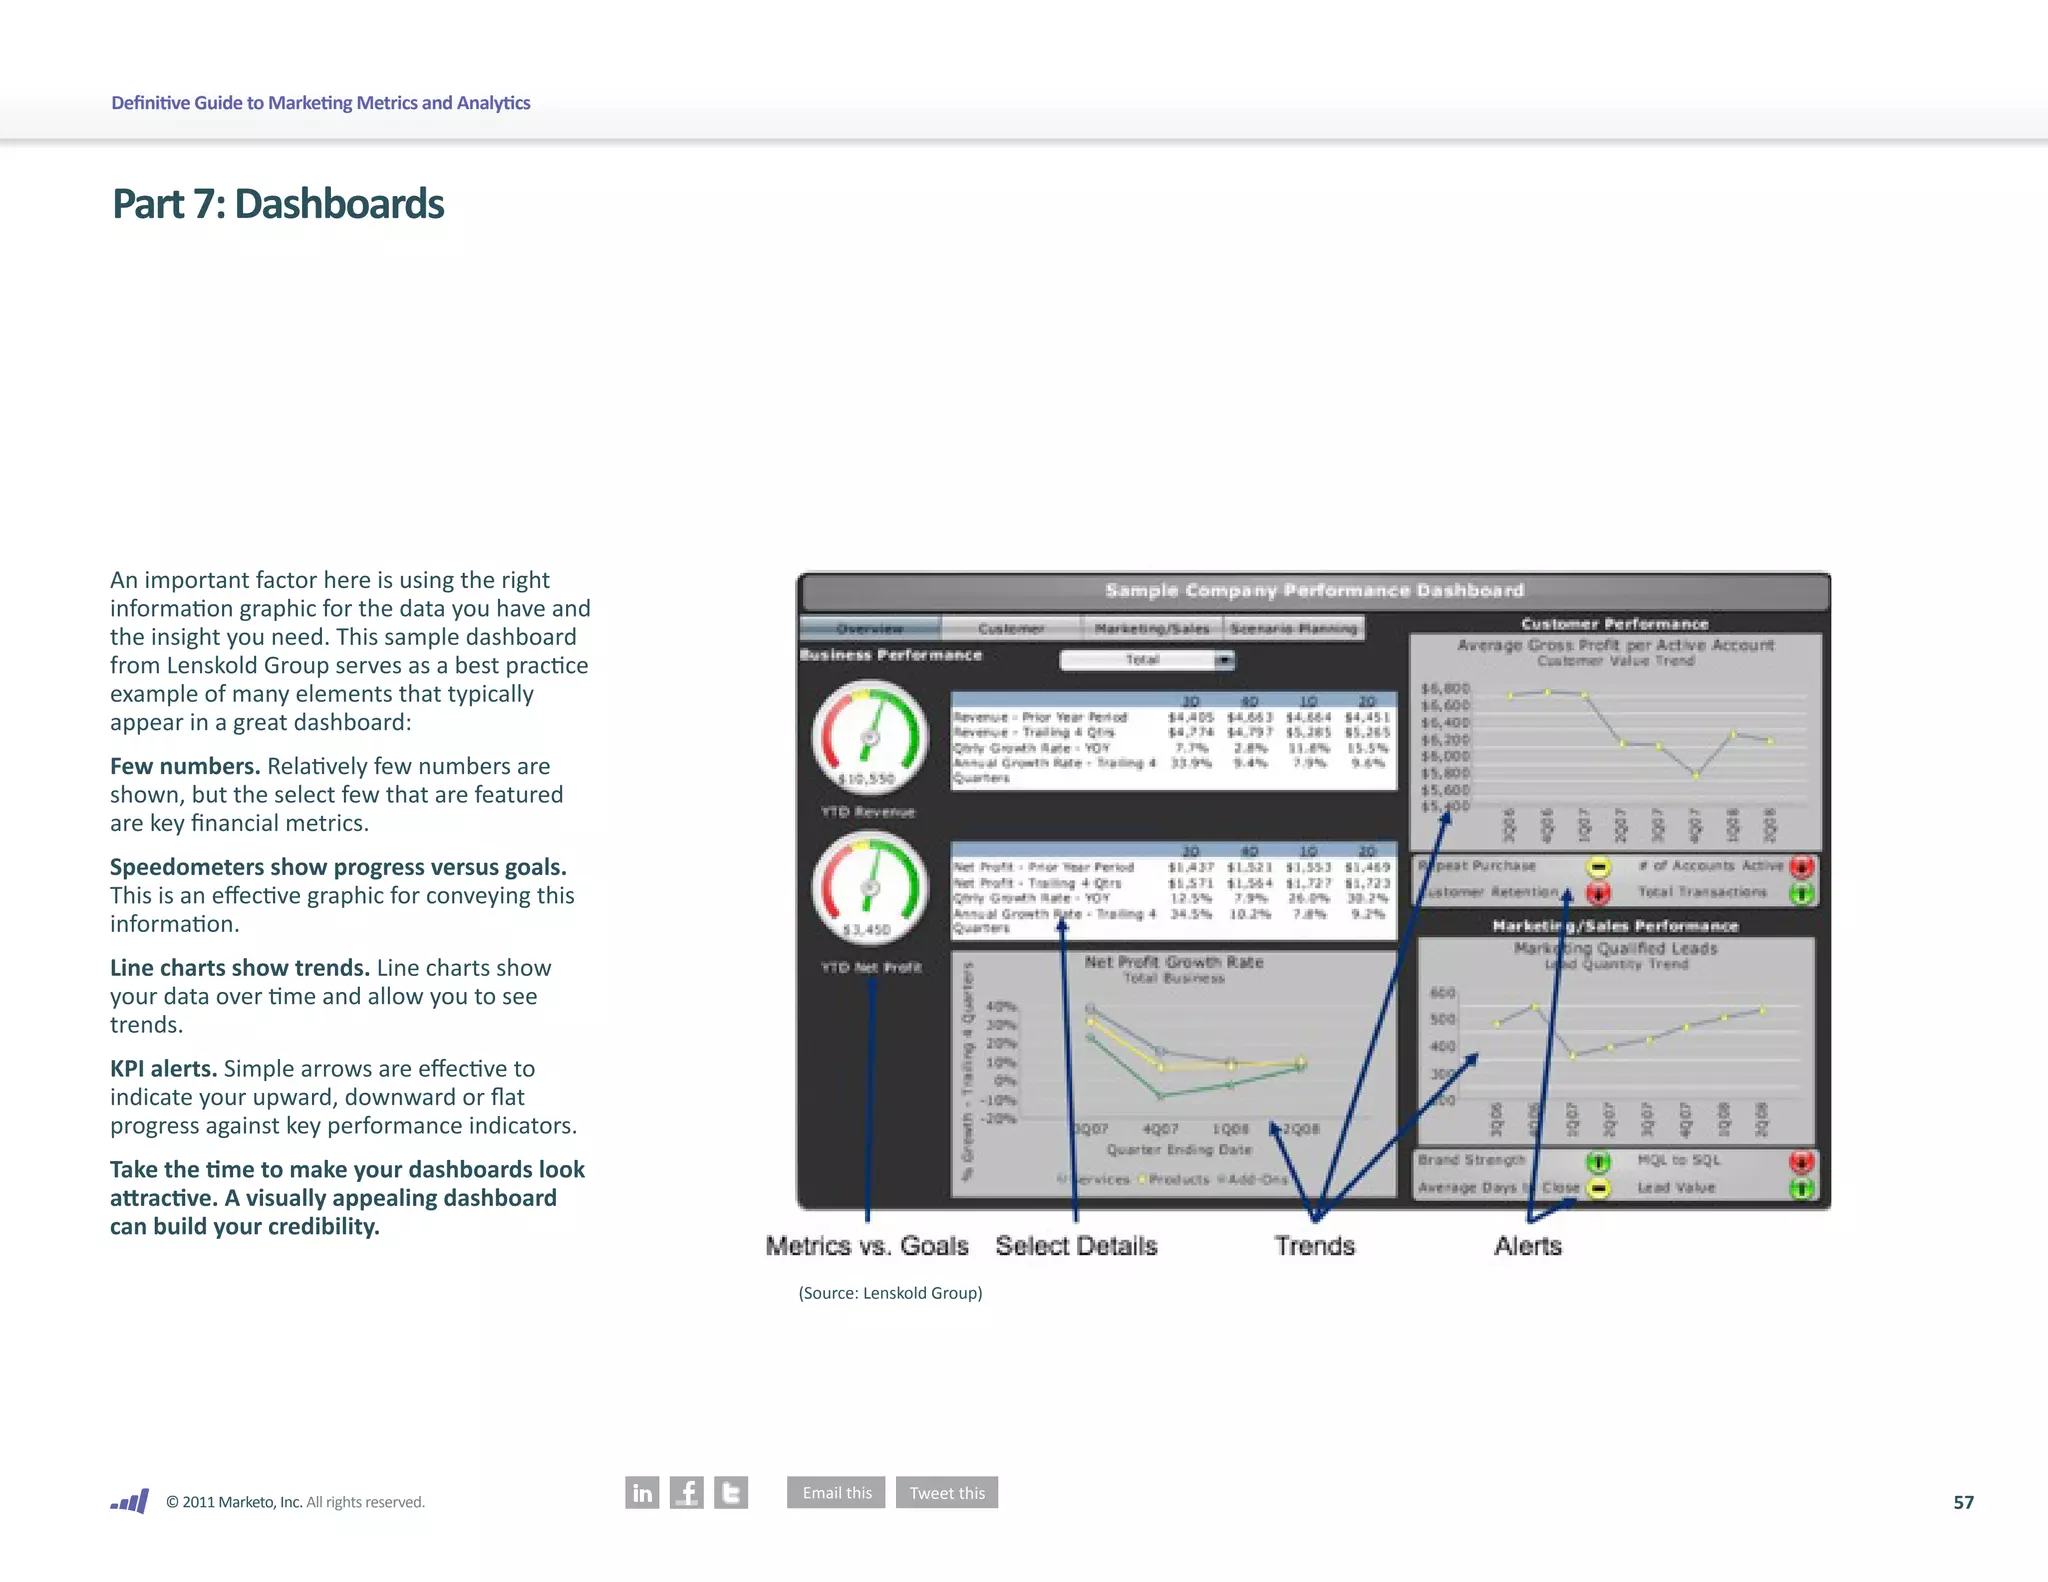
![Definitive Guide to Marketing Metrics and Analytics
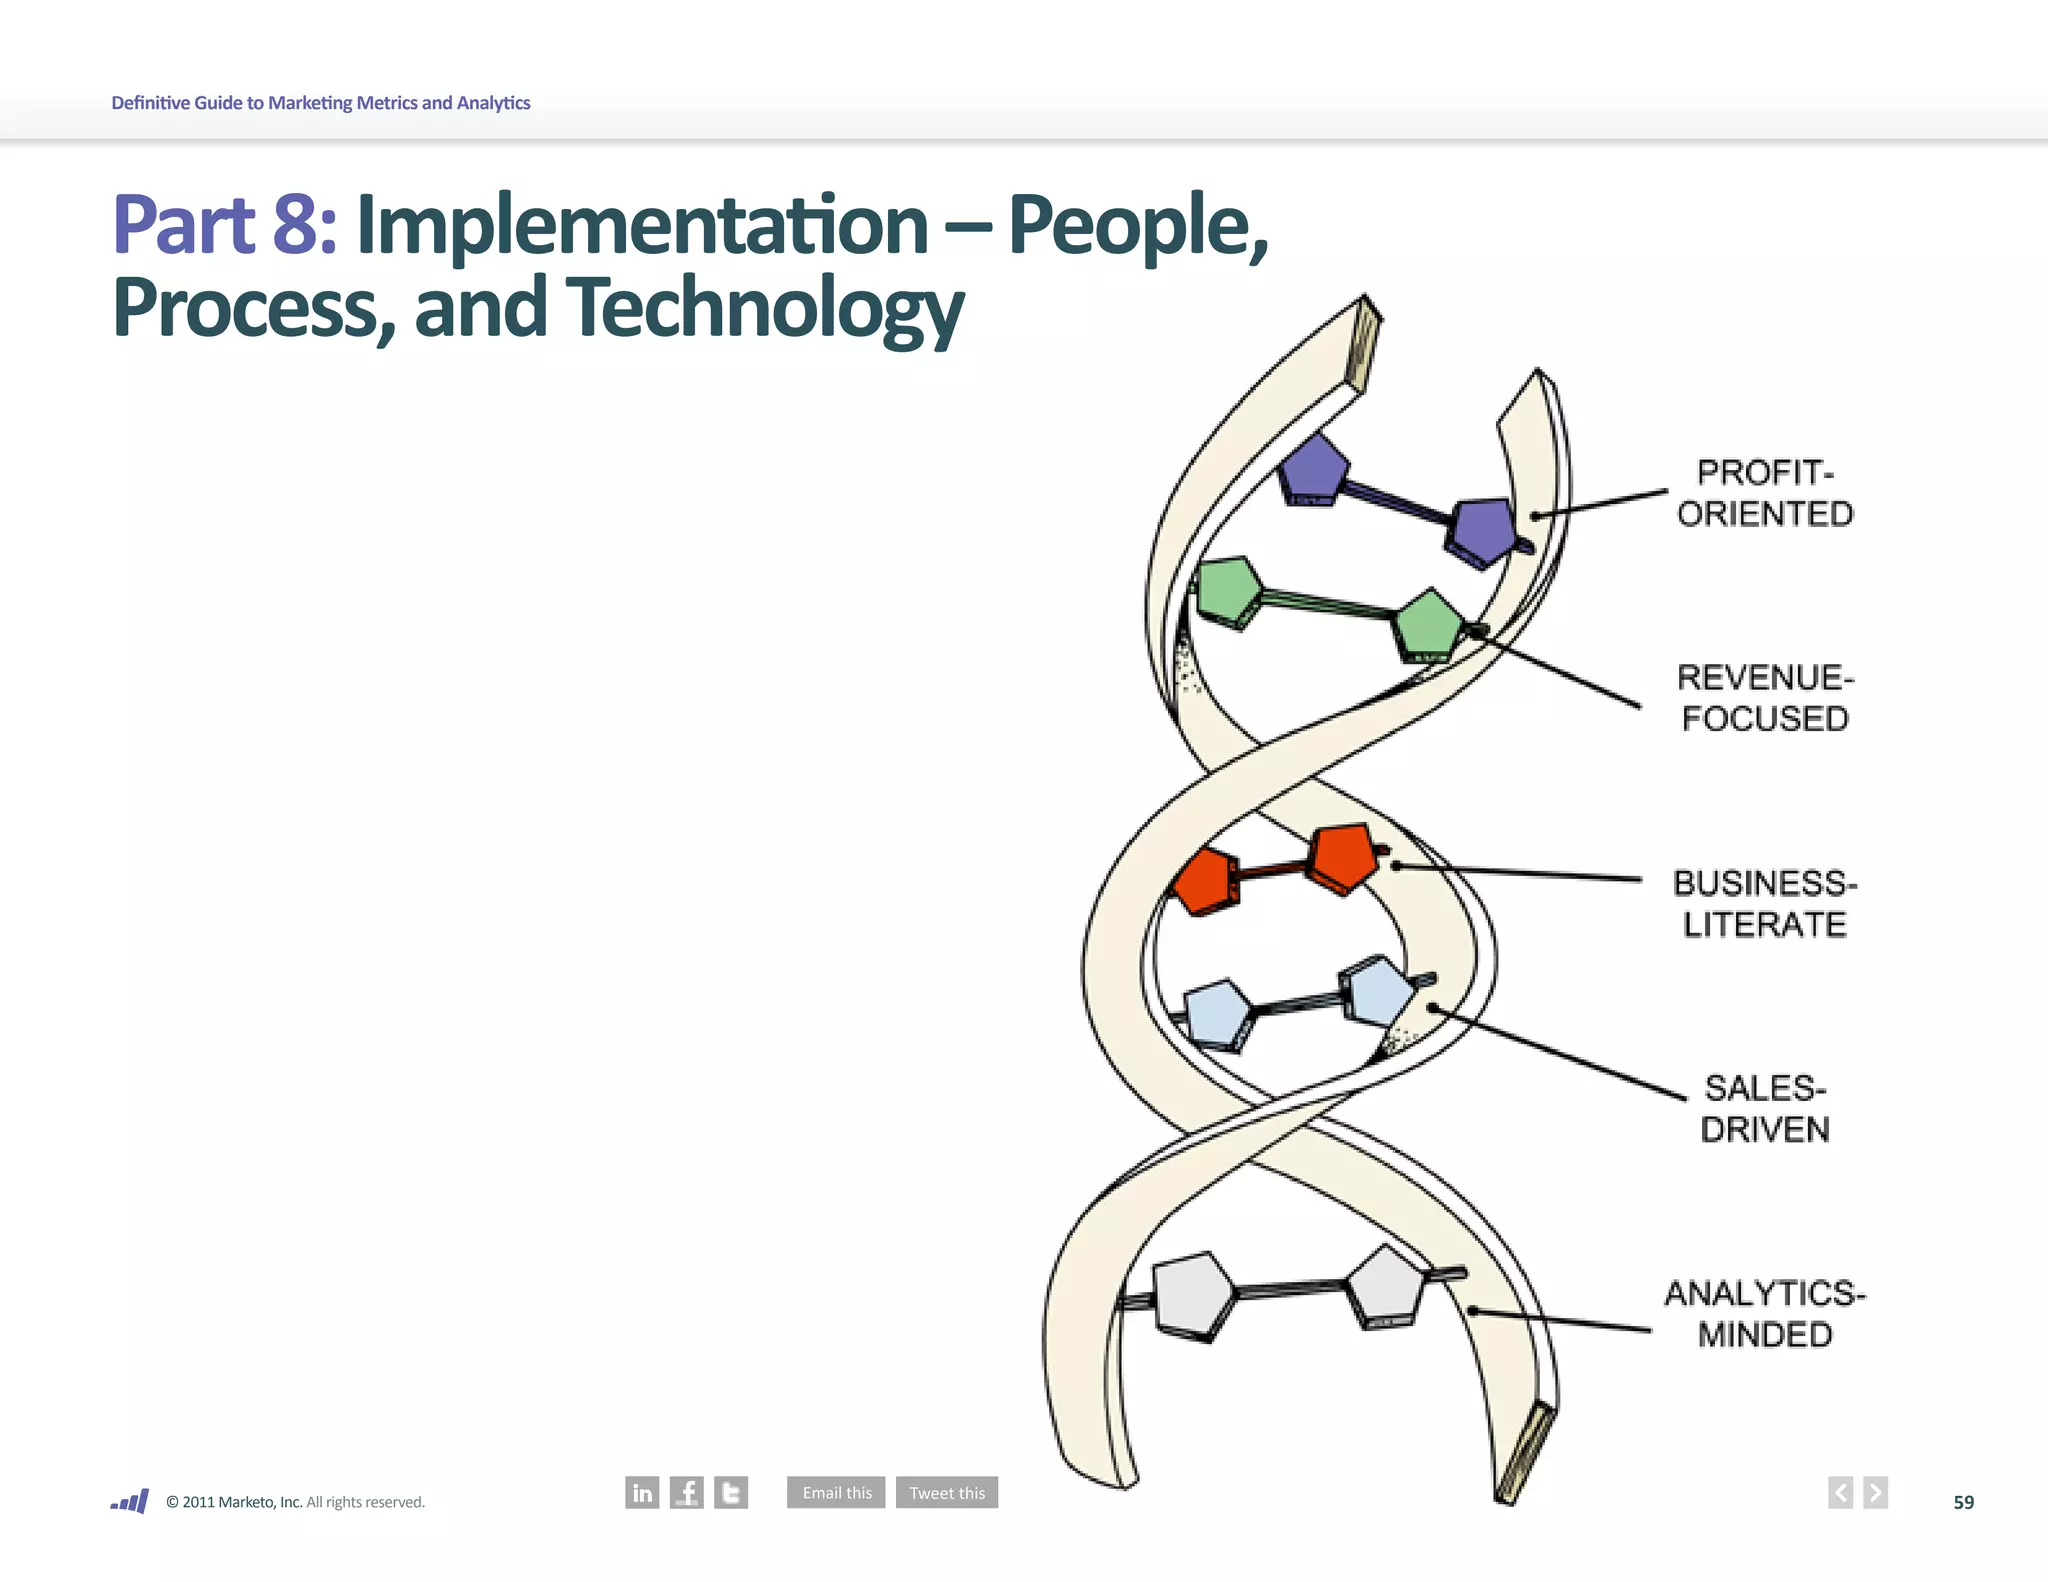
Part 8: Implementation – People,
Process, and Technology
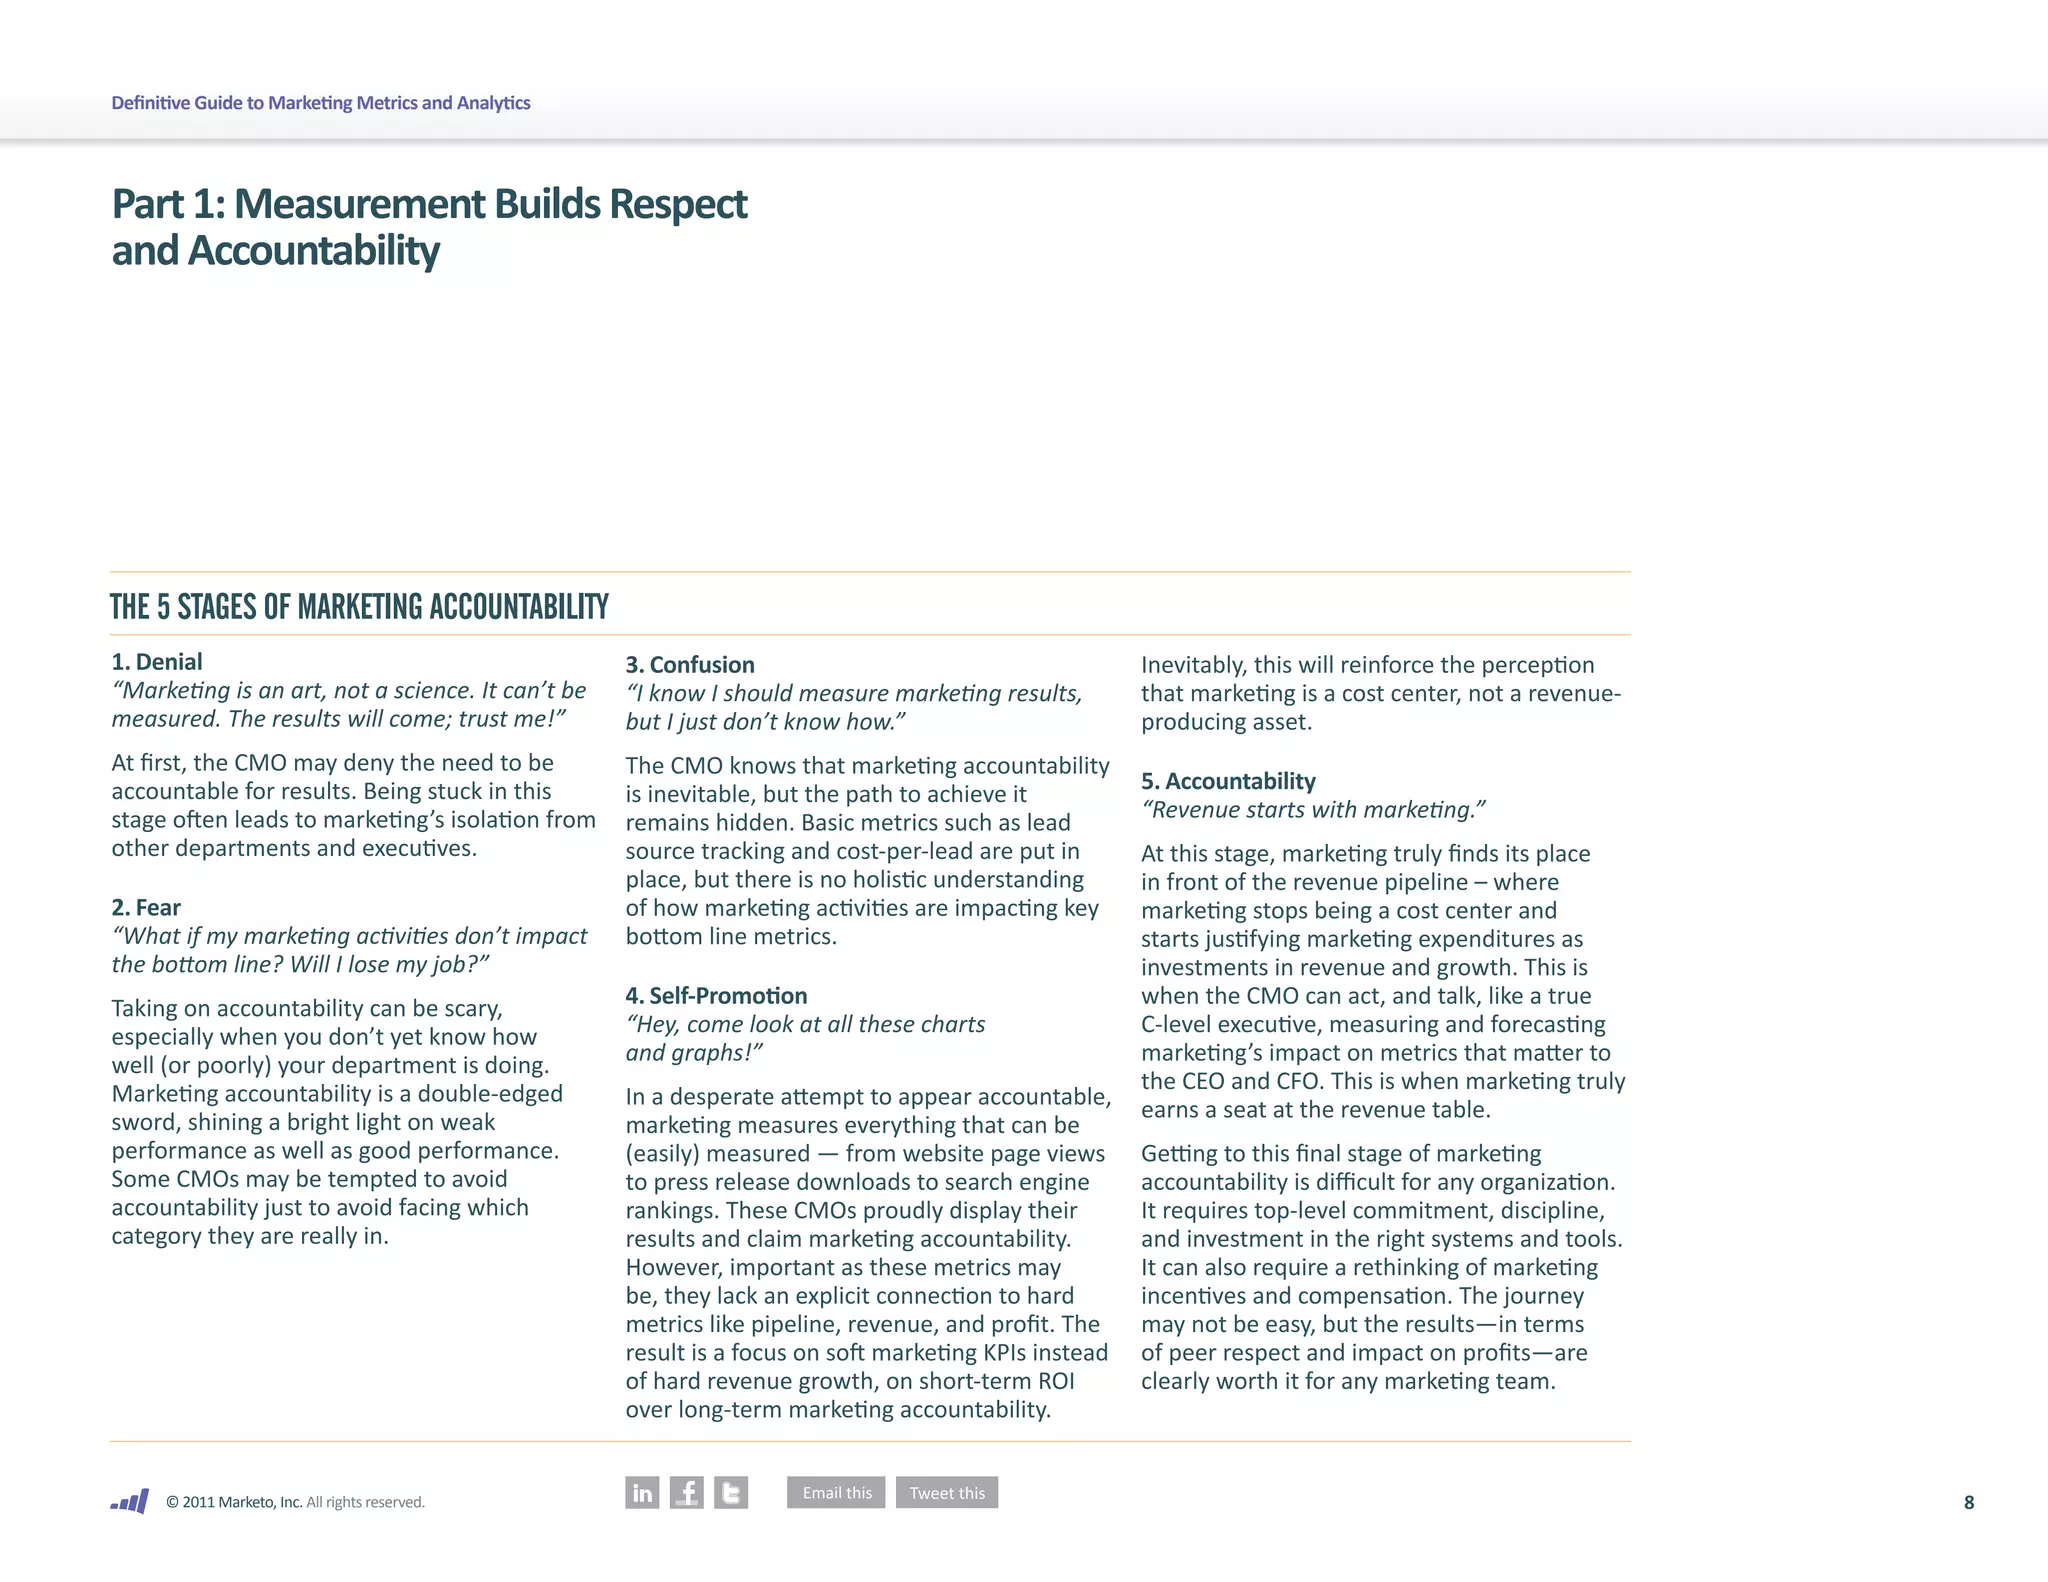
Whatever principles and methods
you decide to use, marketing managers MARKETING MEASUREMENT IN REVIEW: A CHECKLIST
should be able to answer any of the
questions below instantly: 1. Define your data collection 3. Assign granular KPIs to 6. Produce visual reports of 9. Analyze and optimize. It’s
and storage approaches. How your unique campaigns. your marketing success. time to act on the business
• What would be the expected ROI if we will you collect your data Determine the impact of Be discerning in how much intelligence you gather with
increased your budget by 10%? What would across multiple channels, individual campaigns and data you incorporate into the system you’ve set in
be the impact on sales closed? including your customer channels, as well as their these scorecards. Too much place. Which channels are
database, ad networks, influence on other channels information will overwhelm performing best? Which
• What would be the impact on sales
search engines, in-house and campaigns, and your your ability to quantify the campaign mix and variations?
if we decreased the marketing budget
spreadsheets, etc.? You can marketing measurement business revenue impacts of Integrate historical data
by 10%?
build your data warehouse success as a whole. It’s your individual and collective trends with your “what
Sound familiar? It all comes back internally or rely on outside helpful to integrate historical marketing investments. if” scenarios to adjust and
to where we started. agencies or analytics data into your metrics as well improve your marketing
7. Employ your data to calculate
providers. to uncover historical trends. investments moving forward.
true impact. Assign values to
2. Identify your Key 4. Formalize campaign data each channel, campaign and 10. ROI-inse and repeat.
Performance Indicators collection and tracking. This is attribute across all marketing As Visual IQ says, “an
(KPIs). When you involve where you establish business touch points to deliver true enterprise marketing
key stakeholders who rules around when and how metrics that represent how measurement system is […]
will use your data in their to measure what you want to effective each source is in not a one time, set-it-and-
daily business functions to measure – and identify who generating revenue. forget-it project.” Enable
measure how well they’re will oversee each phase of stakeholder buy-in with
8. Where individual user data is
achieving their goals, you the process. small victories at first, and
unavailable, use “top down”
ensure their sponsorship of build your initiatives as you
5. Integrate sales transaction attribution. Mathematical
the marketing measurement see what works and what
data from all sources. You’ll algorithms exist to calculate
process. doesn’t.
establish a virtuous cycle for the value of individual
your marketing ROI when marketing touches that you (Source: Visual IQ, 10 Steps to Enterprise
Marketing Measurement)
you close the loop of your can’t access on a user level,
measurements. such as offline channels like
TV, print and radio.
© 2011 Marketo, Inc. All rights reserved. 63](https://image.slidesharecdn.com/definitive-guide-to-marketing-metrics-marketing-analytics-111204170949-phpapp02/75/Definitive-guide-to-marketing-metrics-marketing-analytics-63-2048.jpg)


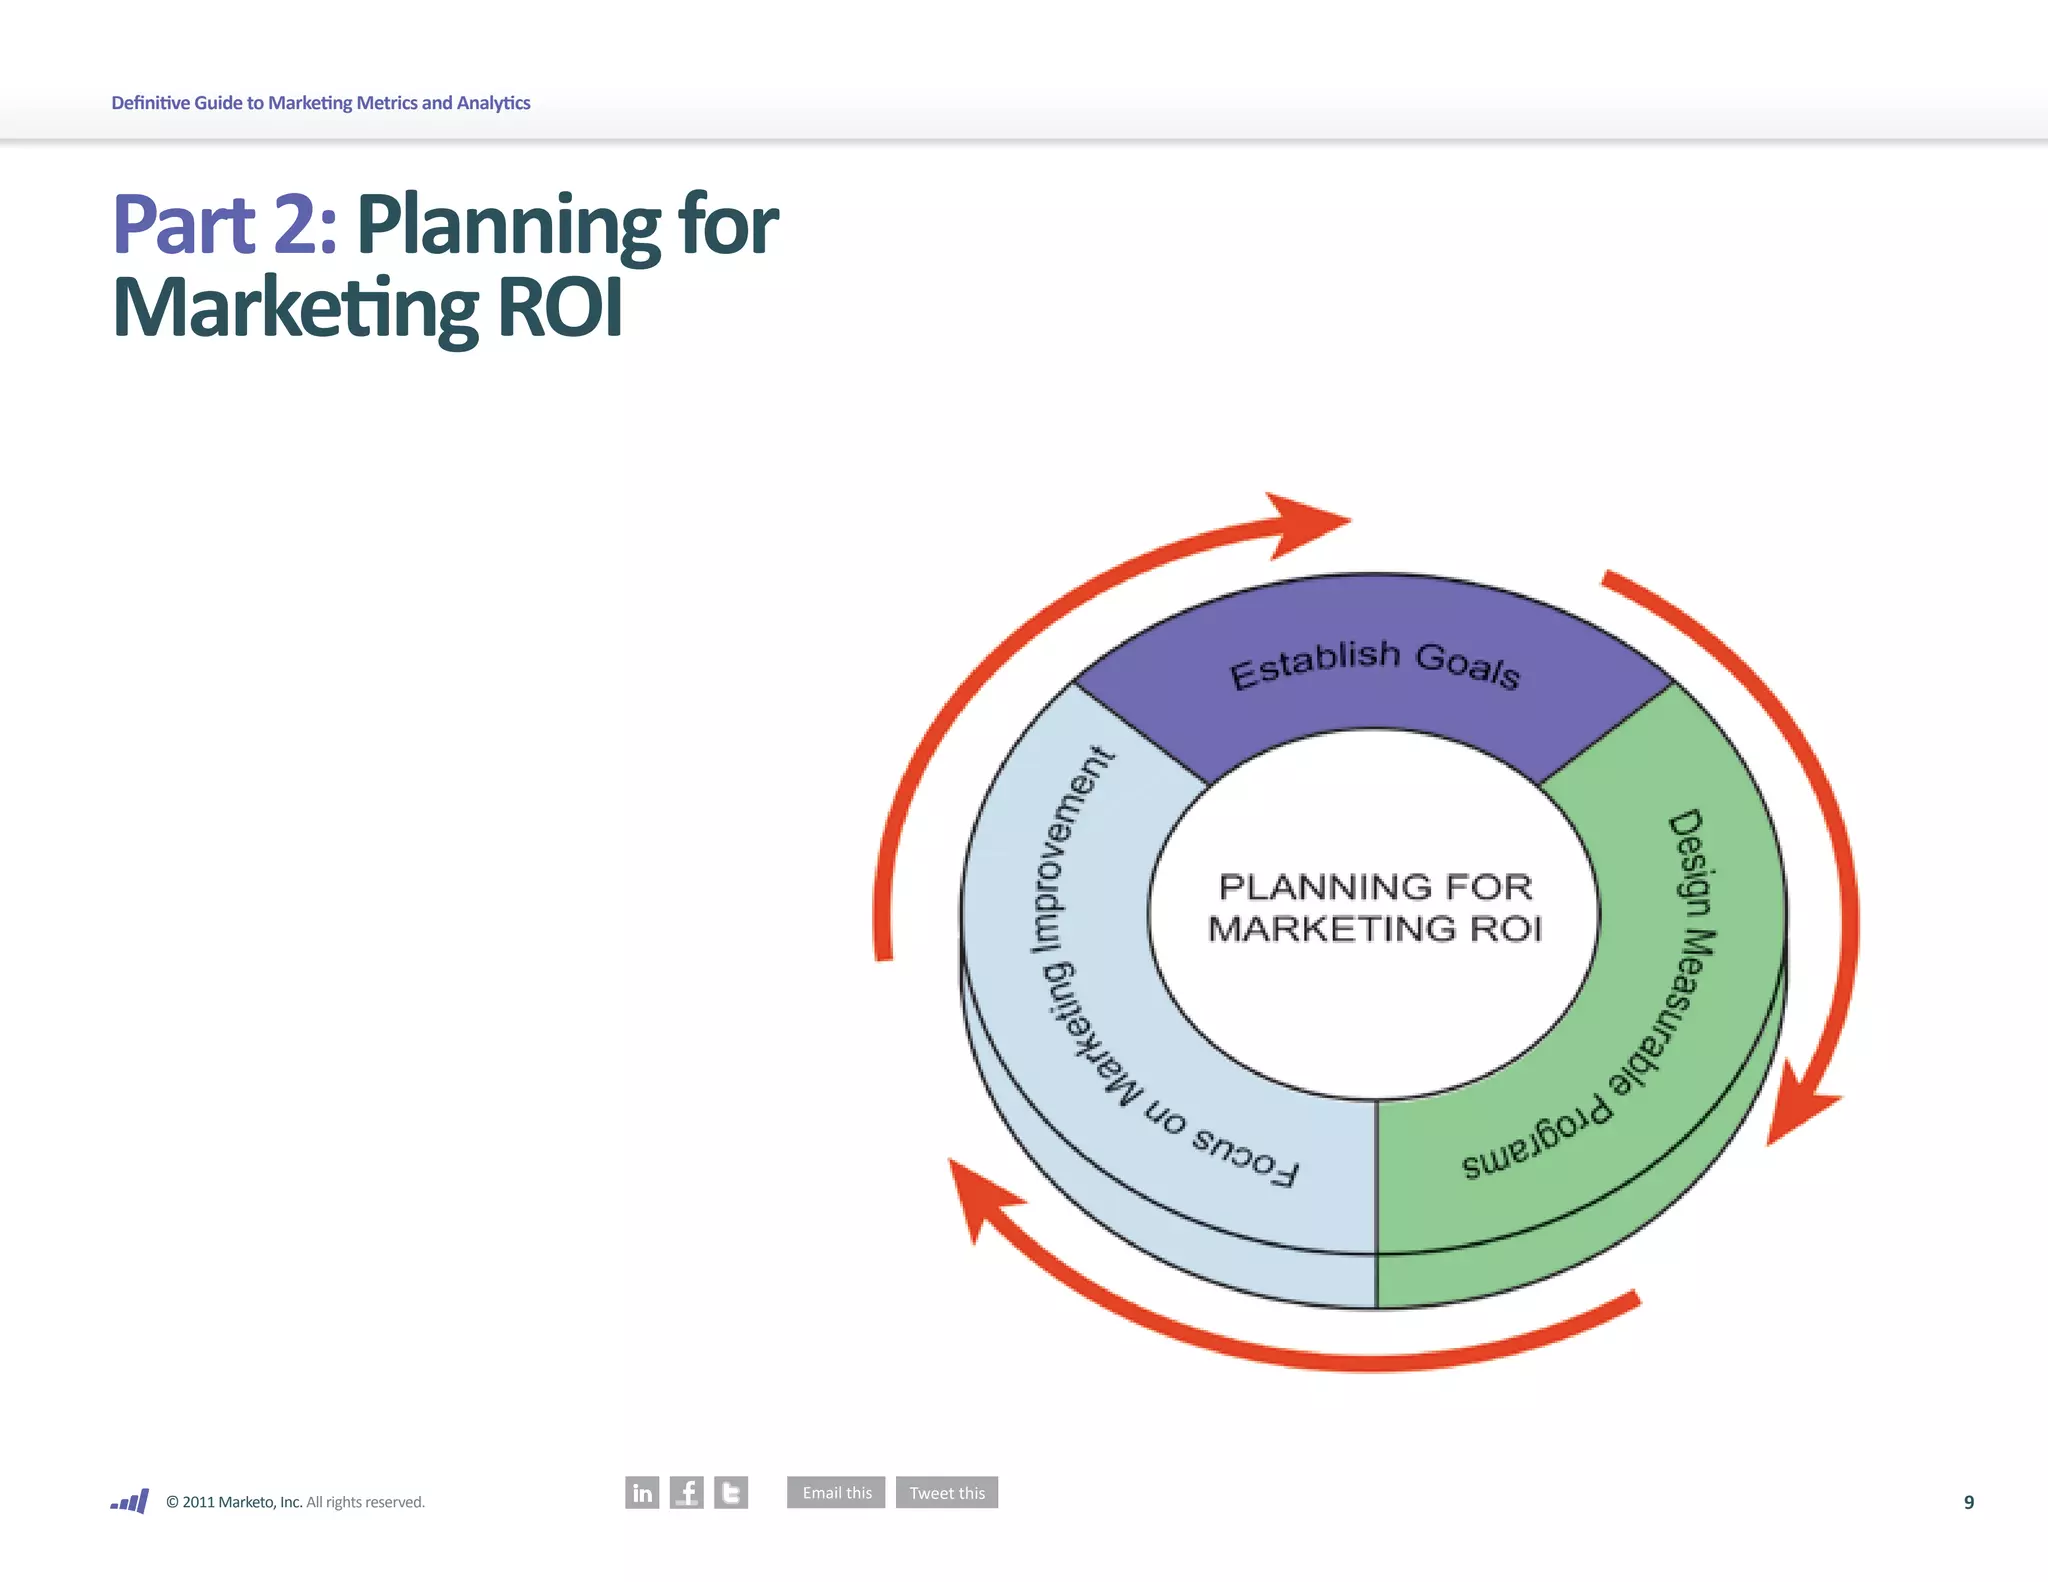
The document discusses the importance of marketing metrics and analytics for building accountability and respect within an organization. It argues that marketing should measure metrics that matter to executives like revenue, profits, and growth. The document also emphasizes that marketing should plan for ROI from the start of a program by establishing goals and estimating ROI, designing measurable programs, and focusing on decisions that can improve marketing performance.


