Download as PDF, PPTX
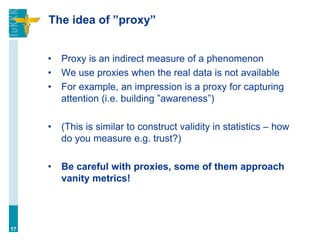
![Choosing the metrics a priori is crucial
• If you don’t rule metrics, they rule you! (remember
analysis paralysis)
• [JONI SHOWS: Facebook Ads reporting metric-o-
mania]
11](https://image.slidesharecdn.com/digitalanalyticslecture4-150723133726-lva1-app6891/85/Digital-analytics-lecture4-11-320.jpg)
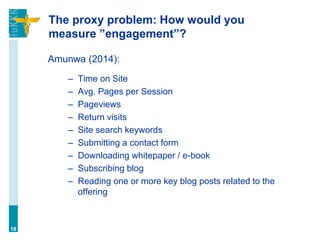
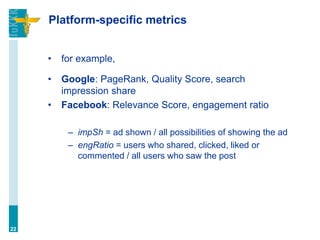
![Engagement metrics differ by platform
• FB: likes, comments, engagement ratio
• GA: pages/visit, bounce rate, time on site, etc.
• own app: [custom]
21](https://image.slidesharecdn.com/digitalanalyticslecture4-150723133726-lva1-app6891/85/Digital-analytics-lecture4-21-320.jpg)
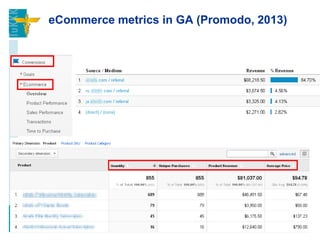


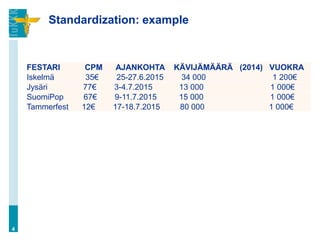
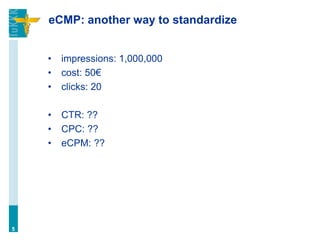
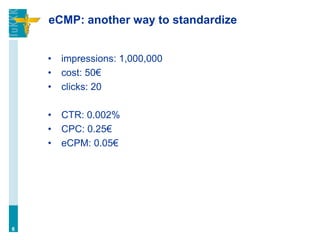
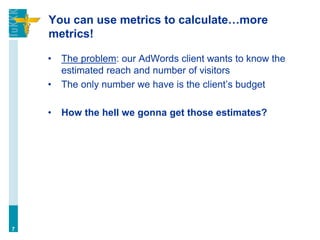
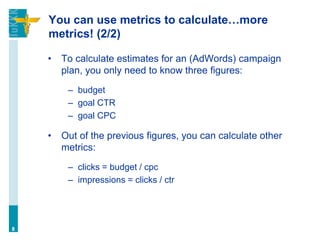
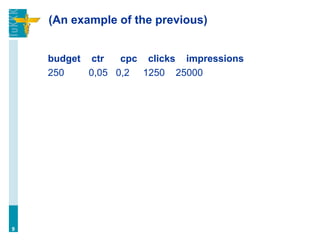
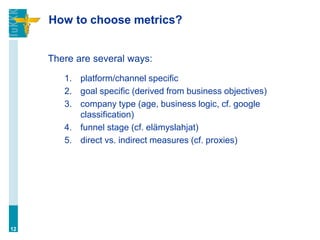
The document discusses various digital analytics metrics and their standardization for assessing online marketing performance. It provides insights into the selection and use of metrics, emphasizing the importance of actionable metrics over vanity metrics, and highlights examples specific to platforms like Google and Facebook. Additionally, it touches upon the distinction between startup metrics and corporate metrics, recommending tailored approaches for different business models.