Download as PDF, PPTX

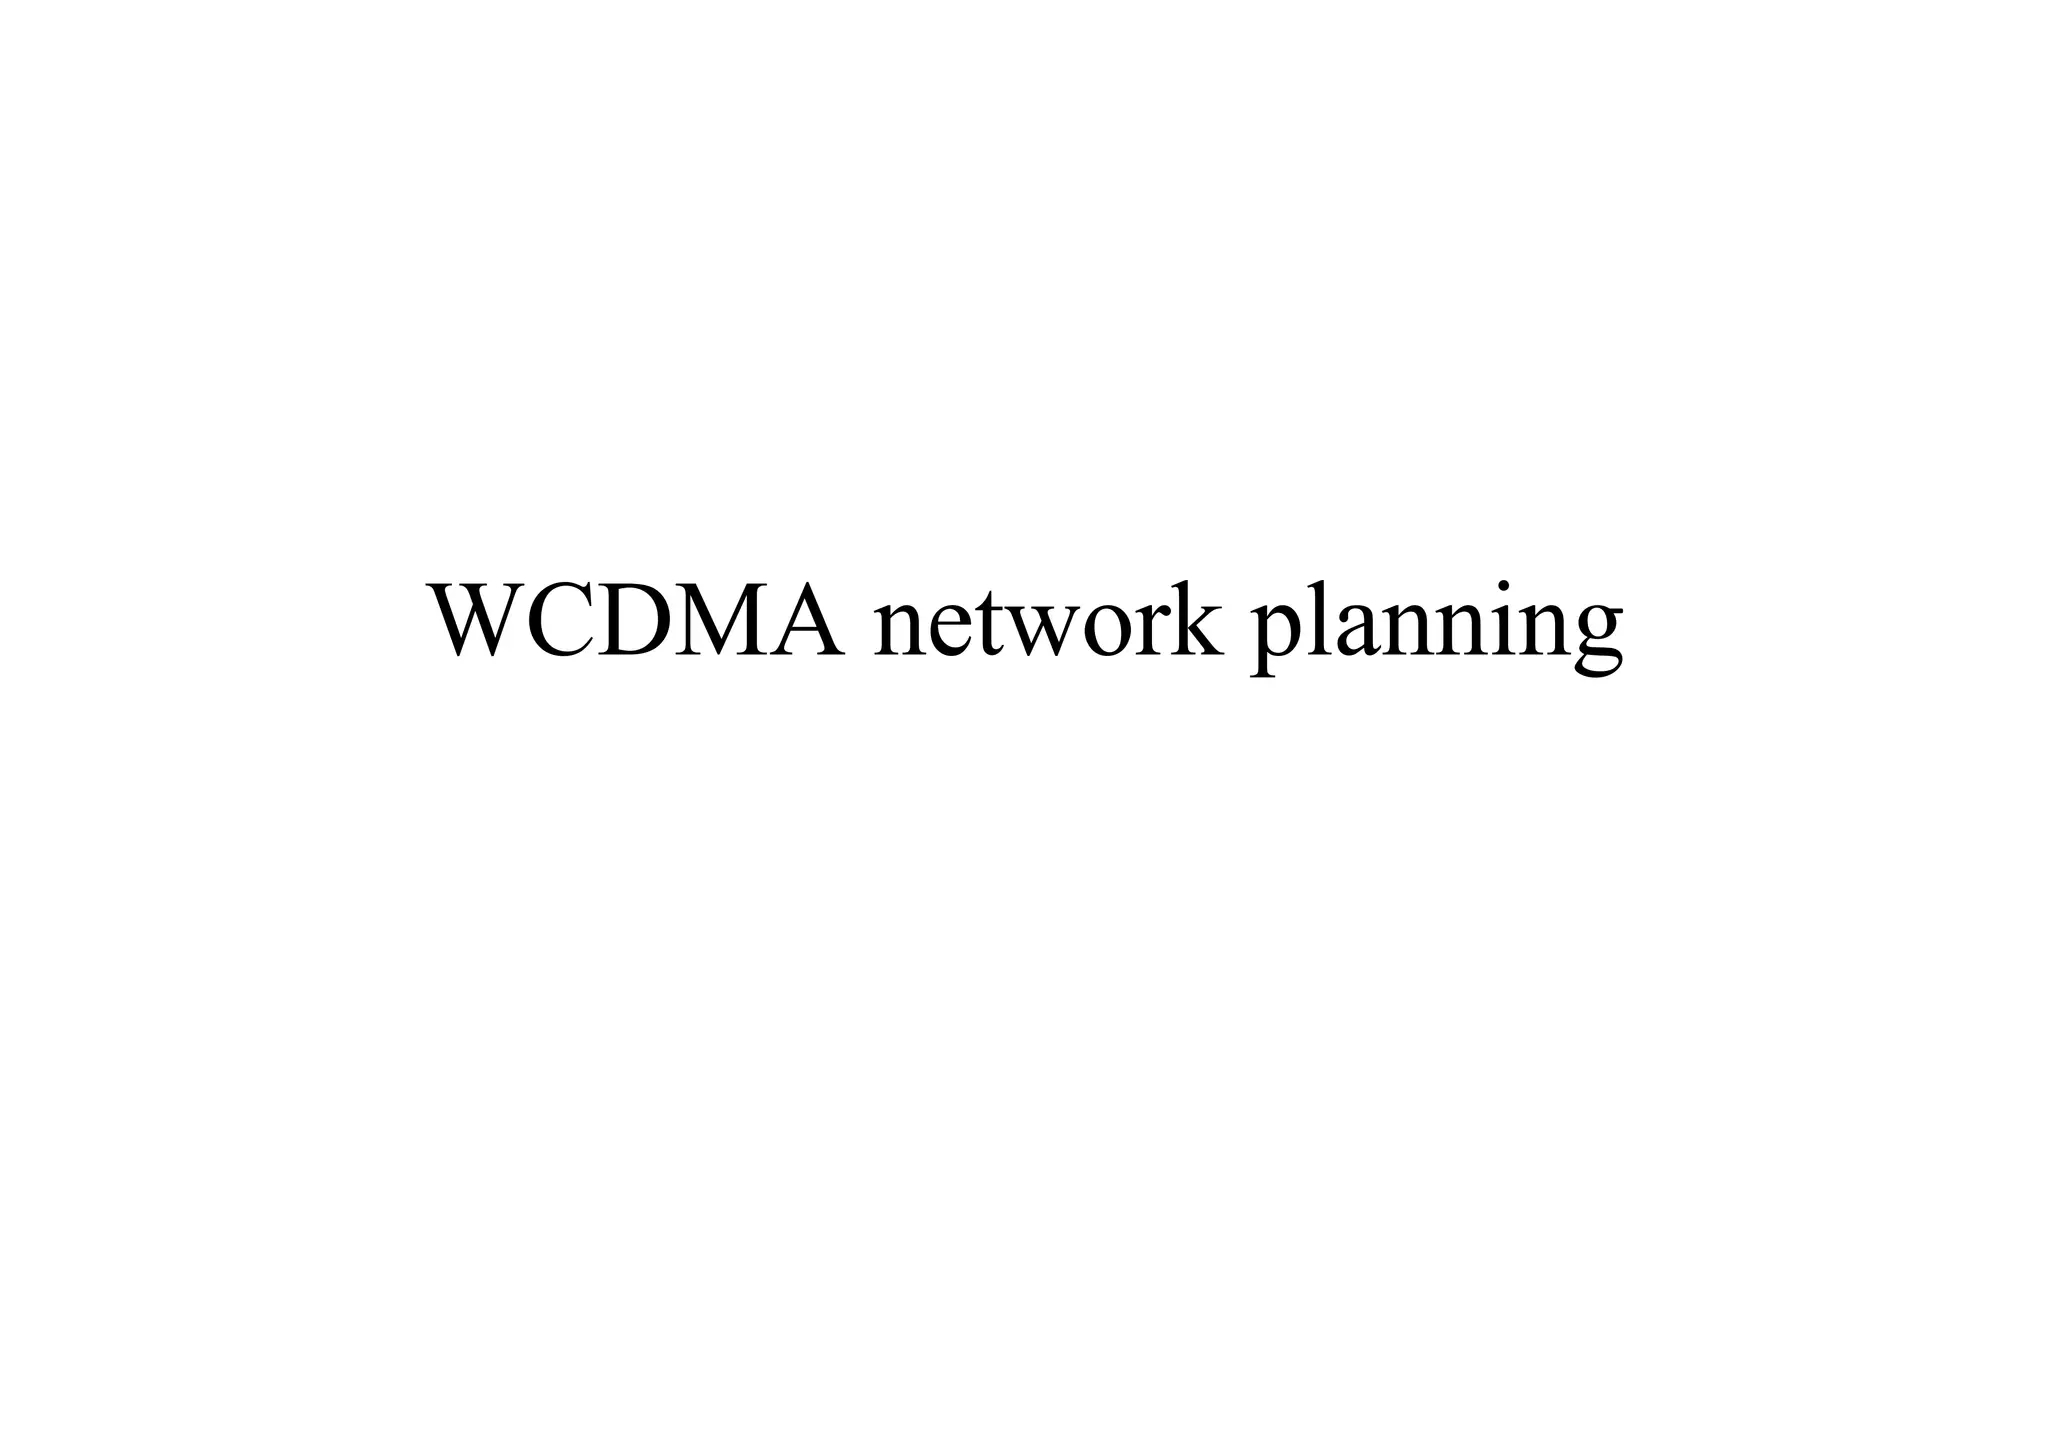
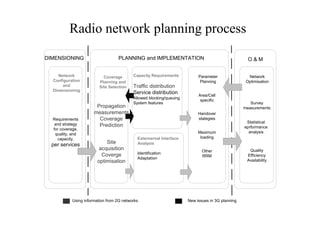
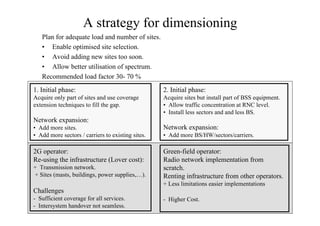
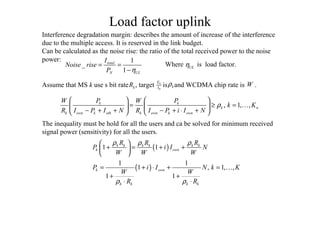
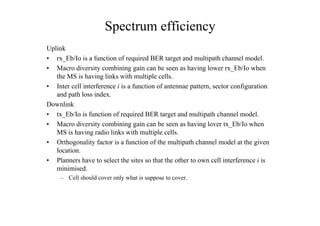
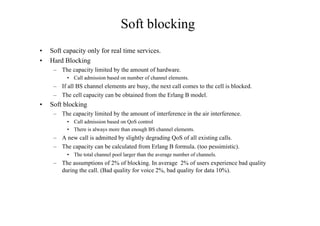
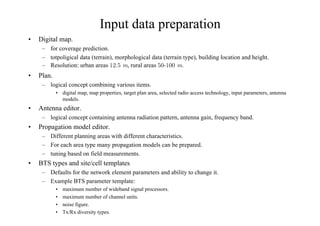
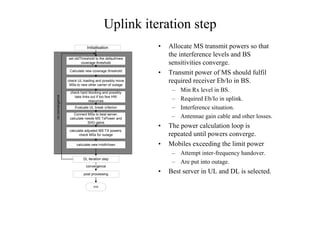
![Impact of uncertainties to the capacity in
the cell
• Location of users in the cell
– depending where users are located in
the cell they get different interference
from other cells and capacity varies
0 100 200 300 400 500 600 700 800 900 1000
−80
−60
−40
−20
0
20
40
P
s,i
[dBm]
Number of users per cell = 50
min distance
uniform distribution
max distance
0 100 200 300 400 500 600 700 800 900 1000
6
6.5
7
7.5
8
x 10
−3
Distance from BS [m]
CIR
• Speed of users
– target CIR function of speed
– conditions in the cell vary with users movements
• Data rates
– n times voice datarate corresponds to n users transmitting from that location. (“high
nonuniformity”)
0 .3
1 .2
Soft Capacity
• surrounding cells lightly loaded
• less interference to the heavily loaded cell
• capacity to heavily loaded cell can be
increased](https://image.slidesharecdn.com/wcdmaplanning-150218000442-conversion-gate01/85/Wcdma-planning-7-320.jpg)
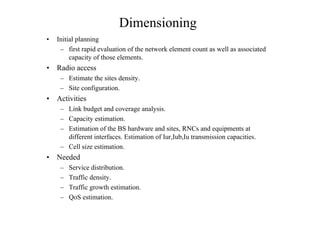
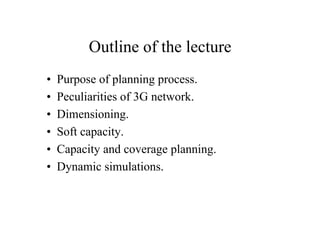
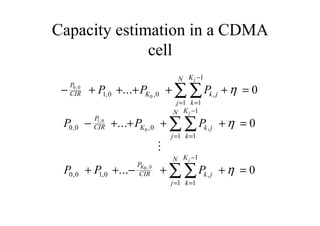
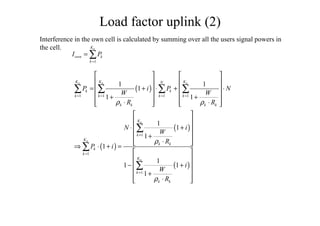
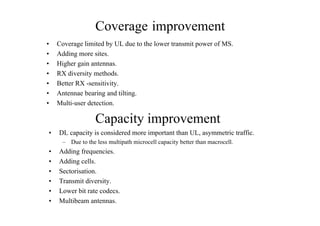
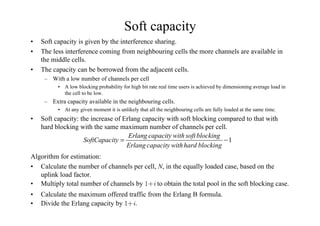
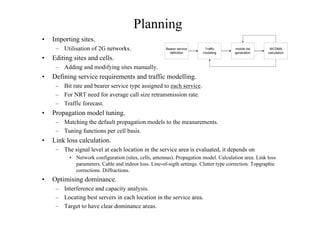
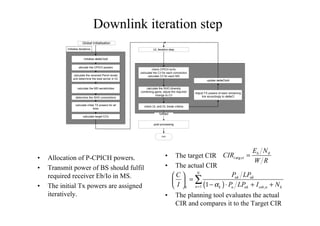
![12.2 kbps voice service (120 km/h, in car)
Transmitter (mobile)
Max. mobile transmission power [W] 0.125
As above in [dBm] 21 a
Mobile antenna gain [dBi] 0 b
Cable/Body loss [dB] 3 c
Equivalent Isotropic Radiated Power 18 d=a+b-c
Receiver BS
Thermal noise density [dBm/Hz] -174 e
Base station recever noise figure [dB 5 f
Receiver noise density [dBm/Hz] -169 g=e+f
Receiver noise power [dBm] -103.2 h=g+10*log10(3840000)
Interference margin [dB] 3 i
Receiver interference power [dBm] -103.2 j=10*log10(10^((h+1)/10)-10^(h/10
Total effective noise + interference [d -100.2 k=10*log10(10^(h/10)+10^(j/10))
Processing gain [dB] 25 l=10*log10(3840/12.2)
Required Eb/No [dB] 5 m
Receiver sensitivity [dBm] -120.2 n=m-l+k
Base station antenna gain [dBi] 18 o
Cable loss in the base station [dB] 2 p
Fast fading margin [dB] 0 q
Max. path loss [dB] 154.2 r=d-n+o-p-q
Coverage probability [%] 95
Log normal fading constant [dB] 7
Propagation model exponent 3.52
Log normal fading margin [dB] 7.3 s
Soft handover gain [dB], multi-cell 3 t
In-car loss [dB] 8 u
Allowed propagation loss for cell ran 141.9 v=r-s+t-u
Example of a
WCDMA RLB](https://image.slidesharecdn.com/wcdmaplanning-150218000442-conversion-gate01/85/Wcdma-planning-14-320.jpg)
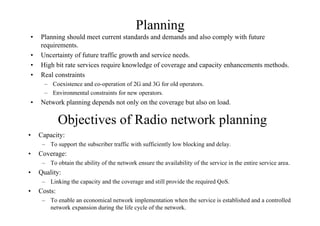
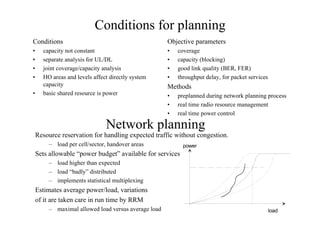
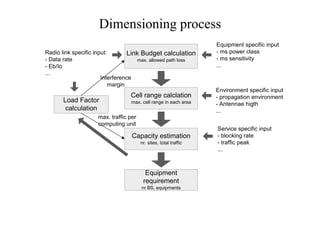
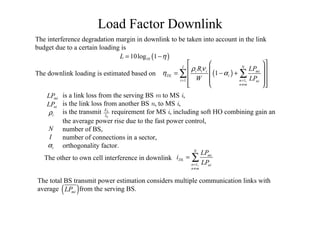
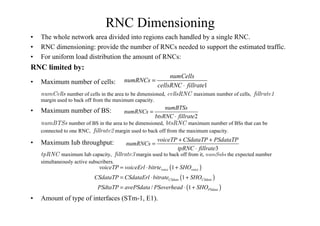
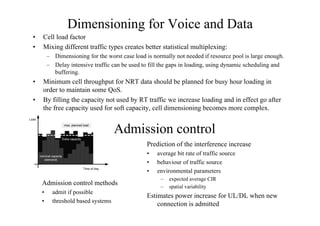
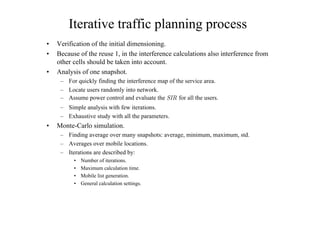
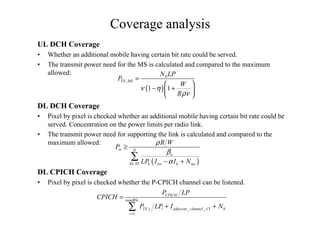
![Load factor uplink (3)
( )
1
1
1
1
nK
UL
k
k k
i
W
R
η
ρ
=
= +
+
⋅
∑Uplink loading is defined as:
By including also effect of sectorisation (sectorisation gain , number of sectors ),
and voice activity .
1
1
1
1
nK
s
UL k
k
k k
N
i
W
R
η ν
ξ
ρ
=
= +
+
⋅
∑
ξ sN
ν
Noise rise in uplink
0 100 200 300 400 500 600 700
0
2
4
6
8
10
12
14
16
18
20
load [ kbit/s]
Noiserise[dB]
i=0
i=0.65](https://image.slidesharecdn.com/wcdmaplanning-150218000442-conversion-gate01/85/Wcdma-planning-17-320.jpg)

1. The document discusses planning a WCDMA network, including dimensioning the network, estimating coverage and capacity, and accounting for uncertainties. 2. Dimensioning involves initially estimating the number of sites and equipment needed based on factors like traffic load and distribution. Coverage is estimated using link budget calculations and propagation models. Capacity is estimated based on load factor calculations that account for interference. 3. Planning must consider uncertainties from factors like user locations, speeds, and data rates that impact coverage and capacity in real networks. Both static and dynamic simulations are used to optimize the network plan.


![[Deck] What's New in Spark-Iceberg Integration via DSV2.pptx](https://cdn.slidesharecdn.com/ss_thumbnails/deckwhatsnewinspark-icebergintegrationviadsv2-260210005337-25955b12-thumbnail.jpg?width=640&height=640&fit=bounds)


