Downloaded 285 times

![10
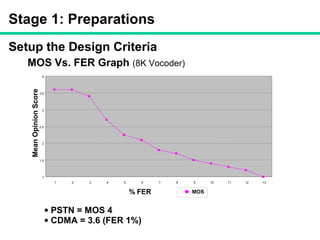
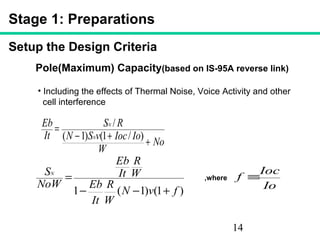
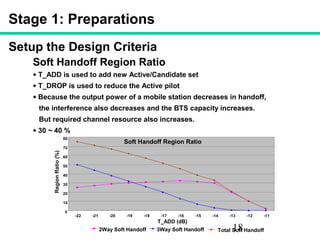
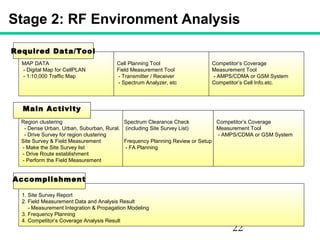
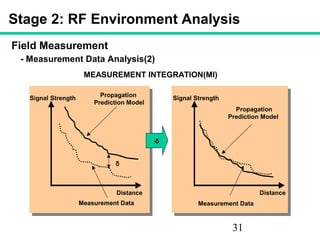
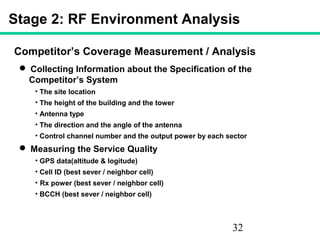
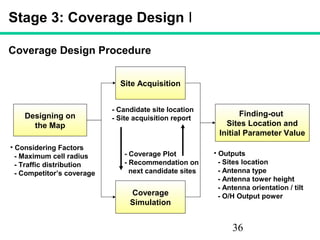
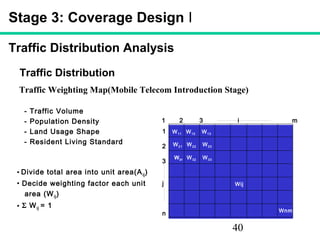
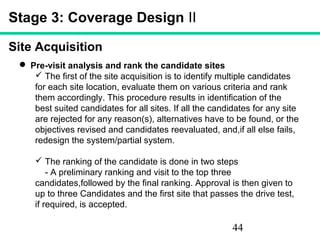
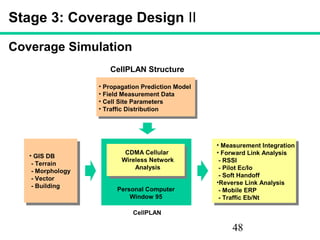
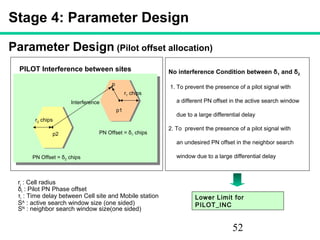
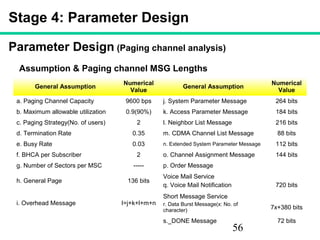
Setup the Design Criteria
Stage 1: Preparations
0.5
0.6
0.7
0.8
0.9
1
1.1
σ/n
FractionofTotalAreawithSignalabove
Threshold.Fu
0 1 2 3 4 5 6 7 8
PX0
(R) = 0.95
0.9
0.85
0.8
0.75
0.7
0.65
0.6
0.55
0.5
Area Reliability Fu
Contour Reliability
σ = Standard deviation[dB]
n = Path slope
Path Loss varies as 1/rn
,
PX0
(R) = Coverage Probability on area boundary (r = R)](https://image.slidesharecdn.com/rf-networkdesign-130712062944-phpapp02/85/Rf-network-design-10-320.jpg)
![13
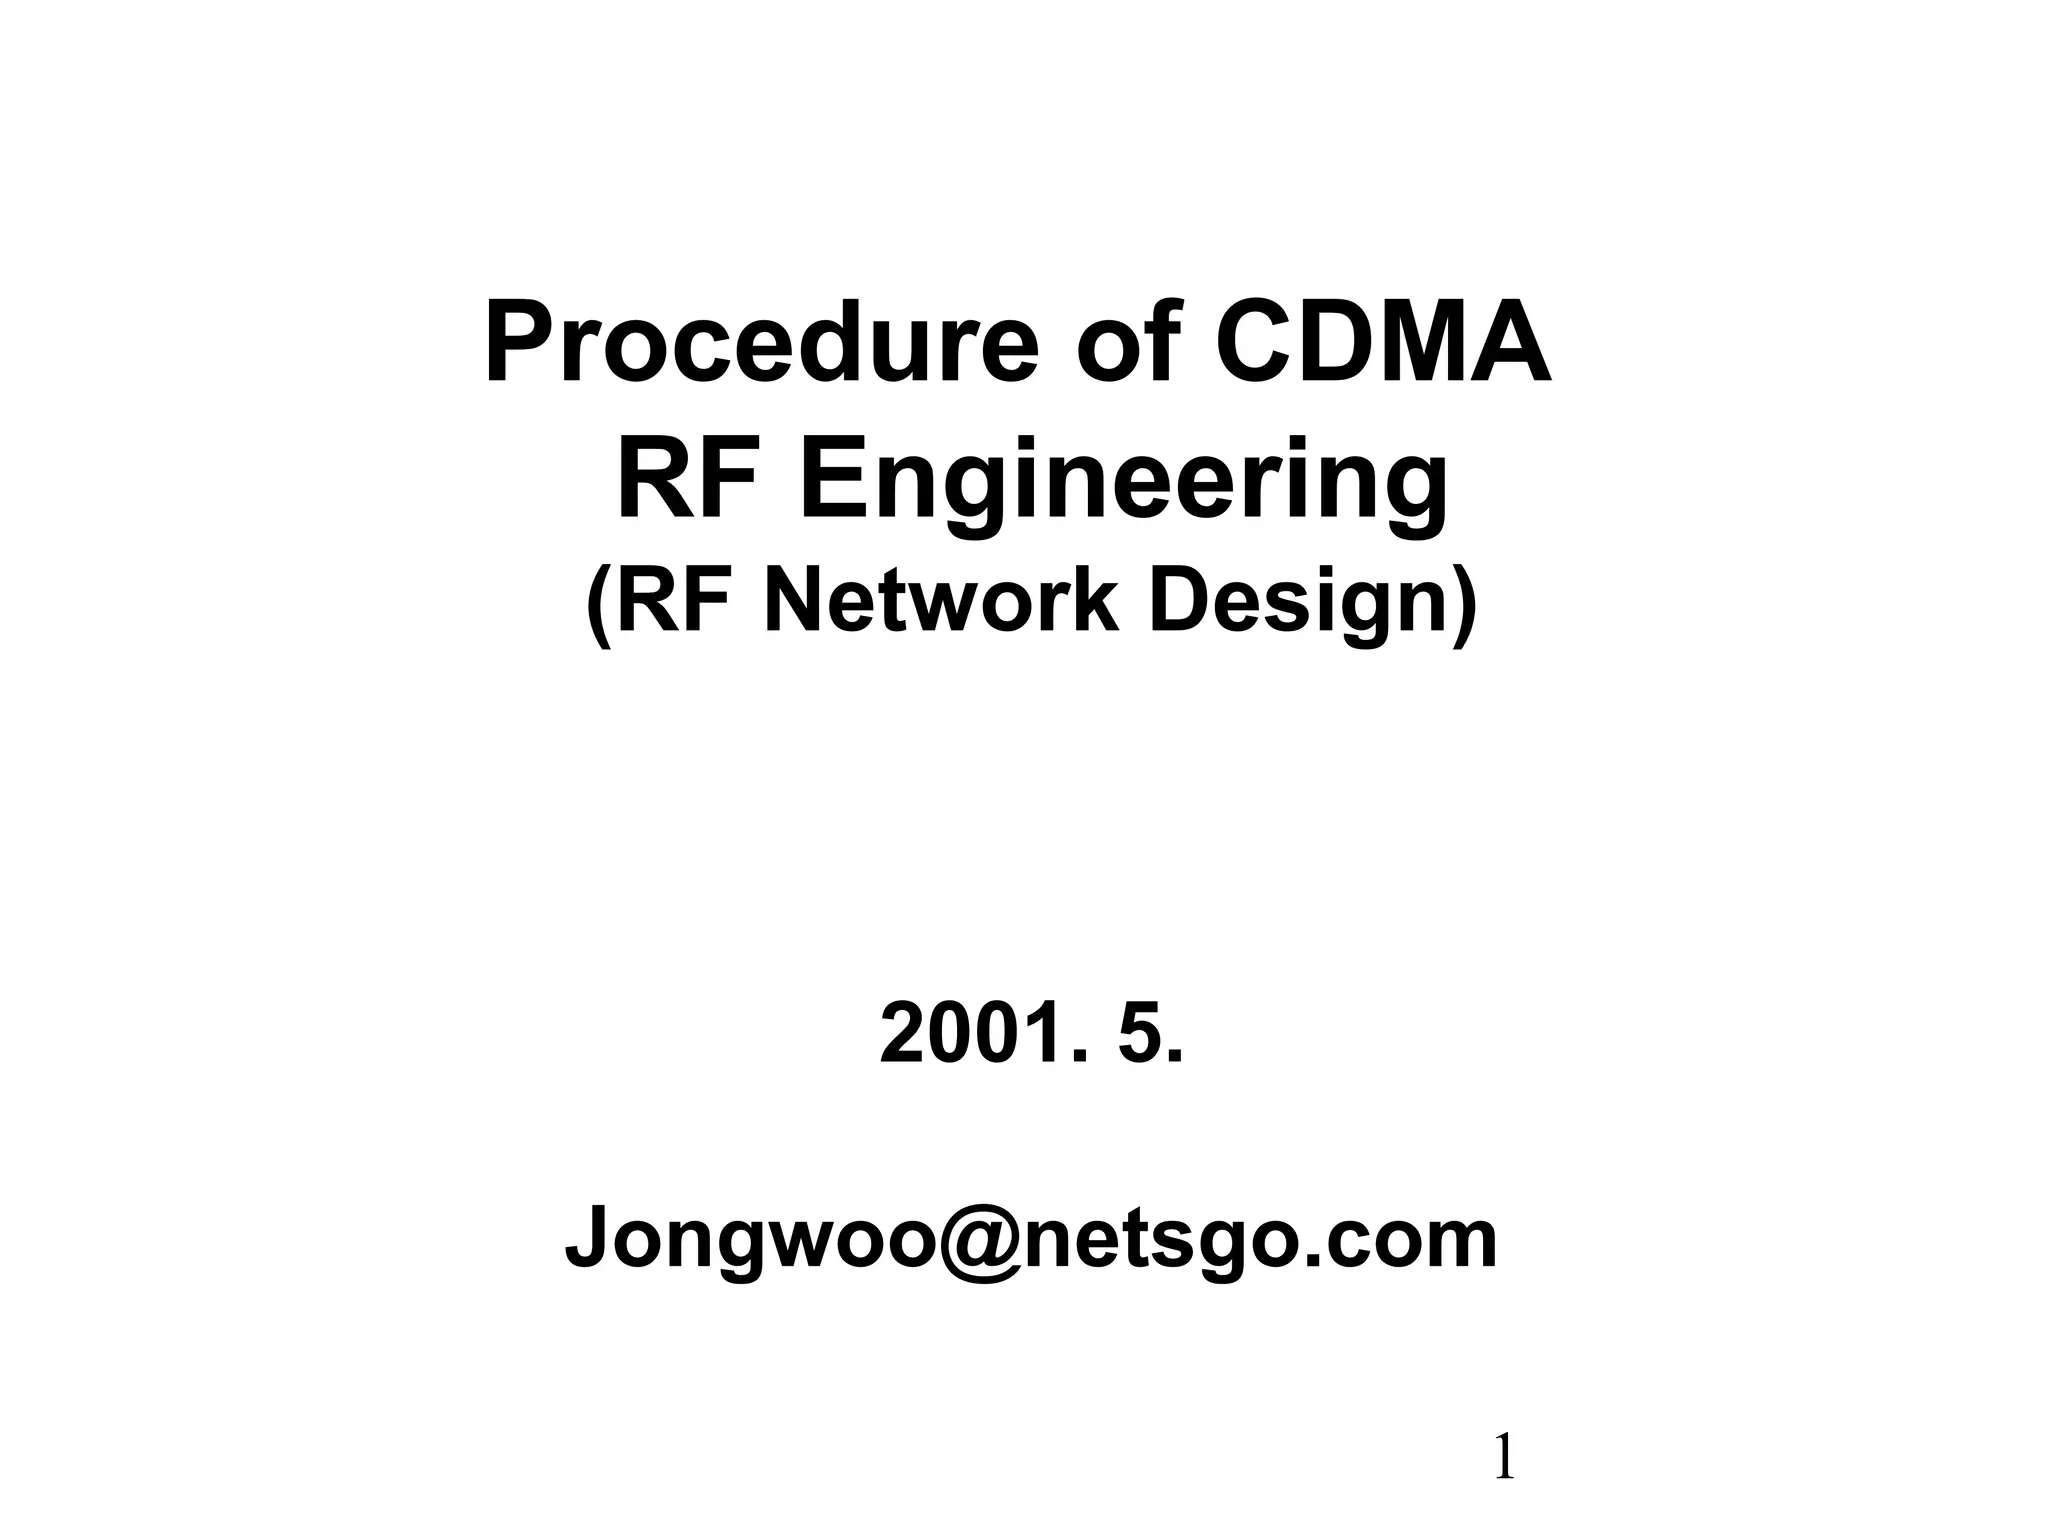
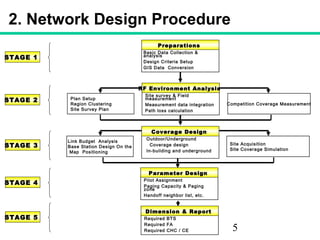
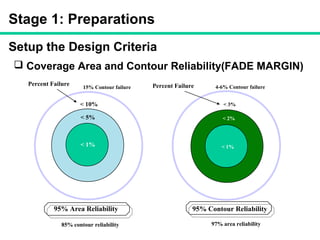
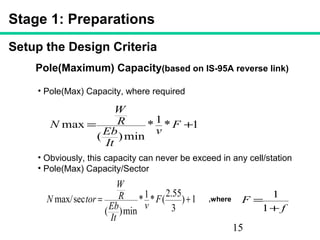
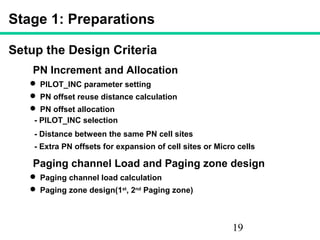
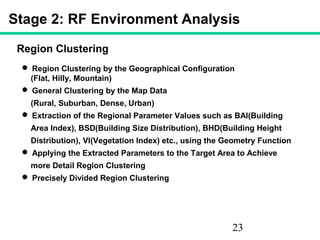
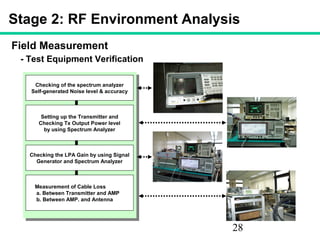
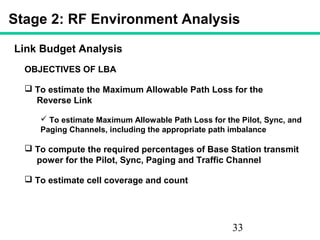
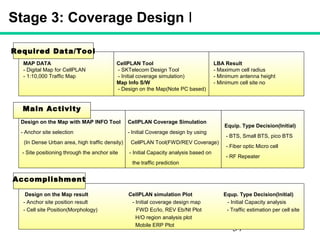
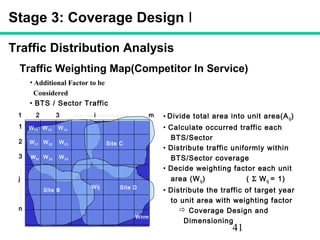
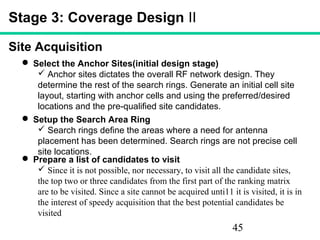
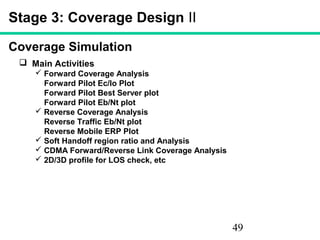
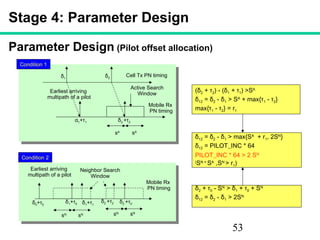
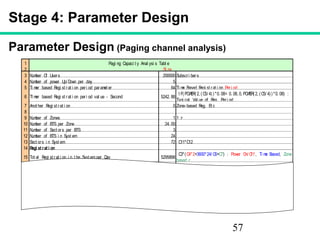
Setup the Design Criteria
FA Capacity(based on IS-95A reverse link)
• Limited by Interference From Other users
• Based on minimum required [Eb/It]minimum
• Relationship between [Eb/It]minimum and Number of user N
based on Perfect Power Control, No Thermal Noise, and
Isolated Single Cell
RSN
RS
It
Eb
/)1(
/
−
= 1
/
/ +=
ItEb
RWN
• S: Received signal at the base station(from power controlled mobiles)
• R: Data rate
• W: CDMA Bandwidth(1.2288 Mbps)
• Eb: Bit energy, It: Spectral Density of the total interference
• N: Number of active users
Stage 1: Preparations](https://image.slidesharecdn.com/rf-networkdesign-130712062944-phpapp02/85/Rf-network-design-13-320.jpg)
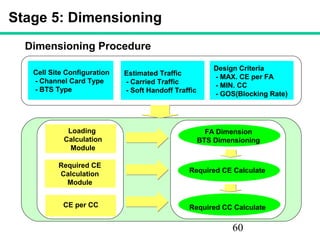
![24
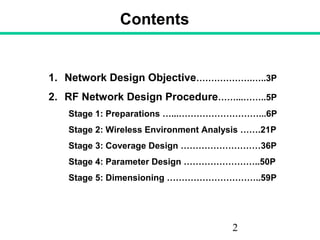
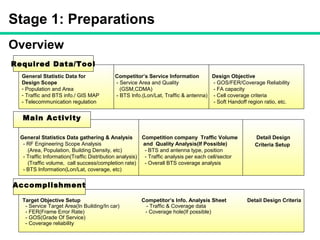
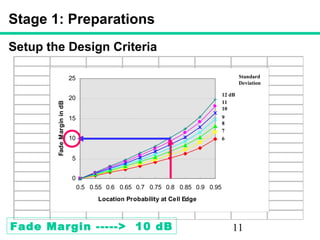
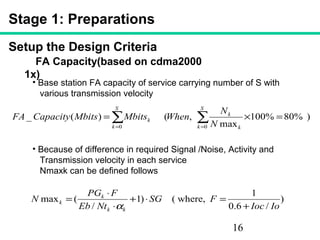
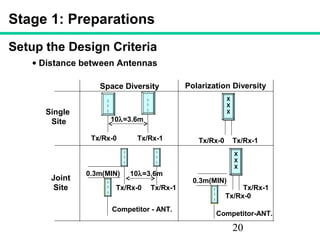
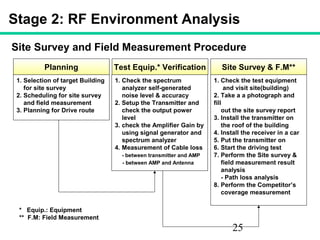
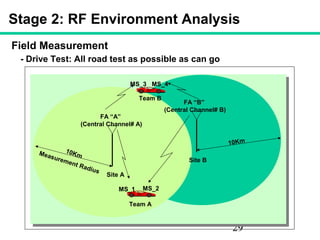
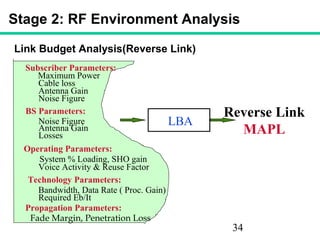
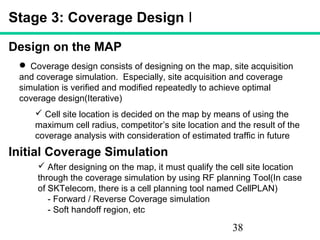
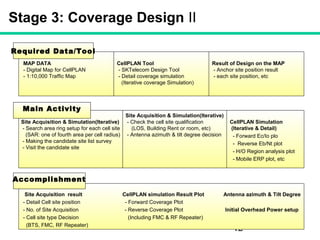
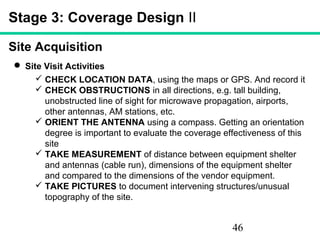
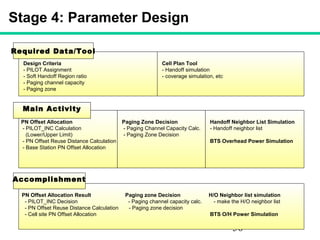
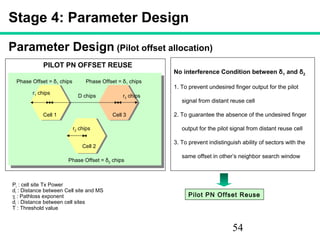
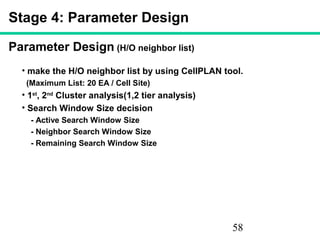
Region Clustering(Quantitative)
Region Class BAI(%)
BSD(m2
) BHD(Floors)
VI(%)
Avg. STD Avg. STD
Rural Flat, Hilly, Mountain < 12 - - - - -
Suburban
Residential(Open) 12 ~ 20 95 ~ 115 55 ~ 70 2 1 >= 2.5
Residential
(no Open)
20 ~ 30 100 ~ 120 70 ~ 90 2 ~ 3 1 <= 5
High-rise residential > = 12 >= 500 >= 90 >= 4 1 <= 2
Urban
Shopping Area 45 ~ 50 200 ~ 250 >= 180 >= 4 1 0
Commercial Area 30 ~ 40 150 ~ 200 >= 160 3 1 0
Industrial Area 35 ~ 45 >= 250 >= 200 2 ~ 3 1 <= 1
Dense
Urban
Shopping Area >= 50 200 ~ 250 >= 180 >= 4 1 0
Commercial Area >= 40 150 ~ 200 >= 160 6 1 0
Industrial Area >= 45 >= 250 >= 200 7 ~ 8 1 <= 1
[Reference] David Parsons “ The mobile radio propagation channel”
Stage 2: RF Environment Analysis](https://image.slidesharecdn.com/rf-networkdesign-130712062944-phpapp02/85/Rf-network-design-24-320.jpg)
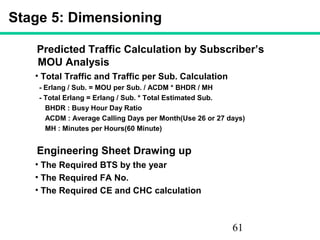
![30
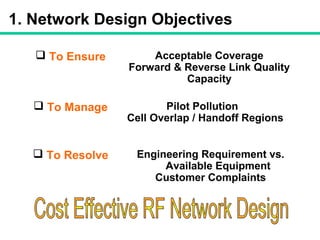
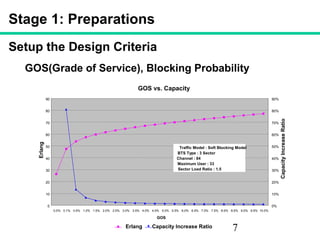
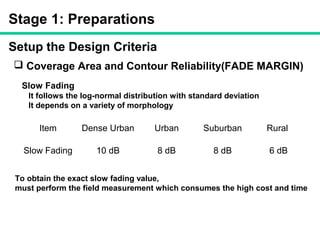
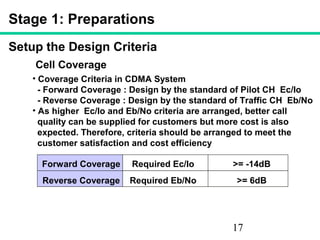
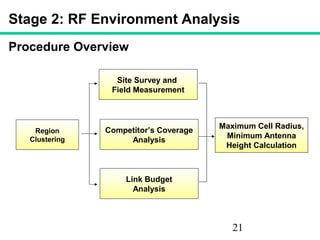
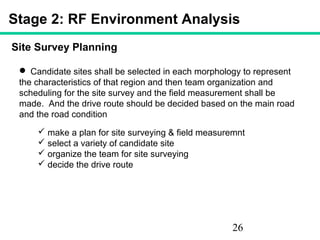
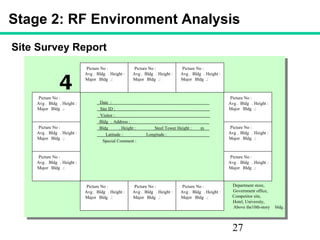
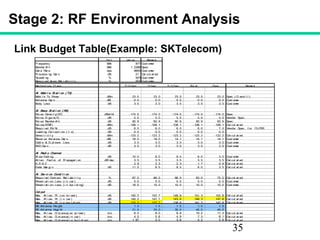
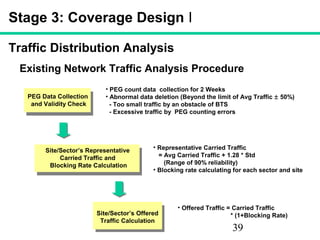
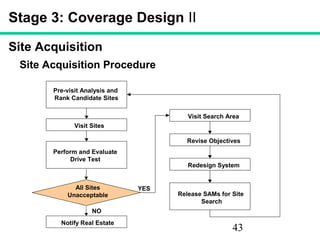
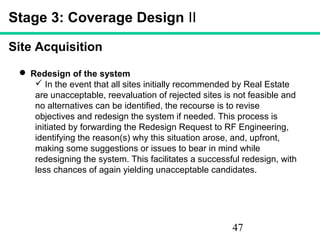
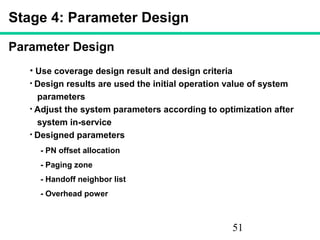
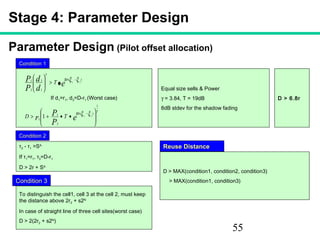
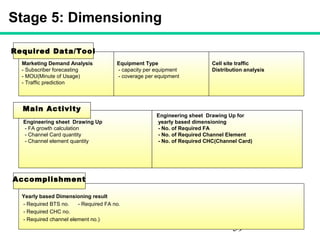
Field Measurement
- Measurement Data Analysis(1)
Perform the Data Gathering and Analysis
Calculate the distance for each measurement point
Calculate the average Rx level for unit area (30m * 30m)
Calculate the average Rx level for distance
Path Loss Calculation
Path Loss = Transmit signal Power – Received signal power [dBm]
Path Loss data is used to perform the Measurement integration to
calculate the exact Propagation model
By using the Cell Planning tool,
It will be easy to perform the MI
Stage 2: RF Environment Analysis](https://image.slidesharecdn.com/rf-networkdesign-130712062944-phpapp02/85/Rf-network-design-30-320.jpg)

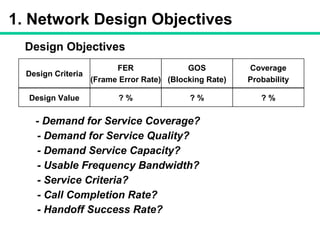
The document outlines the procedure for CDMA network design in 5 stages: 1. Preparations including setting design criteria like coverage reliability, capacity, and soft handoff ratios. 2. RF environment analysis involving region clustering, site surveys, competitor analysis, and link budget analysis. 3. Coverage design for outdoor, indoor, and underground areas. 4. Parameter design including pilot assignment and base station dimensioning. 5. Reporting and dimensioning to determine equipment requirements.