Downloaded 1,434 times
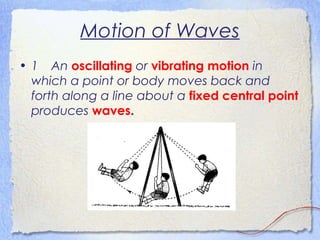
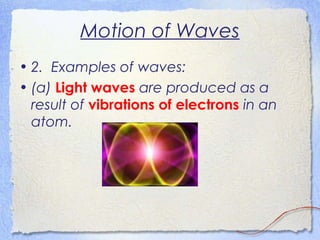
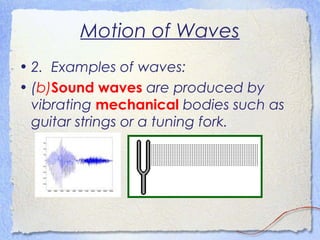

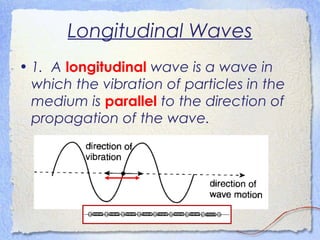
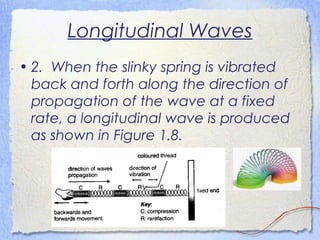
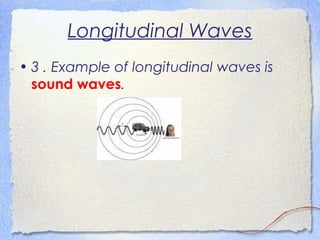
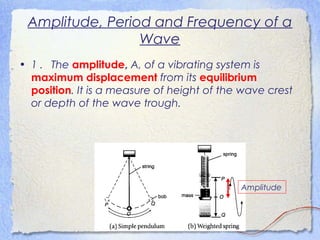
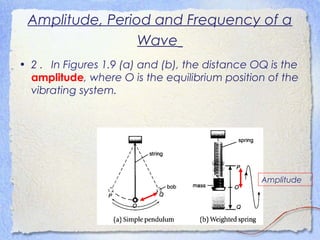
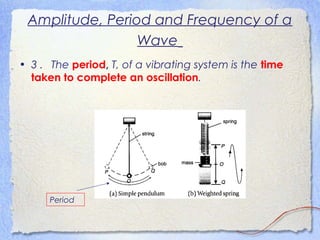
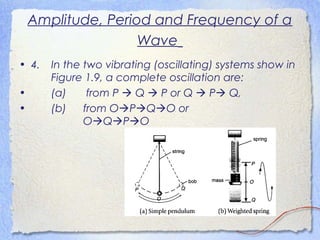
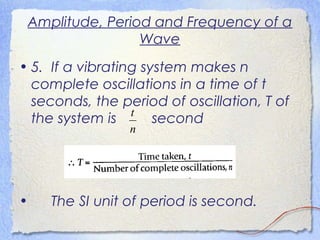
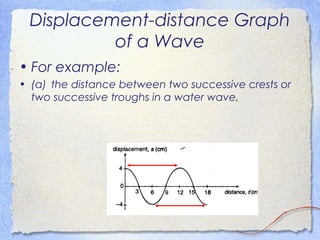
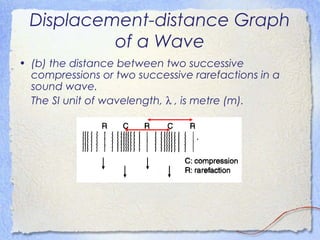
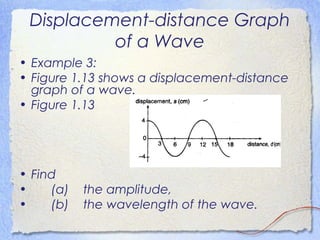
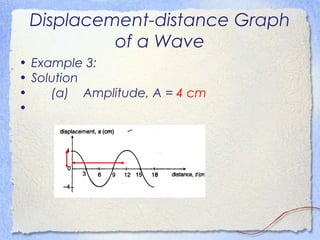
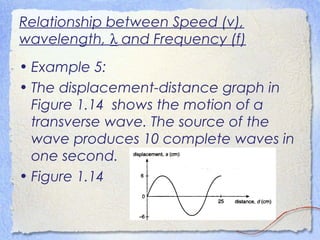

1. Waves transfer energy from one place to another through a medium without transferring matter. They are produced by a vibrating or oscillating source and can be transverse or longitudinal. 2. Key wave properties include amplitude, wavelength, period, frequency, and speed. Amplitude is the maximum displacement from equilibrium, wavelength is the distance between peaks, period is time for one cycle, frequency is cycles per second, and speed depends on wavelength and frequency. 3. Waves can be characterized by displacement-time graphs showing oscillation over time or displacement-distance graphs showing the pattern of compression and rarefaction as the wave propagates through a medium.


