Download to read offline
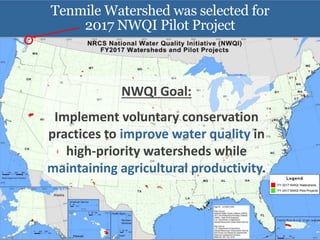
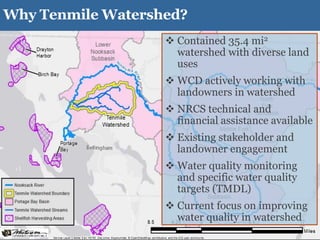
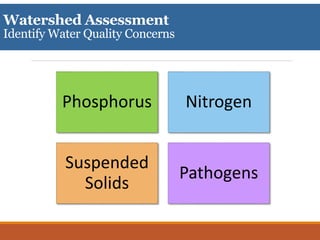
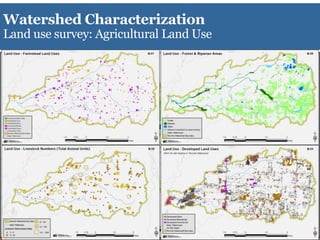
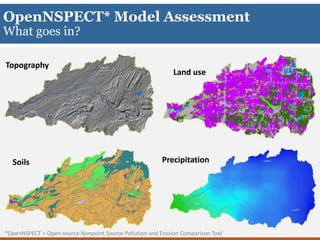
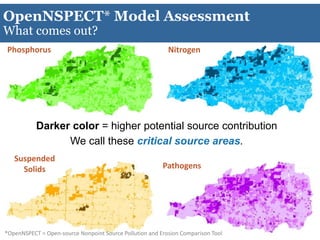
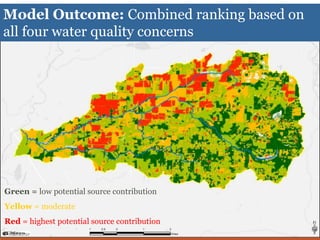
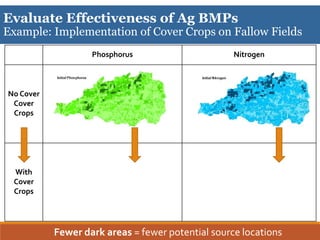
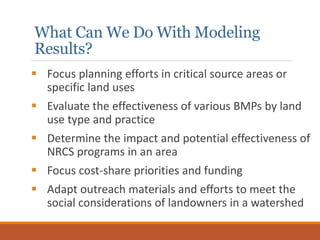
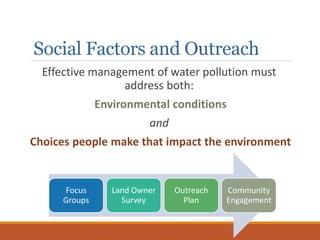
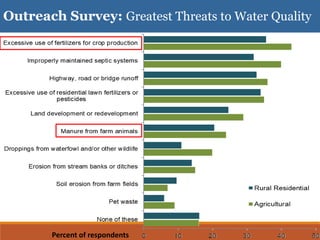
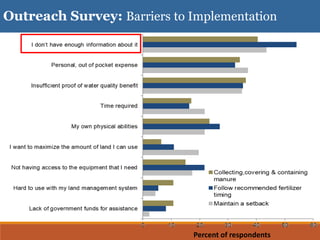
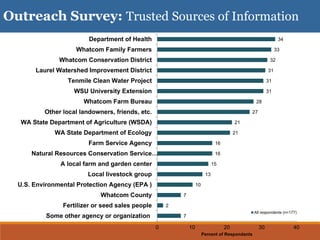
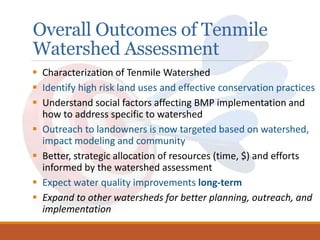
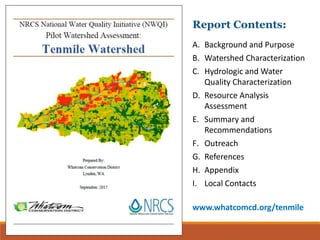

The document summarizes a watershed assessment of the Tenmile Watershed that was selected as a pilot project to improve water quality. The assessment identified critical sources of pollution, evaluated the effectiveness of conservation practices, and informed outreach efforts to landowners. Modeling identified areas with the highest potential to contribute phosphorus, nitrogen, sediments, and pathogens to the watershed. Cover crops were shown to reduce phosphorus and nitrogen levels. A survey found the greatest threats to be agriculture and development, while funding and lack of information were barriers to adopting practices. Outreach is now targeted based on the watershed assessment results.


