Download as PDF, PPTX

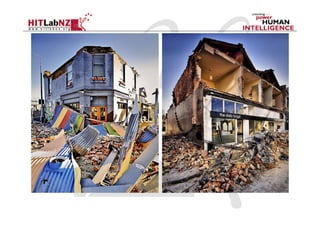
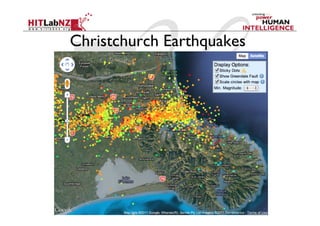
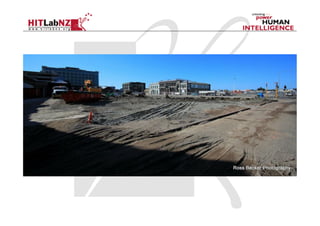
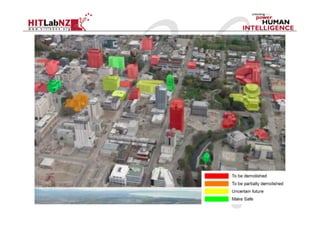
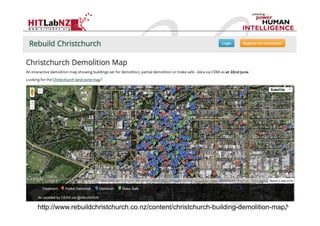
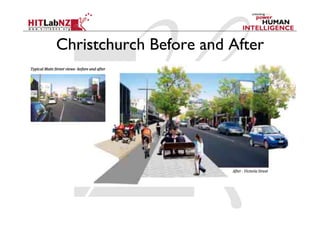
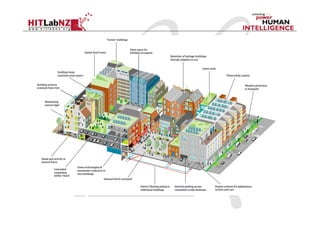
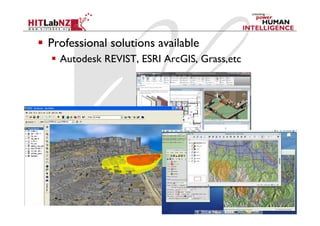
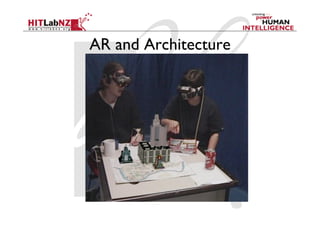
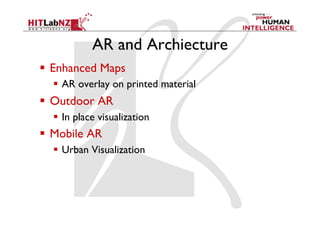
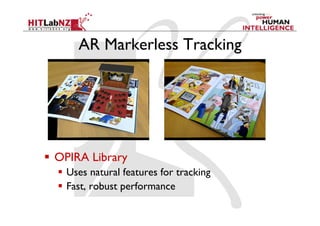
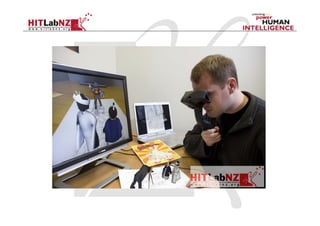
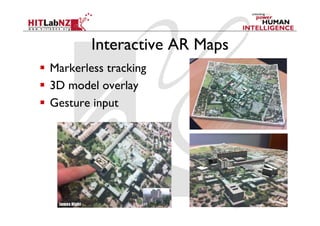
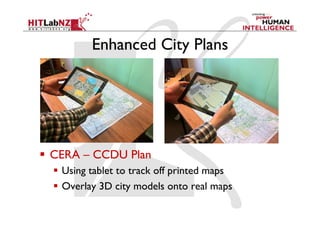
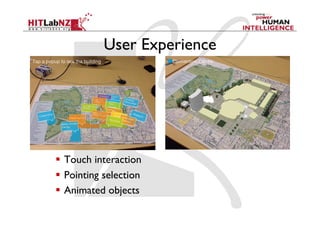

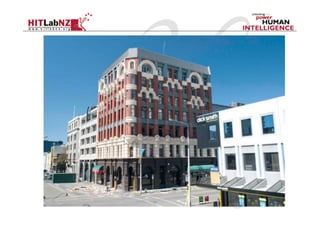
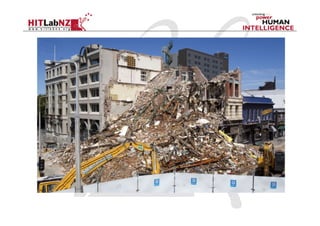
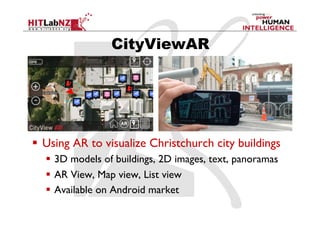
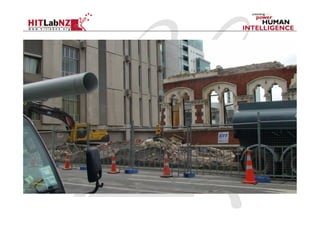
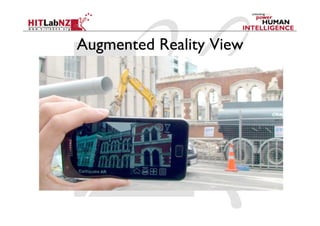
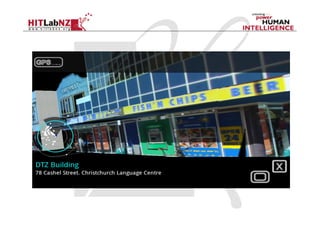
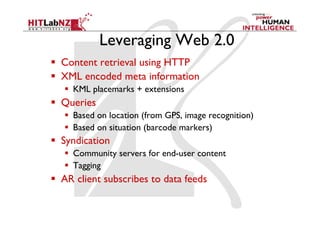
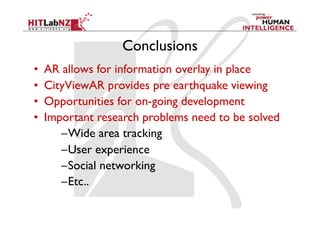

The document discusses the development and applications of augmented reality (AR) technologies for urban visualization and user interaction, particularly in the context of rebuilding Christchurch after earthquakes. It highlights various AR tools, their user experiences, and the limitations such as interface complexity and tracking accuracy. It also emphasizes the potential for future improvements and ongoing research in areas like tracking, user experience, and web-based content management.


