Downloaded 17 times
![2 October 2015Institute of Geomatics Engineering 13
Viewer API
map3d.js Library
var map = new map3d.map("mapcanvas");
var layer = new map3d.imageLayer([
"http://t1.3dmaps.ch/tiles/teatime",
"http://t2.3dmaps.ch/tiles/teatime",
"http://t3.3dmaps.ch/tiles/teatime",
"http://t4.3dmaps.ch/tiles/teatime"]) });
layer.addTo(map);
var teapot_marker = new map3d.marker("Green Teapot", [0,0,0]);
teapot_marker.addTo(map);
var cube_maker = new map3d.marker("Green Cube", [80.5, 11.5, 10.5]);
cube_maker.addTo(map);](https://image.slidesharecdn.com/3dpresentationgsw20152-151002151614-lva1-app6892/85/Visualisation-of-Complex-3D-City-Models-on-Mobile-Webbrowsers-Using-Cloud-based-Image-Provisioning-13-320.jpg)
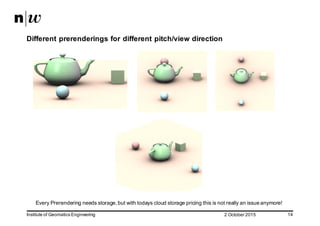
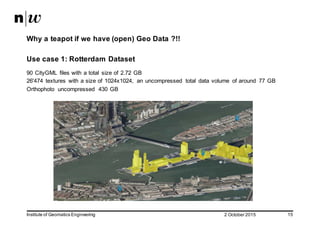
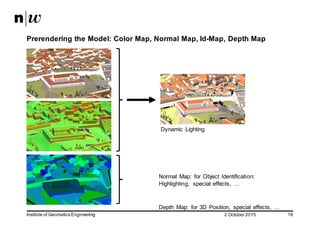


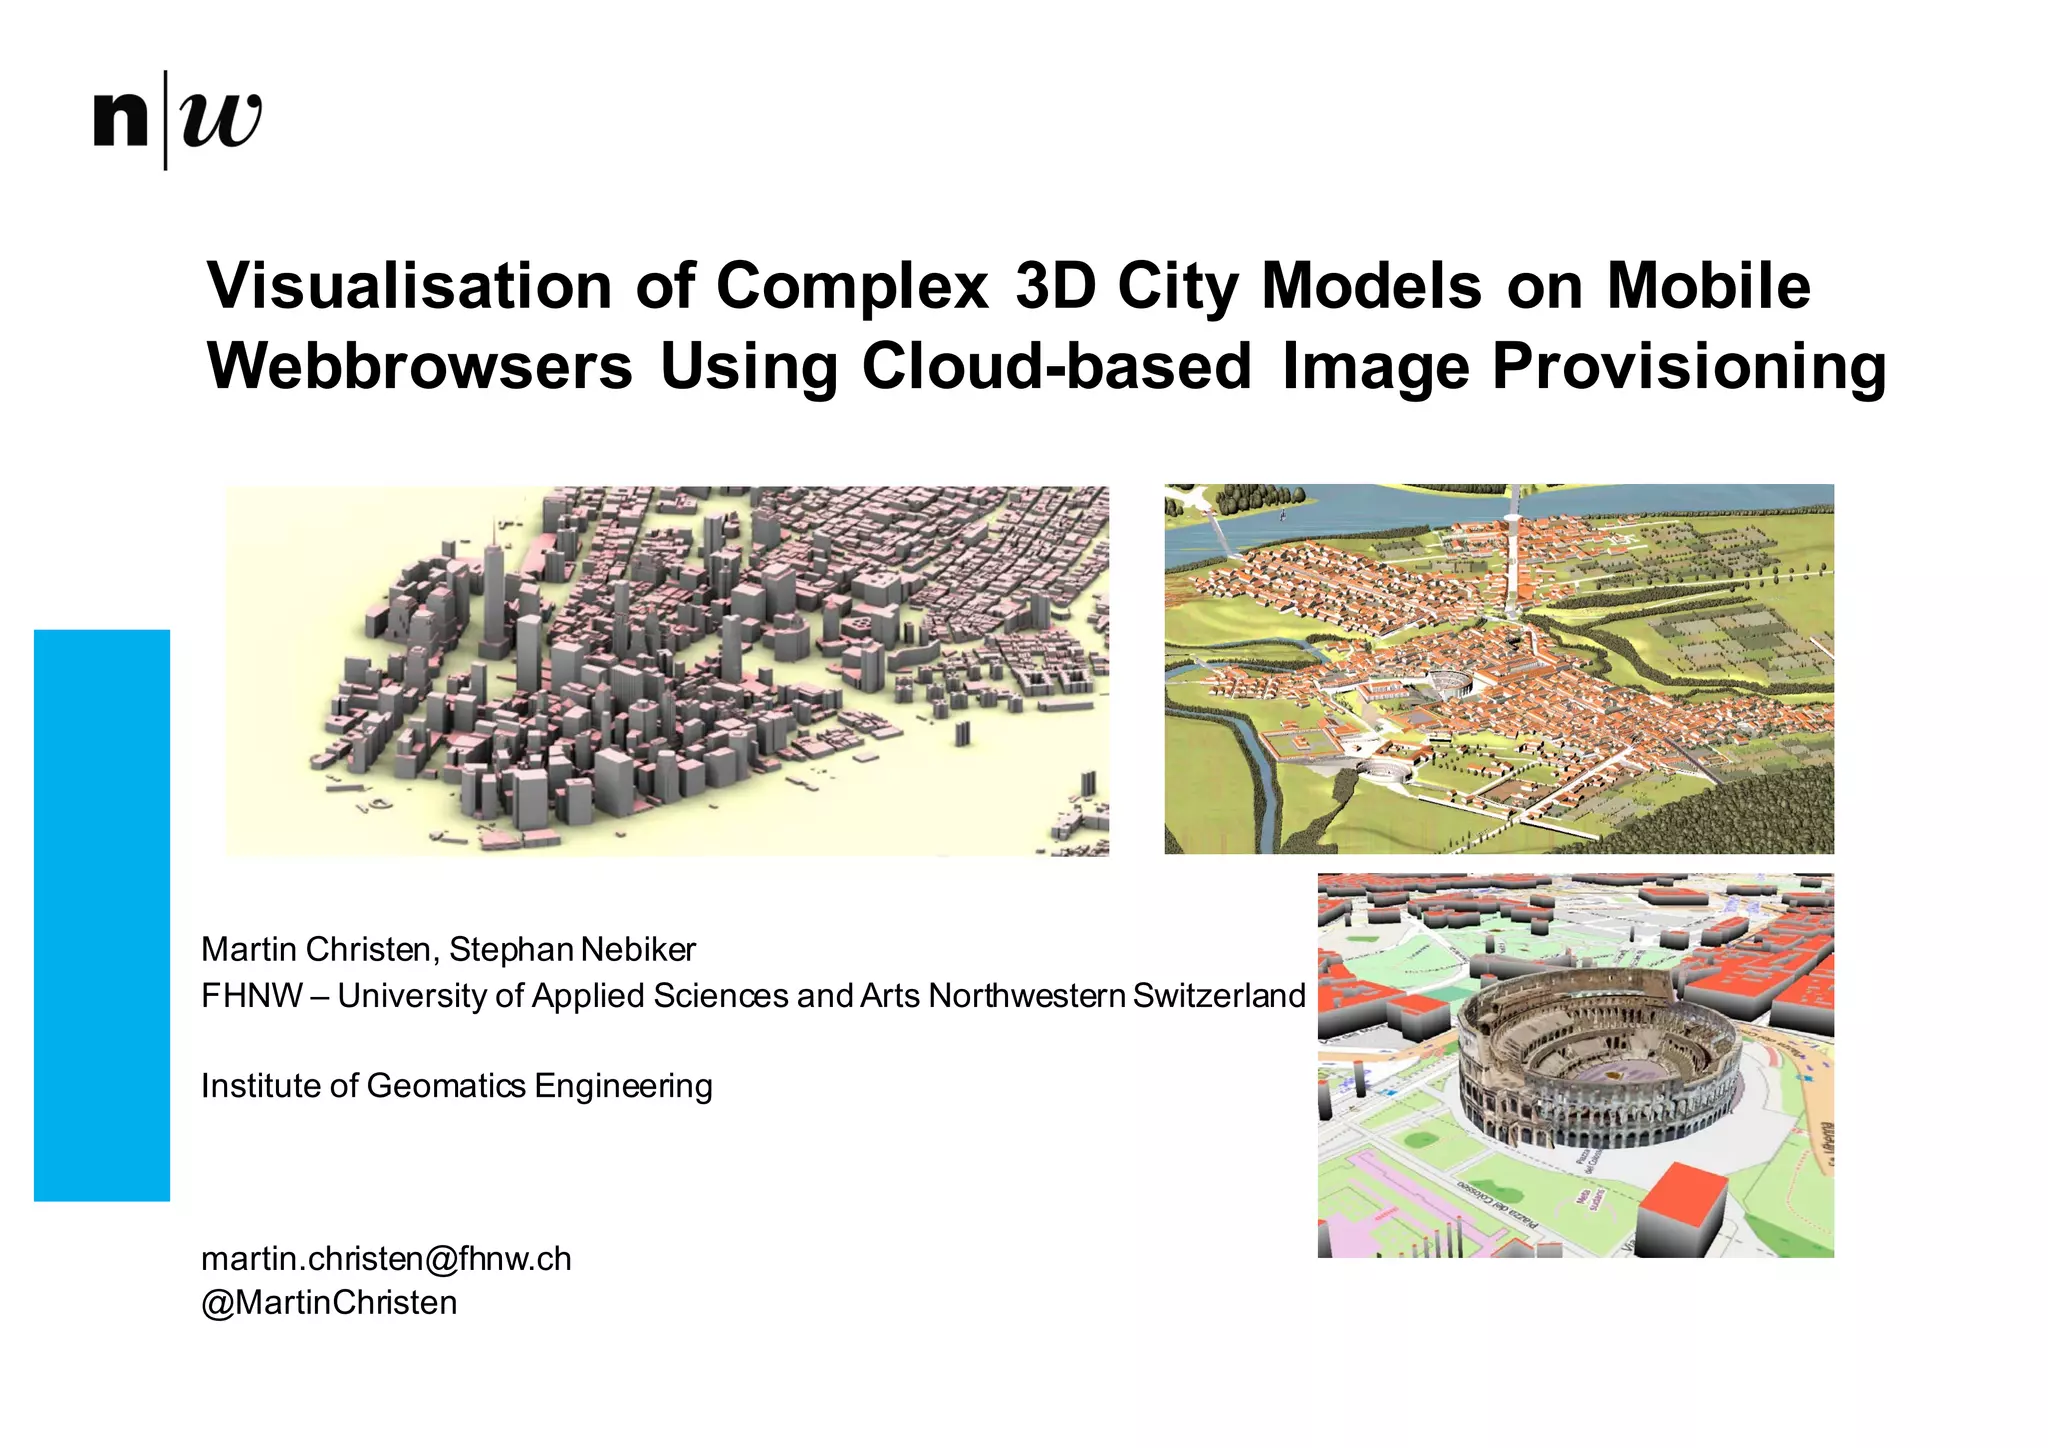
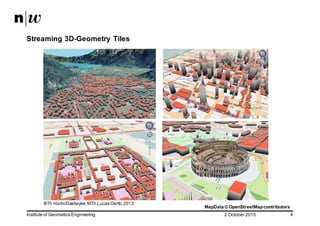
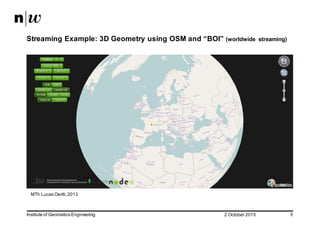
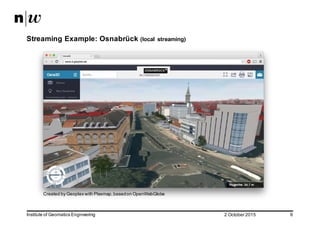
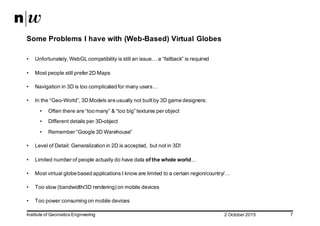
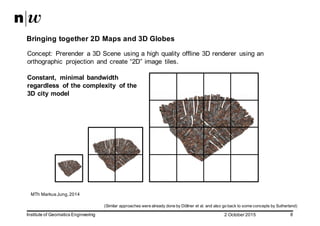
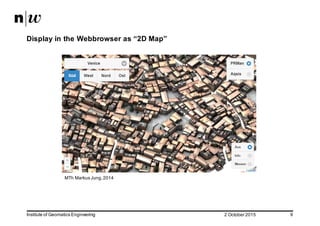
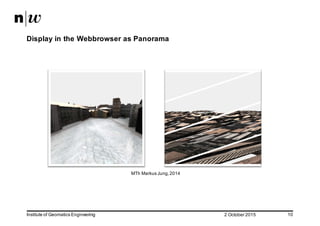
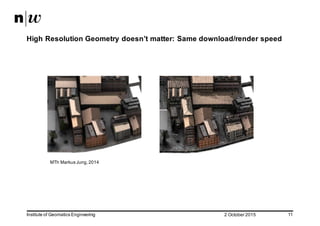
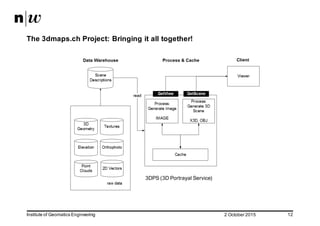
This document discusses the development of a cloud-based solution for visualizing complex 3D city models on mobile web browsers, utilizing WebGL and a JavaScript library for rapid development. It highlights challenges with current virtual globes, such as compatibility and navigation issues, and introduces a method of pre-rendering 3D scenes into 2D image tiles for efficient streaming. Future plans include enhancements to effects and lighting while aiming to keep the solution accessible and user-friendly across various devices.