Download to read offline
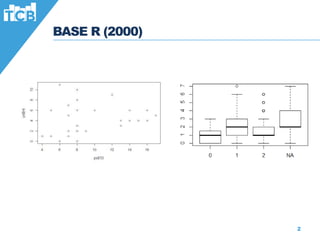
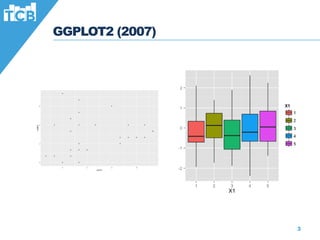
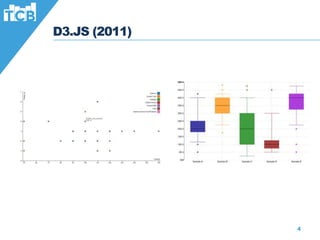

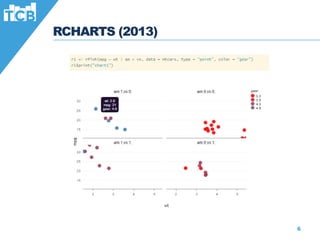
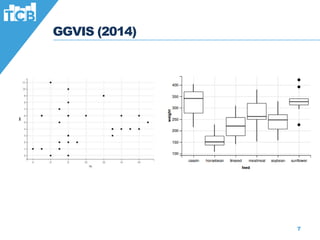


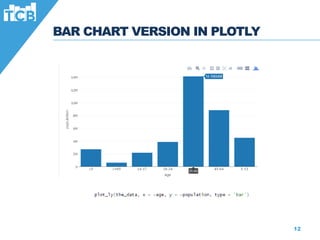


This document discusses various charting and visualization libraries for R and JavaScript. It outlines the evolution of charting libraries in R like base R, ggplot2, and plotly. It also lists popular JavaScript charting libraries like D3.js and Chart.js. The document demonstrates how charts like pie and bar charts can be created more efficiently in plotly compared to D3.js. It shows examples of dashboards created with Shiny and plotly that require less code than pure JavaScript equivalents. Finally, it discusses considerations for choosing R with plotly versus other options like D3.js and highlights benefits of using plotly in R.


![5G Explained! A High Level Overview [Introduction]](https://cdn.slidesharecdn.com/ss_thumbnails/5gexplainedahighleveloverview-260119165306-cc137a3e-thumbnail.jpg?width=640&height=640&fit=bounds)


