Download as PDF, PPTX


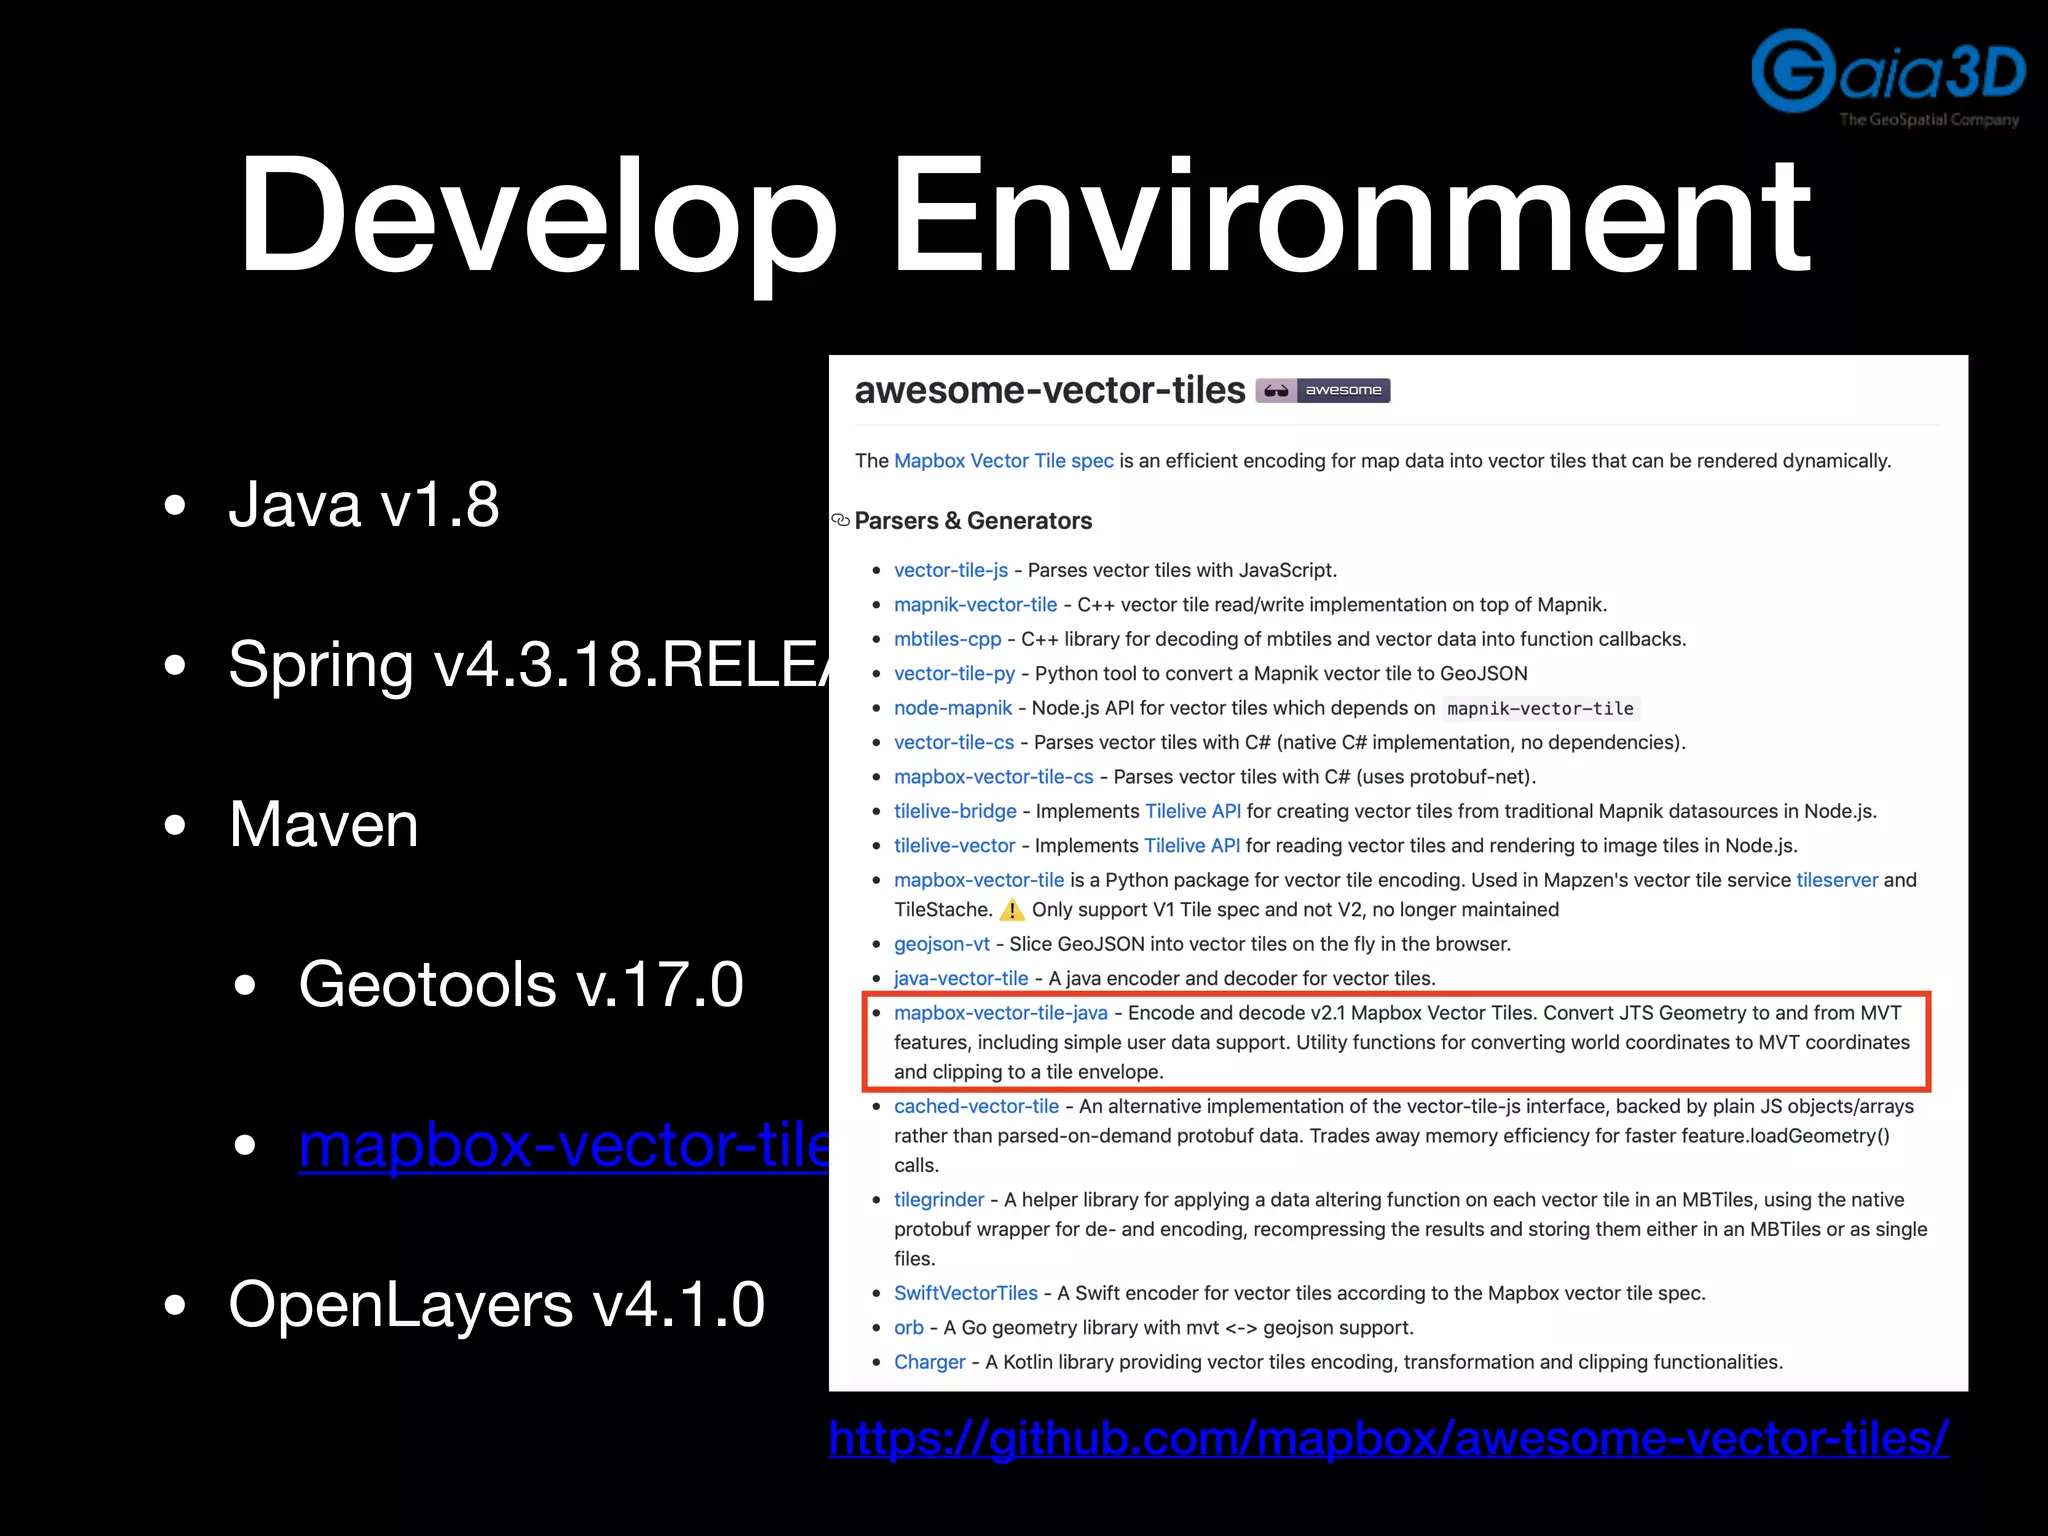


![Problems and Solutions
Calculate buffer extent.
Rewrite the code for me with refer to the globalmaptiles.py code.
This project TMS origin
[0,0] in left-top.
This project use
custom projection
GEOS, LCC etc.](https://image.slidesharecdn.com/vectortileforseawinddata-190911061420/75/Vector-Tile-for-Sea-Wind-19-2048.jpg)


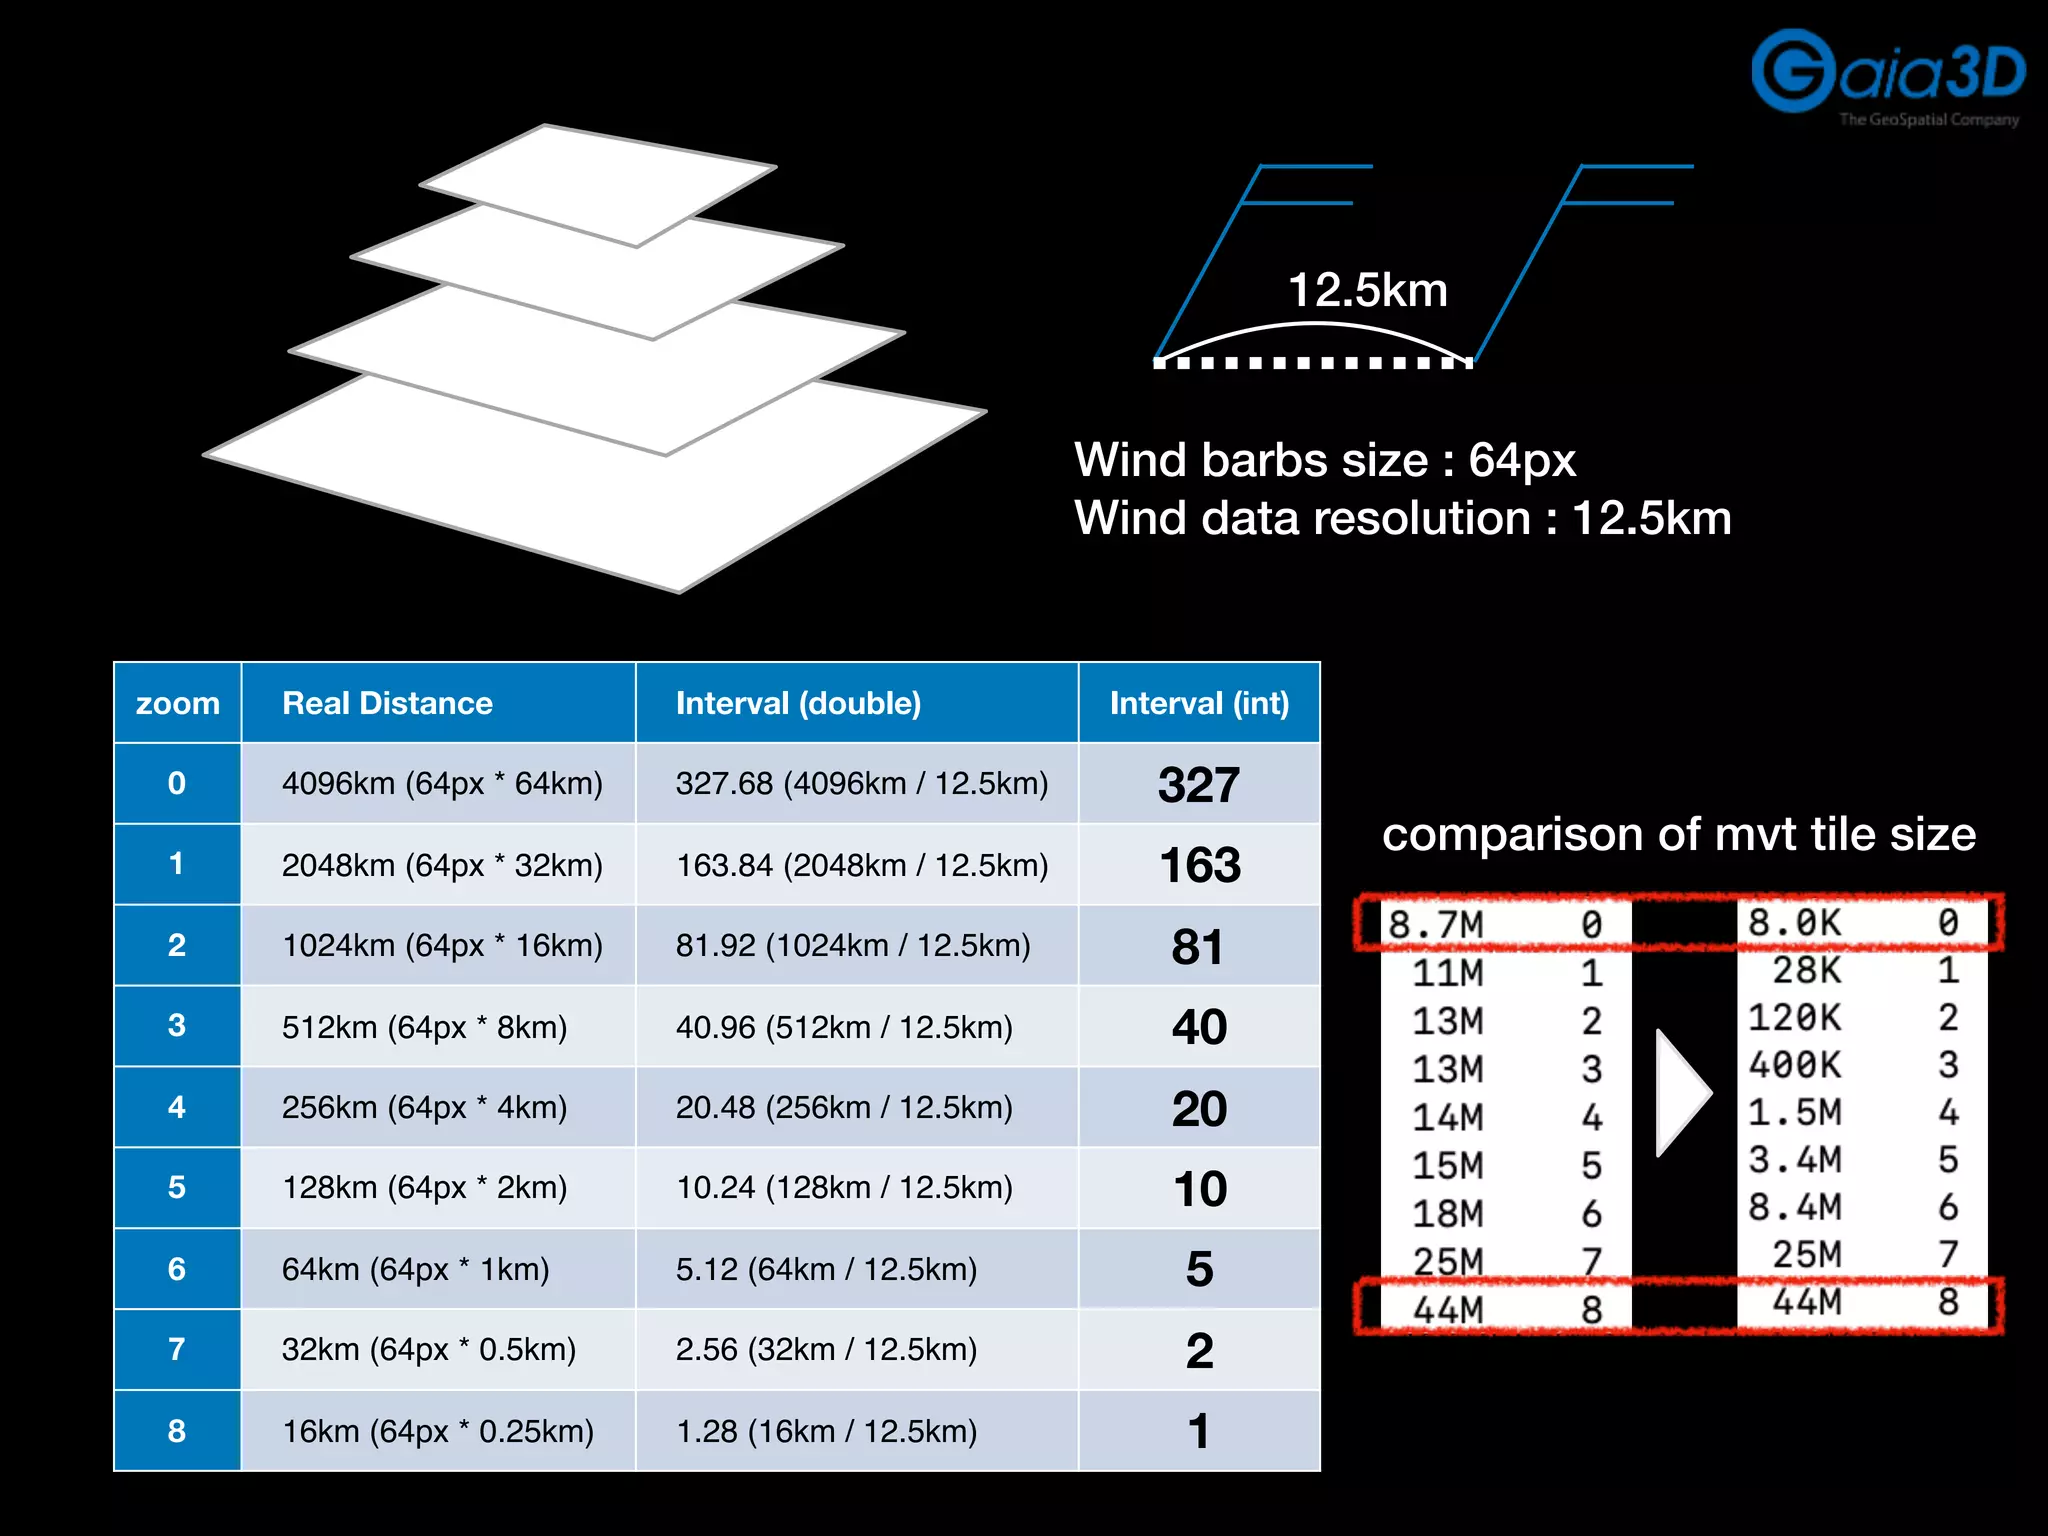
![Display and Styling
Use openlayers vector tile layer
tilePixelRatio = extent / tileSize (4096 / 256), MvtLayerParams.class
new ol.layer.VectorTile({
renderMode: 'image',
style: stnStyle['seawind'],
source : new ol.source.VectorTile({
url: APISERVER_URL+'/urlapi/spatialvector/{z}/{x}/{y}.do?',
format: new ol.format.MVT(),
projection: 'EPSG:810002',
tileGrid: new ol.tilegrid.TileGrid({
extent: ol.proj.get('EPSG:810002').getExtent(),
resolutions: [64000, 32000, 16000, 8000, 4000, 2000, 1000, 500, 250]
}),
tilePixelRatio: 16
})
})](https://image.slidesharecdn.com/vectortileforseawinddata-190911061420/75/Vector-Tile-for-Sea-Wind-22-2048.jpg)


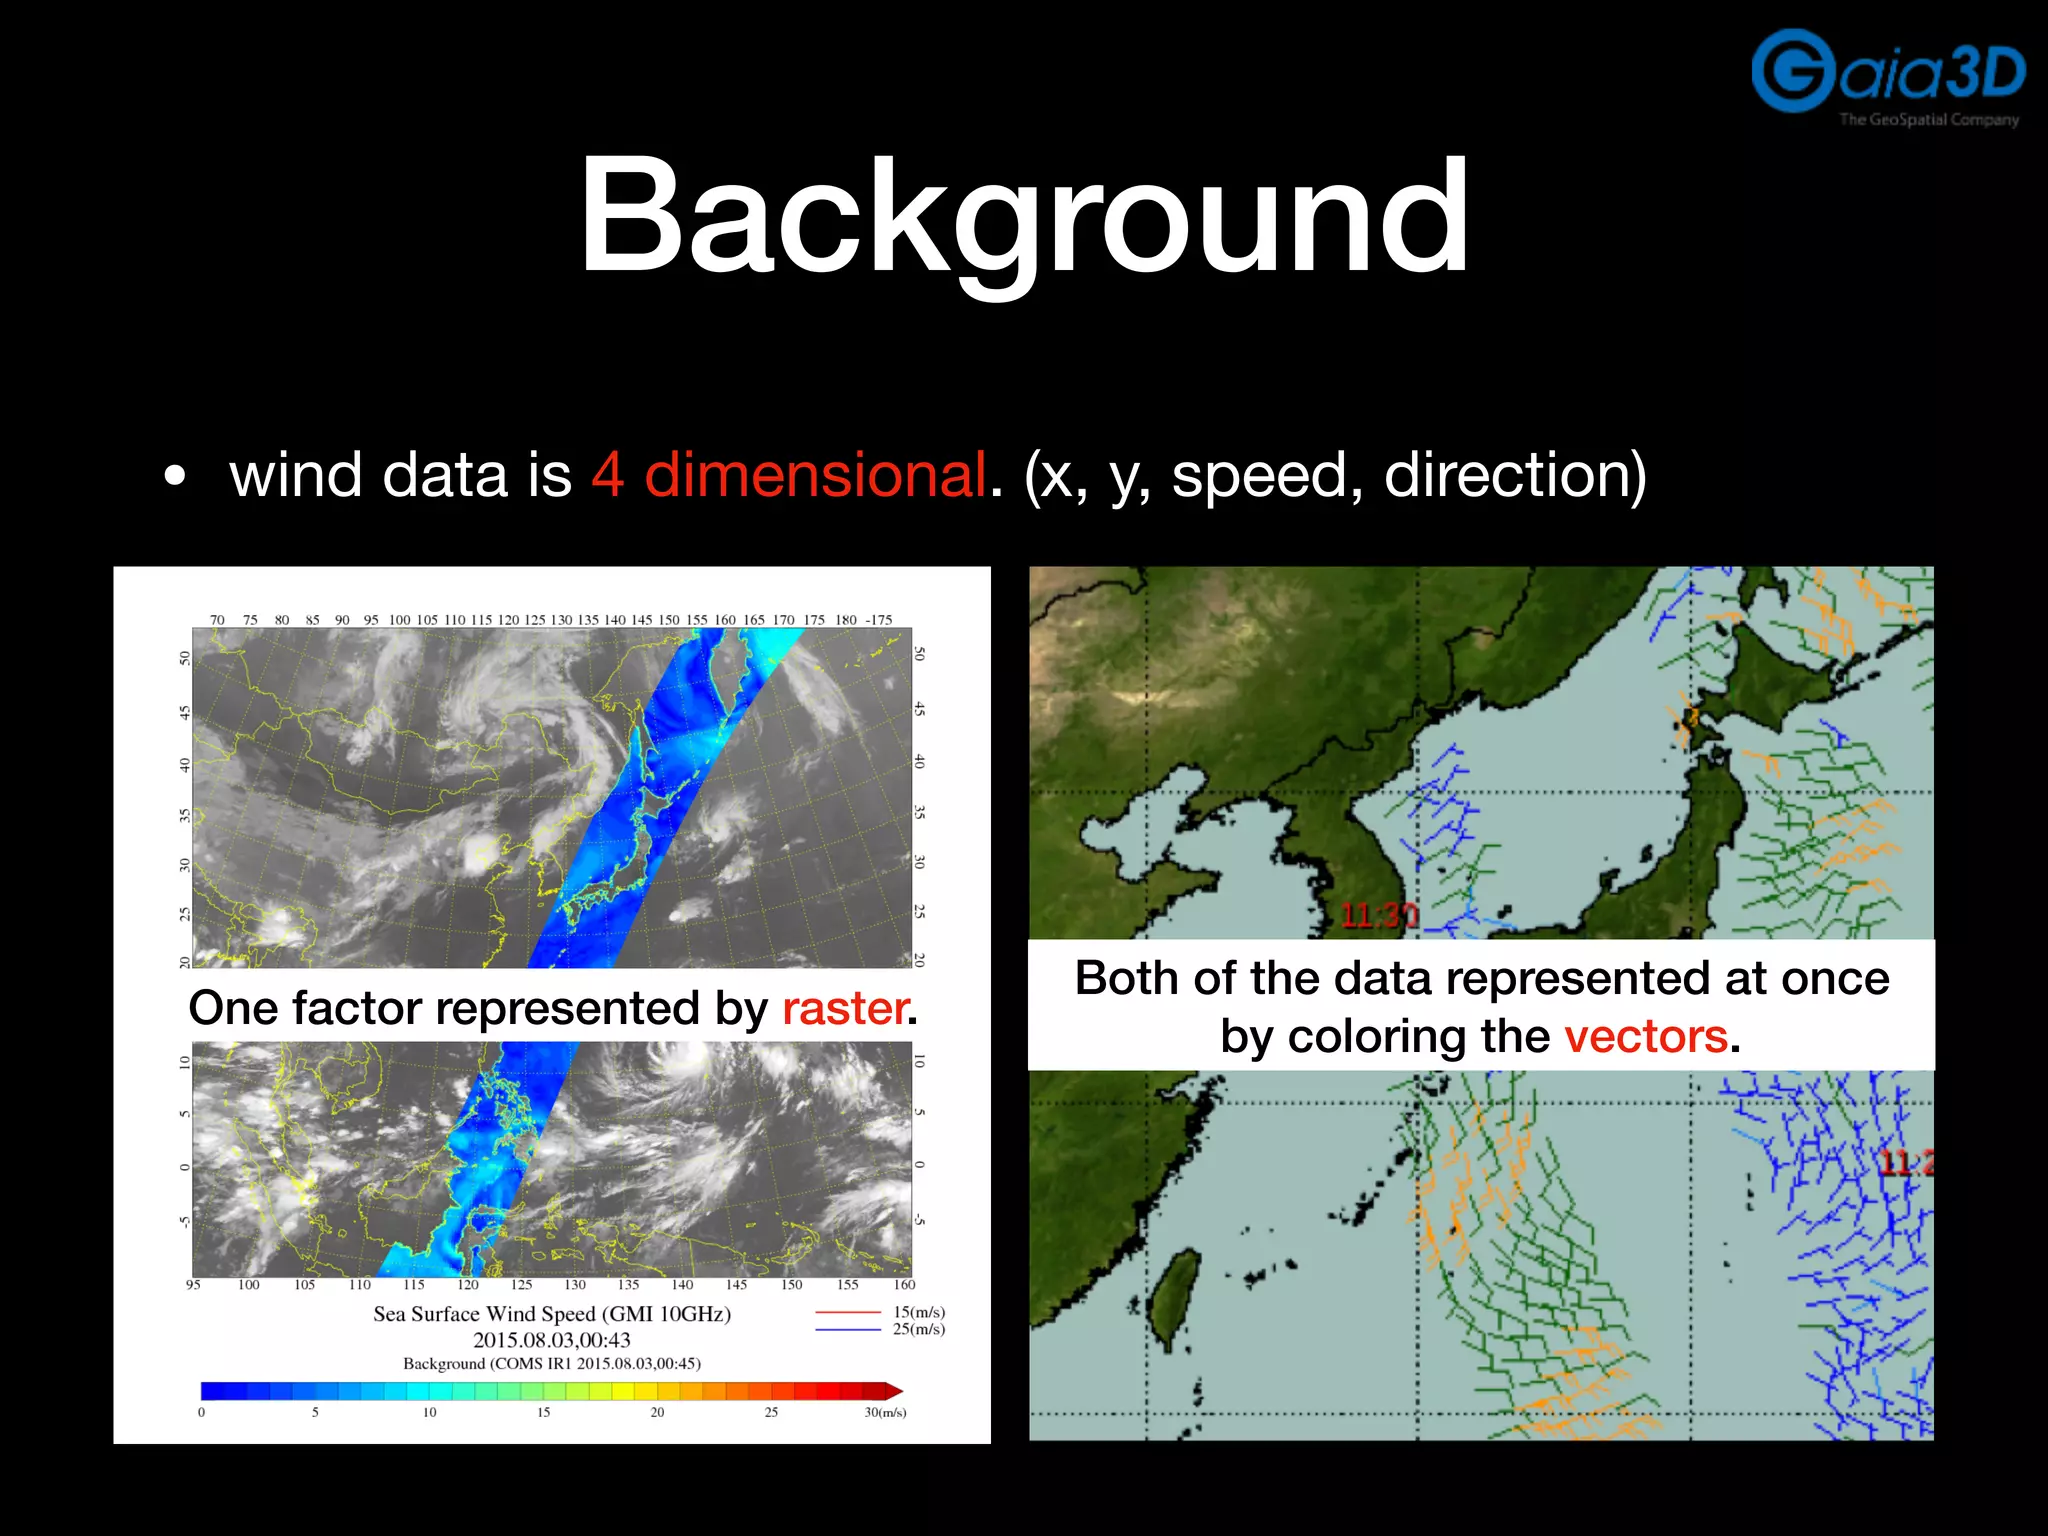
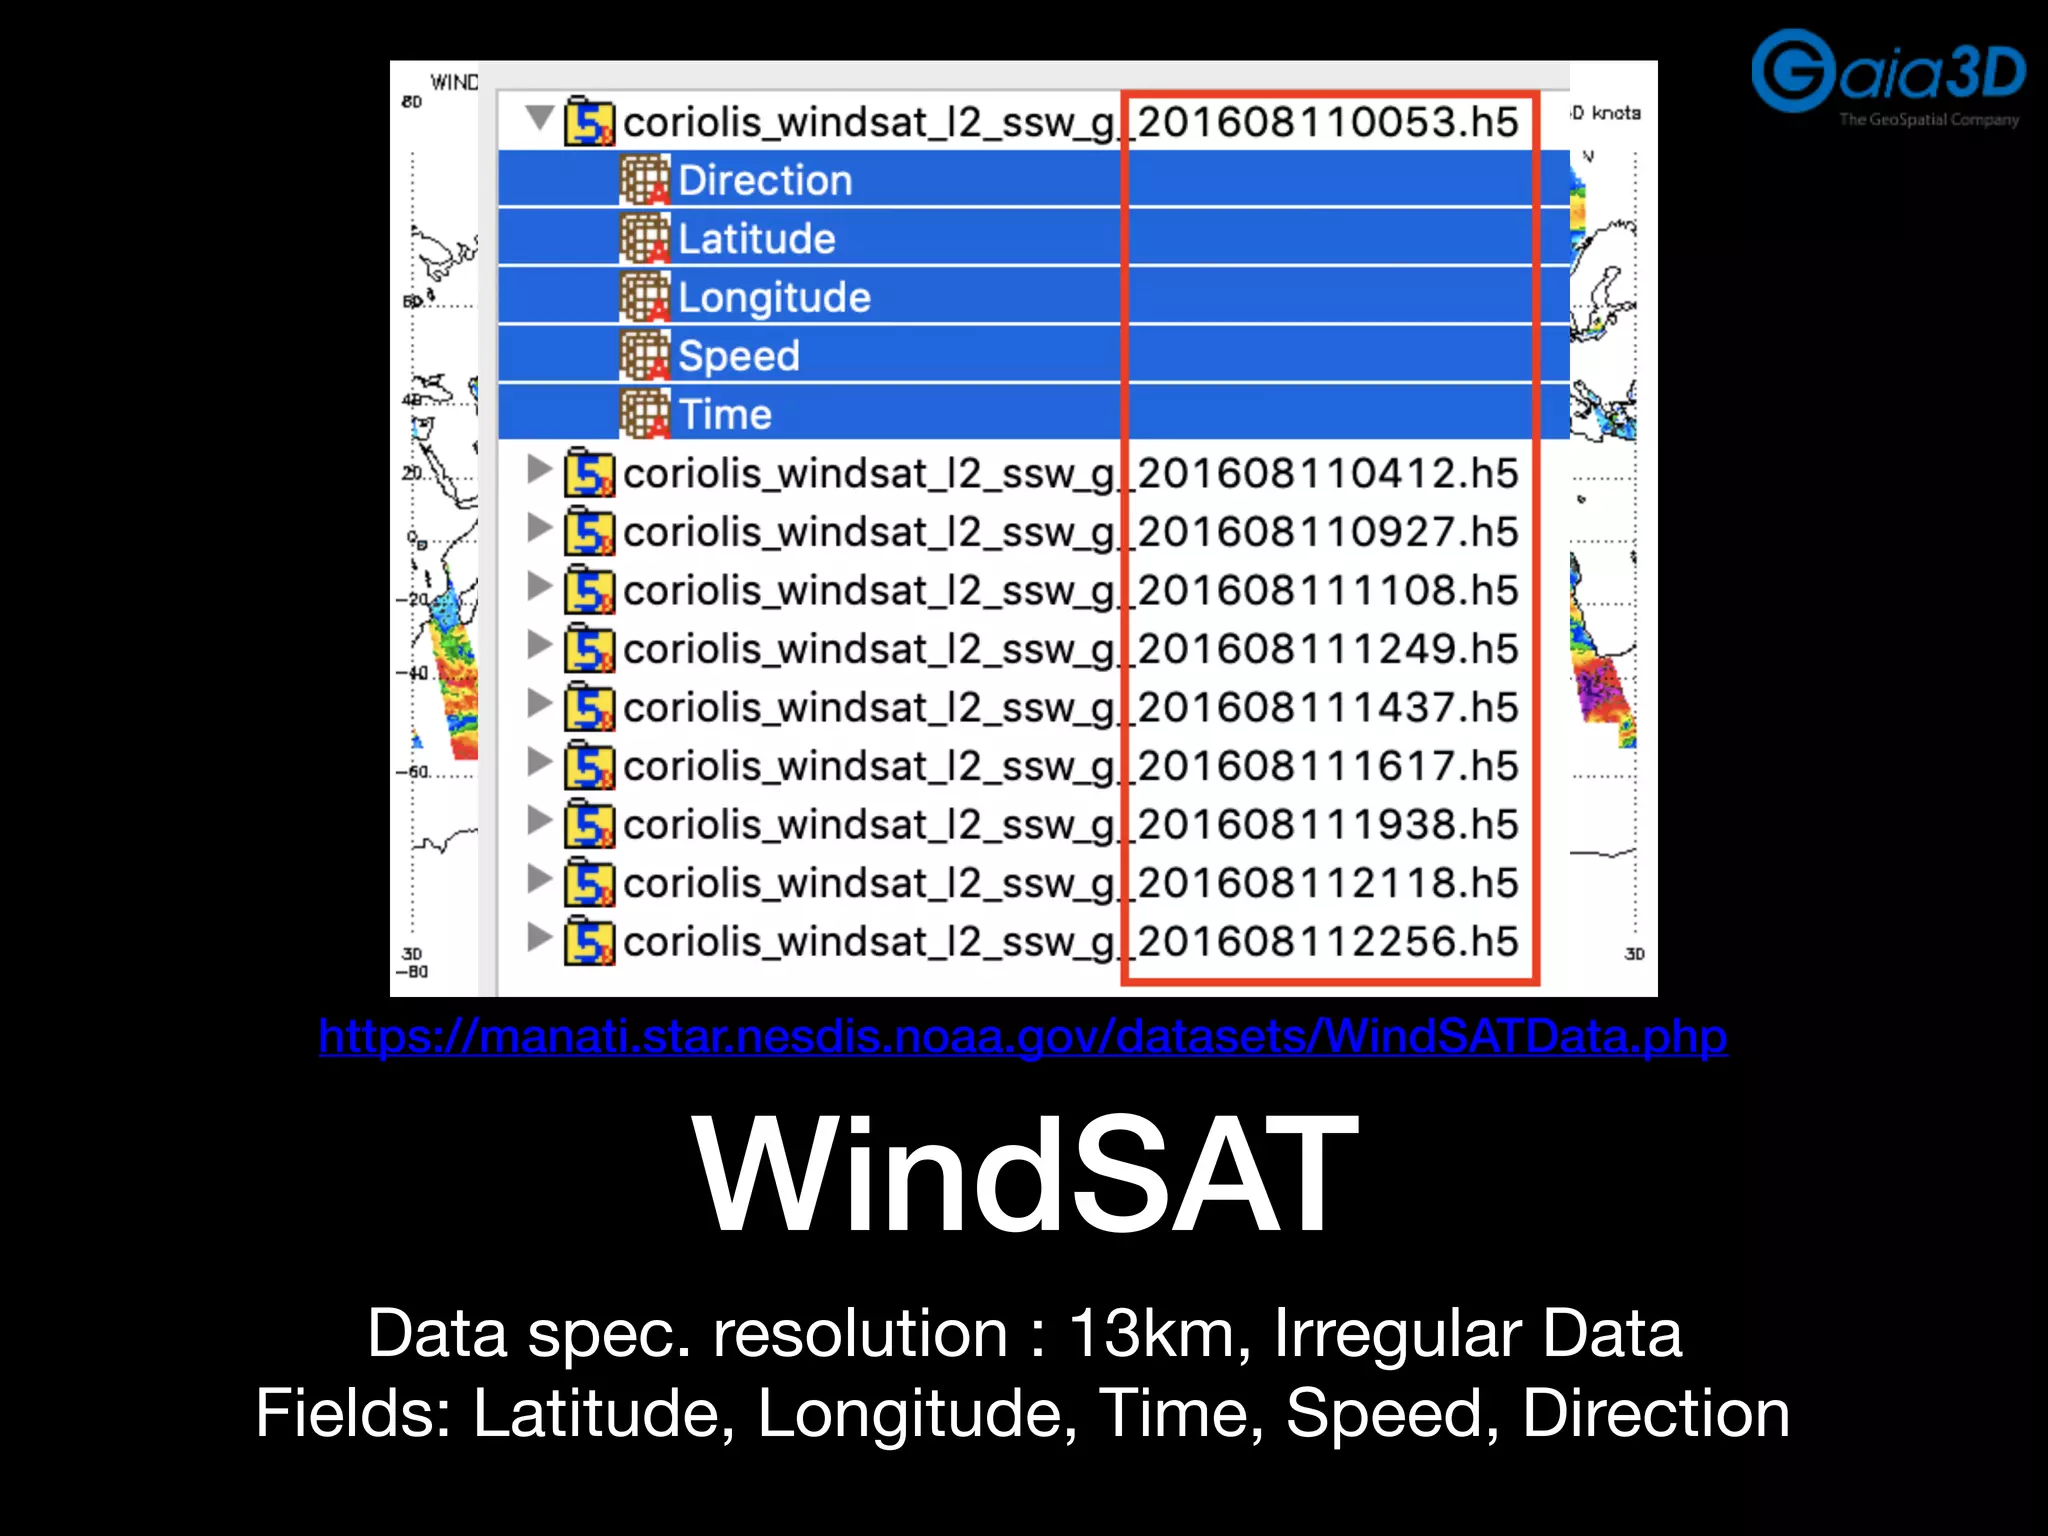
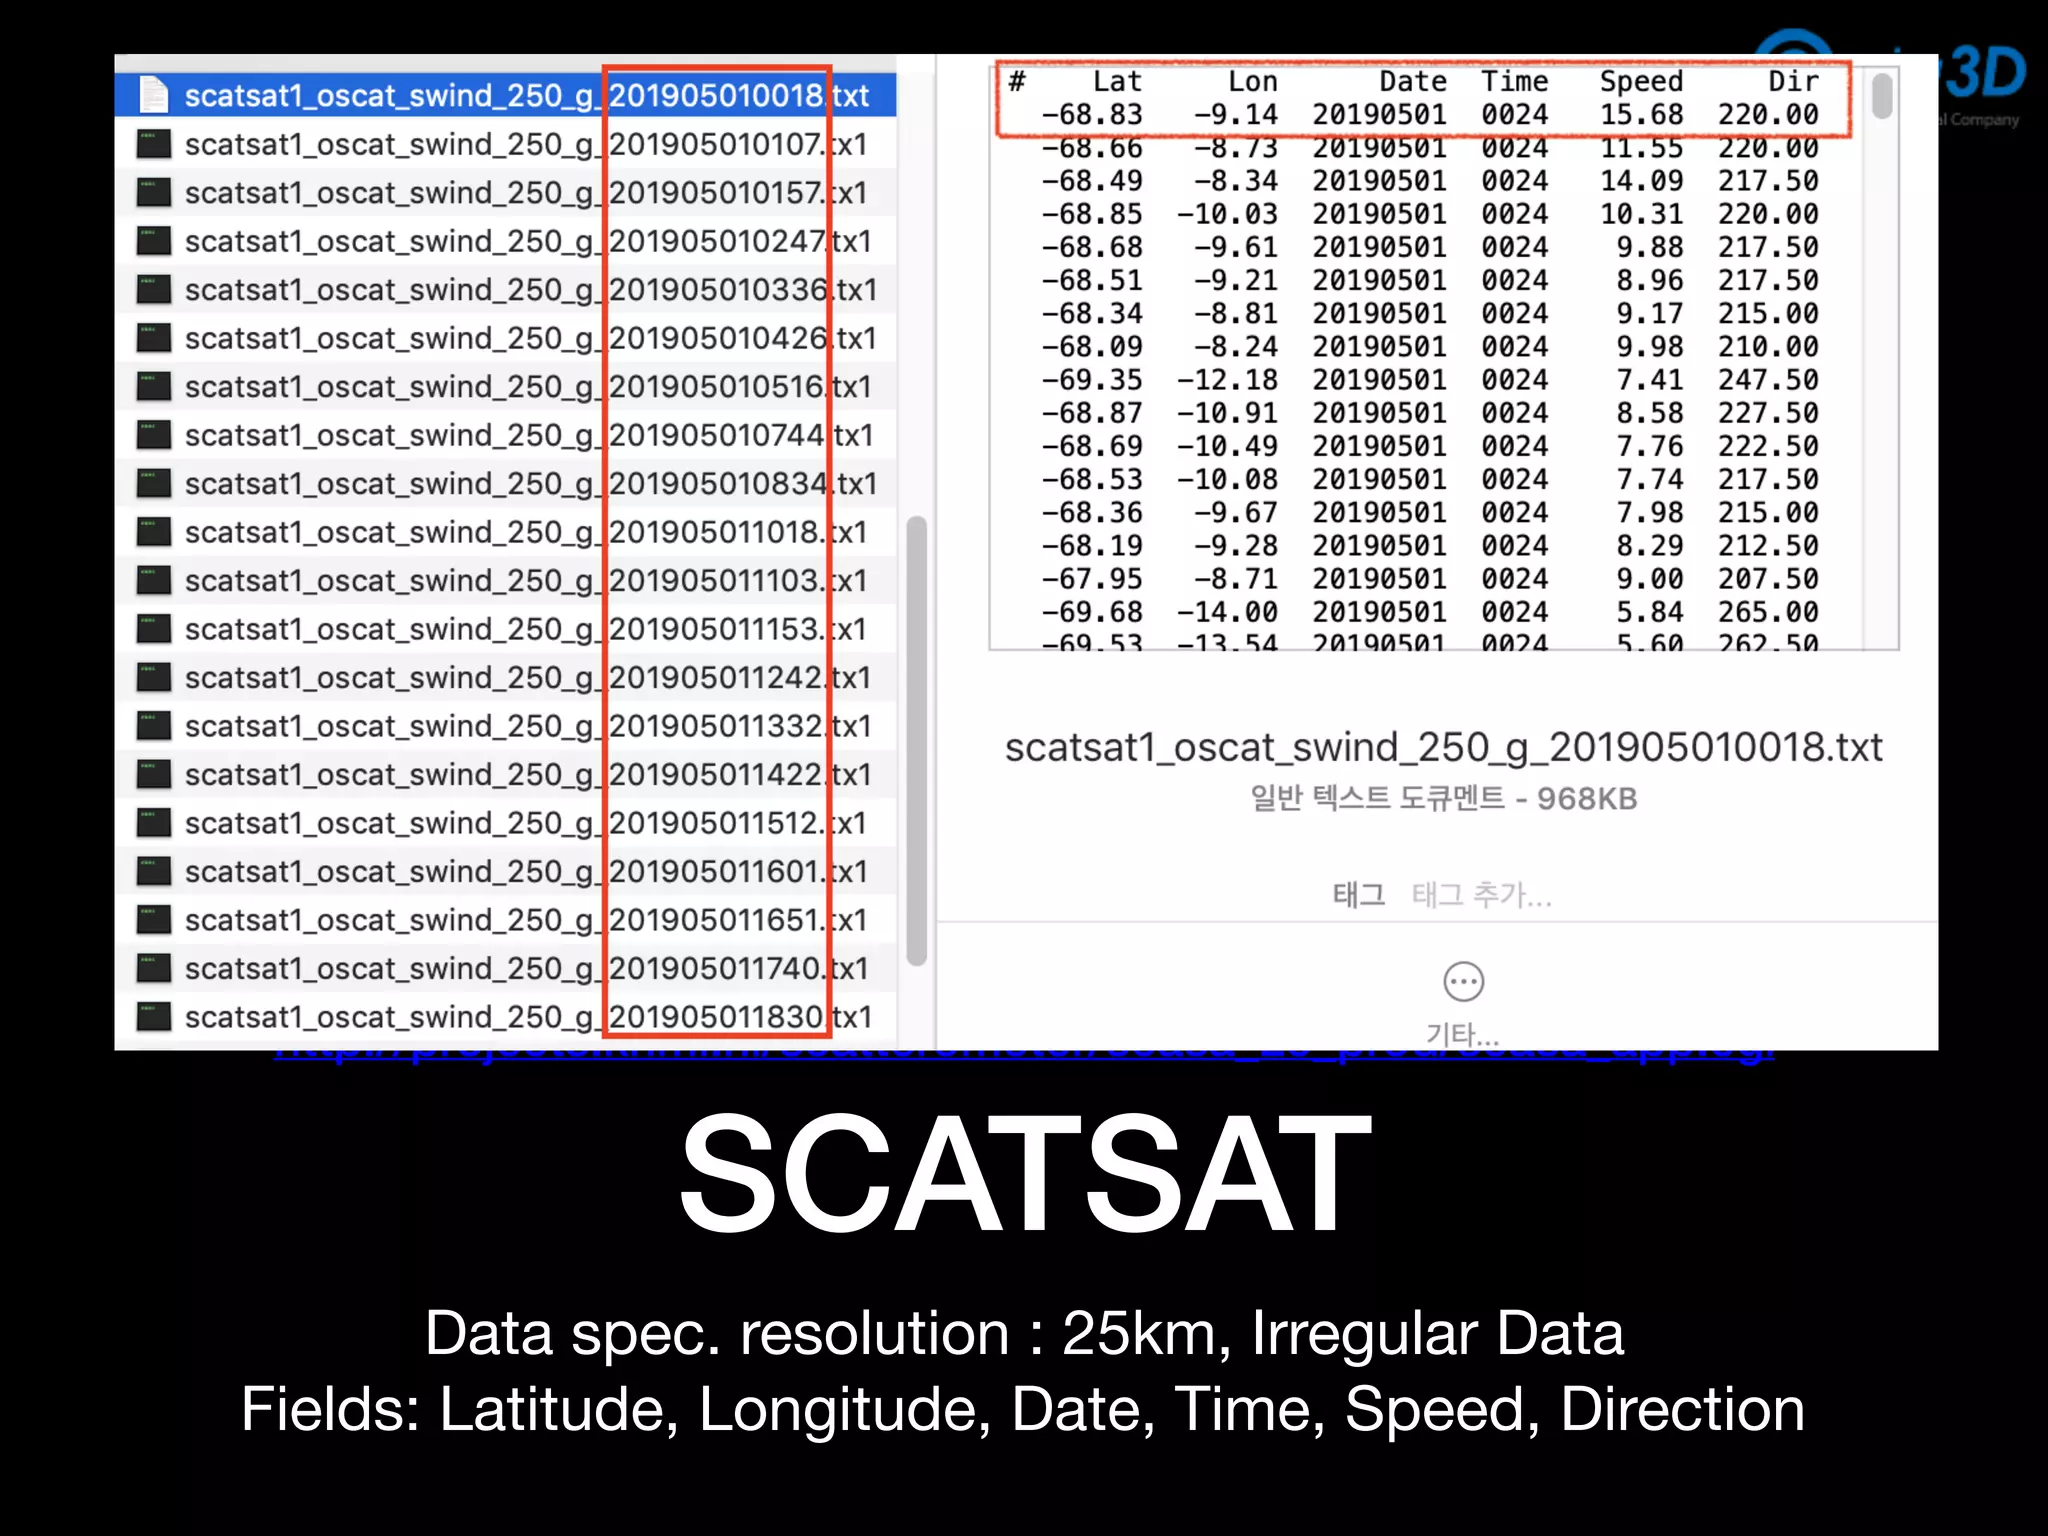
The document discusses the development and application of vector tiles for visualizing wind data from the Seawind project, detailing the specifications, data processing workflow, and resolution information for various datasets. It also addresses challenges faced during implementation, such as data interpolation and point label management, along with proposed solutions. A live demo link is provided for practical demonstration purposes.


![[공간정보시스템 개론] L11 공간정보의 구축](https://cdn.slidesharecdn.com/ss_thumbnails/l11-170314114751-thumbnail.jpg?width=640&height=640&fit=bounds)


![[벤틀리시스템즈코리아 사용자세미나]세슘(Cesium) 제품과 디지털트윈 구현 사례](https://cdn.slidesharecdn.com/ss_thumbnails/gaia3dcesiumintroductionusecase1029-241104081234-24208b36-thumbnail.jpg?width=640&height=640&fit=bounds)


![Vibe Coding vs. Spec-Driven Development [Free Meetup]](https://cdn.slidesharecdn.com/ss_thumbnails/vibecodingvsspecdrivendevelopment-251209105622-43f455e7-thumbnail.jpg?width=640&height=640&fit=bounds)


