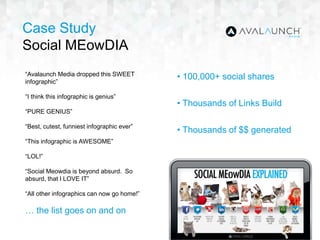
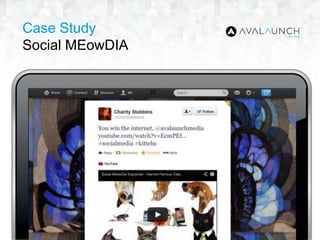
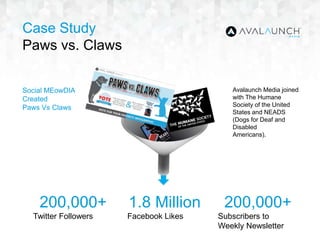
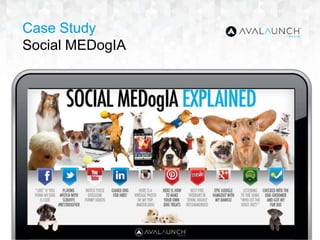
Downloaded 230 times


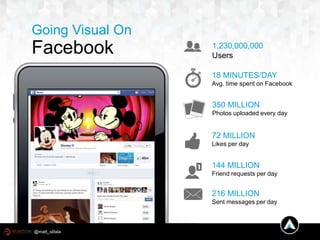
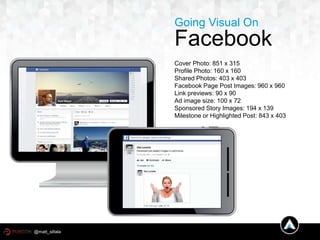
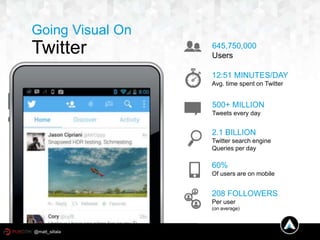
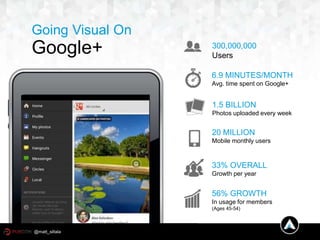

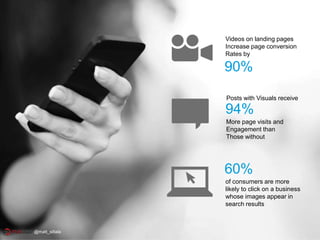


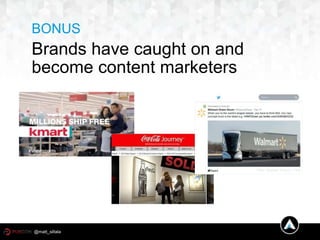

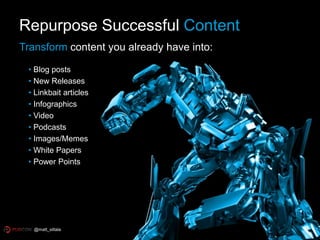
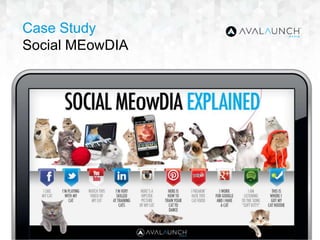
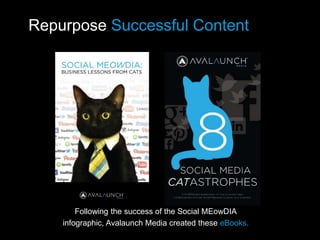
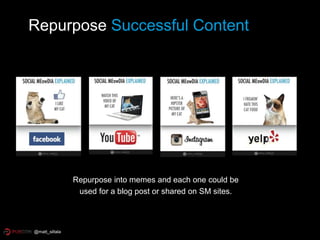
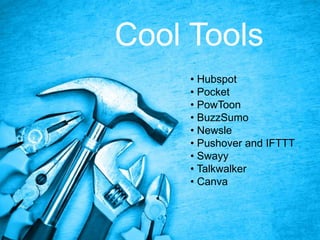
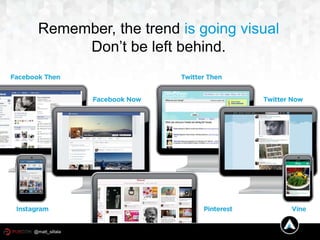


The document discusses the importance of visual content in marketing across various platforms like Instagram, Pinterest, Facebook, Twitter, and Google+. It highlights statistics on user engagement and the effectiveness of images and videos, emphasizing that images receive significantly more interaction and shares than other content types. Additionally, it provides insights into repurposing successful content and leveraging tools for enhancing visual content marketing strategies.


