Visual Analytics and the Language of Web Query Logs - A Terminology Perspective

This paper explores means to integrate natural language processing methods for terminology and entity identification in medical web session logs with visual analytics techniques. The aim of the study is to examine whether the vocabulary used in queries posted to a Swedish regional health web site can be assessed in a way that will enable a terminologist or medical data analysts to instantly identify new term candidates and their relations based on significant co-occurrence patterns. We provide an example application in order to illustrate how the co-occurrence relationships between medical and general entities occurring in such logs can be visualized, accessed and explored. To enable a visual exploration of the generated co-occurrence graphs, we employ a general purpose social network analysis tool, http://visone.info), that permits to visualize and analyze various types of graph structures. Our examples show that visual analytics based on co-occurrence analysis provides insights into the use of layman language in relation to established (professional) terminologies, which may help terminologists decide which terms to include in future terminologies. Increased understanding of the used querying language is also of interest in the context of public health web sites. The query results should reflect the intentions of the information seekers, who may express themselves in layman language that differs from the one used on the available web sites provided by medical professionals.

Recommended
Recommended
More Related Content
What's hot
What's hot (13)
Viewers also liked
Viewers also liked (18)
Similar to Visual Analytics and the Language of Web Query Logs - A Terminology Perspective
Similar to Visual Analytics and the Language of Web Query Logs - A Terminology Perspective (20)
More from Findwise
More from Findwise (20)
Recently uploaded
Recently uploaded (20)
Visual Analytics and the Language of Web Query Logs - A Terminology Perspective
- 1. Visual Analytics and the Language of Web Query Logs - A Terminology Perspective Daniela Oelke1, Ann-Marie Eklund2, Svetoslav Marinov3 and Dimitrios Kokkinakis2 1 Department of Computer and Information Science, University of Konstanz, Germany 2 Språkbanken, Department of Swedish Language, University of Gothenburg, Sweden 3 Findwise AB, Gothenburg, Sweden This paper explores means to integrate natural language processing methods for terminology and entity identification in medical web session logs with visual analytics techniques. The aim of the study is to examine whether the vocabulary used in queries posted to a Swedish regional health web site can be assessed in a way that will enable a terminologist or medical data analysts to instantly identify new term candidates and their relations based on significant co-occurrence patterns. We provide an example application in order to illustrate how the co-occurrence relationships between medical and general entities occurring in such logs can be visualized, accessed and explored. To enable a visual exploration of the generated co-occurrence graphs, we employ a general purpose social network analysis tool, visone (http://visone.info), that permits to visualize and analyze various types of graph structures. Our examples show that visual analytics based on co-occurrence analysis provides insights into the use of layman language in relation to established (professional) terminologies, which may help terminologists decide which terms to include in future terminologies. Increased understanding of the used querying language is also of interest in the context of public health web sites. The query results should reflect the intentions of the information seekers, who may express themselves in layman language that differs from the one used on the available web sites provided by medical professionals. Keywords: co-occurrence analysis, web search log, visual analytics, medical terminology 1. Introduction and Motivation This paper explores means to integrate natural language processing methods for terminology and entity identification in medical web session logs with visual analytics techniques. The aim of the study is to examine whether the use of the vocabulary in queries posted in a regional health web site can be assessed in a way that will enable a terminologist or medical data analysts to instantly identify new term candidates and their relations based on significant co- occurrence patterns. We provide an example application in order to illustrate how the co- occurrence relationships between medical and general entities occurring in such logs can be visualized, accessed and explored. There are several research questions that could be investigated based on such material. Some of the questions we address, and hope to come closer to answers for, are: “What are the most commonly searched terms and concepts, how are they contextualized, and what proportion can be captured by available comprehensive medical vocabularies?"; “Is it possible to rapidly identify meaningful and useful vocabulary patterns by the visual representation of the query content (terms, entities etc.)?" and “Can co- occurrence analysis with visual analytics lead to valuable outcomes with respect to vocabulary used, for instance do unexpected or potentially novel (concept) clusters emerge, such as administrative terms?". We believe that the answers to such questions will enable us to gain new insights into the language used in these logs, particularly the terminology and general vocabulary and even, to a certain degree, provide an indication of the search strategies applied by the users of the web site service from where the logs are obtained. Thus, our exploratory research findings can serve as background work that can be incorporated in search engines or other web-based applications to personalize search results, provide specific site recommendations and suggest more precise search terms, for example by the automatic identification of laymen/novices or domain experts; (cf. Ryen White et al., 2008). In the long run, we are also interested to aid our understanding of user’s search behavior and categorizing their information need(s) through the use of vocabulary patterns and interpret the knowledge that exists therein, therefore visual analytics techniques can be an important and effective mechanism for achieving these goals.
- 2. 2. Materials and Methods The data we use consists of the interaction log of the Swedish health web site <http://hitta.vgregion.se> (now part of the site 1177.se) covering almost fifteen months of data (June 2010 to September 2011). The site is the official health care portal of the Region Västra Götaland in western Sweden. As a major source for health information with more than 15,000 interactions per month it provides a unique insight into the health information seeking of the region’s 1.5 million inhabitants. Table 1 presents some statistics of the data. The corpus contains 230,754 interactions, that is pairs of queries and chosen results, grouped into sessions. A session contains the interactions of a user in a continuous window of searches, and thereby may cover several different information needs. There are 27,881 sessions, with most sessions (91%) consisting of only one query, Table 1 (left). By the distribution of sessions, Table 1 (middle) we can see that there seems to be more search sessions taking place during winter. The corpus contains 8,871 distinct queries, with most of them containing between one and three words, Table 1 (right). Table 1. Number of queries per session (left), distribution of session (middle) and words per Table 2. The 15 most common queries in the log- query (right) in the log-corpus. corpus. Table 2 shows the most common queries and in how many sessions they appear. Half of the most common queries are related to mostly practical issues, e.g., “my health care contacts” and “change of primary care giver”, while 41% concern health, e.g., “influenza” and “urinary tract infection”. The queries with the highest number of results are related to rehabilitation (8397), general therapeutics, e.g., treatments, (4579), laser (4194), health regulation, health legislation and patients' rights (3907) and pregnancy-related matters (3036). Considering the number of chosen results per query, for 8651 queries (28% of the searches) only one of the results is viewed, and this number is almost cut in half (15%) for viewing two results, and again for 3-4 views (each 7%). Results with rank 1 are the ones most often chosen (77 000, 33% of the views). Results ranked 1 to 5 each have between 77 000 and 12 000 views. From rank 6 no result has more than 6000 views. 2.1 Preprocessing and semantic analysis The only preprocessing and normalization steps performed to the data have been tokenization and the conversion of the queries into lower case. Manual analysis of resulted samples could only identify one case that seemed problematic with respect to the lower case conversion, namely the distinction between the acronym KOL or Kol i.e. chronic obstructive pulmonary
- 3. disease (Kroniskt Obstruktiv Lungsjukdom), and kol i.e. carbon. For the semantic analysis that followed we chose to keep the first sense, i.e. related to disease, which seemed to be the predominant in the data. However, future work would require to put more effort to the appropriate disambiguation of such cases. In order to understand the semantics of the queries, we automatically annotated them according to the ontology structure of SNOMED CT (the Systematized Nomenclature of Medicine Clinical Terms). SNOMED CT is the largest, most comprehensive compositional reference terminology in medicine developed to date, and since the logs originate from a health portal we thought that the SNOMED CT resource is a good starting point for the semantic analysis. According to the latest Swedish release of April 2011, SNOMED CT includes more than 275,000 concepts organized into 19 top-level hierarchies (e.g., disorder, procedure, morphological abnormality and substance). Since natural language exhibits many characteristics that make simple matching approaches (e.g., straightforward dictionary/database lookup) from the vocabulary to free text difficult (e.g., wide range of variation, alternative spelling), we also have developed methods to deal with language variability by using and combining various techniques such as stemming and approximate string matching; (cf. Kokkinakis & Gerdin, 2009). This is explicitly captured during processing, and illustrated using suitable coloring in Figures 1-3(a), by a mechanism that allows us to monitor whether: a matched text segment is taken directly from the vocabulary (marked as "original" and shown in red); is a recognized inflected variant (marked as "inflection" and shown in green); is a modified form (shown in light green); is a partial match, in case of a segment recognized in a compound (shown in purple) or whether it is a synonym found in other resources and incorporated into the SNOMED hierarchy or using more elaborated techniques (shown in blue). Furthermore, in order to identify the users’ information needs, we applied a named entity tagger (Kokkinakis, 2004) in order to also capture a wide range of entities often searched by in such logs such as addresses to health care centers and information about various health-related organizations. Specifically, we characterized the content of the queries in terms of four entity classes: location, organization, person and object (e.g., pharmaceutical products). 2.2 Term co-occurrences The assumption that our approach is based on is that most users that use the search engine intend to satisfy a specific information need. They will use the query terms that they believe describe best this information need. If the search result is not as expected, an alternative term is tried. This means that we can expect that most of the time several query terms are used in one session, the terms are semantically related. This observation can be used to derive knowledge about the relations between search terms from the data set. We use the following formula to determine if a co-occurrence is statistically significant: where Here, a and b is number of sessions containing term A resp. B and n is the total number of sessions. The formula was described in Heyer et al., (2008) and is based on a log-likelihood measure that follows (Dunning, 1993). The values are normalized with respect to the overall number of sessions. Before applying the formula, query terms that occur just once in the data set are filtered out because they do not allow to make valid conclusions. The intuition behind the formula is as follows: Given the independent frequencies of the two terms and the number of sessions in the corpus, we calculate how often we would expect the two terms to co-occur by chance. The formula measures how much the co-occurrence frequencies that we observe
- 4. deviate from this value and thus, how likely it is that the co-occurrences are not just coincidental. Note that statistical methods require a sufficiently large data set to get reliable results. The corpus that we use contains 27,881 sessions (23,464 sessions after removing the hapax legomena), whereof only 2,468 (2,020) sessions contain two or more search terms. Thus, the corpus must be considered as rather small. The fact that we still get meaningful results in the study confirms our assumption that most of the time users will use semantically related query terms and allows the conclusion that the data is not very noisy. Moreover, the used measure only permits to compare co-occurring terms (i.e. it provides a ranking) but does not classify term-pairs as being statistically significant or not. We thus need to set a threshold which is determined manually by inspecting the resulting co-occurrence graphs. The threshold chosen for this study was 0.7. 3. Visual Analytics Visual Analytics is "the science of analytical reasoning facilitated by visual interactive interfaces" Thomas & Cook (2005). By tightly integrating the human expert and the machine, the strengths of both can be leveraged in the analysis process. This is especially important if it is not (yet) possible to solve a task fully automatically or if background knowledge of an expert is required that cannot be modeled computationally. By allowing the analyst to interactively explore the data, the black box of an automatic algorithm can be broken up and opened for inspection by an expert. Often the tuning of an algorithm requires multiple steps of adaption until a task can be solved fully computationally with reliable results. Visual Analytics techniques provide domain experts with the necessary insight into the data and the algorithm and therefore ease this process. To enable a visual exploration of the generated co- occurrence graphs, we employ the tool visone (Brandes & Wagner, 2003) in this work. Visone is a tool for social network analysis that permits to visualize and analyze graph structures. By means of the build-in interaction facilities, it becomes possible to adapt the graph to the needs of the analysis task and map additional meta data to the color, size or labels of its nodes and edges. Furthermore, users can choose between different graph layouts and graph analysis methods such as different centrality measures. The tool is publicly available from: <http://visone.info>. 4. Results and Discussion Co-occurrence analysis is an important technique with a long-standing tradition in many natural language processing research areas e.g., used to identify semantic relations, such as similarity between terms (Rijsbergen 1997; Veling & van der Weerd 1999; Navigli et al., 2011). During recent years graph-based visual representation and exploration of co- occurrence statistics e.g., between terms and/or shared metadata, is seen as an attractive and effective way to better understand and compare large amounts of data for revealing salient topics, relationships (events or associations between terms; Madani & Yu, 2010) or the like. Figure 1 shows a visual representation of the calculated co-occurrence graphs. Each node in the graph represents one term and two nodes are connected if their terms co-occur significantly (see Section 2.2). A node is colored if the term it represents was found in the SNOMED CT terminology (see Section 2.1). See Figure 2(b) for a color legend. Furthermore, the size of the nodes is mapped to the overall frequency of the term in the dataset. The more frequent a term is, the larger is the node that represents it.
- 5. Figure 1. Co-occurrence graphs from the query logs. Here, the node size is equal to term frequency, while the coloring differentiates between the way terminology is recognized, for instance original terms are marked in red and partial matches in purple (see the color legend in Figure 2 right). Apparently, a much larger number of simple relations (only two nodes connected) than complex term relationships were found by the algorithm. Furthermore, it is interesting to see that there are big differences with respect to the term frequencies and that only a part of the (potential) terms can be found in the SNOMED CT terminology. The fact that most subgraphs contain both terms that are part of the medical terminology and others that are not is both interesting and promising as it suggests that we indeed might be able to defer new knowledge from such co-occurrence graphs by analyzing the relationship between the nodes further. In the following some of the more complex subgraphs are inspected in detail. In the following we inspect some of the subgraphs of Figure 1 in more detail. Figure 2 (left) represents an example of how visual analytics may help to identify and analyze the use of different objects with a common theme. In this case we have six different types of laboratory procedures (rutinprov). Moreover, by the size of the nodes we see that endoscopy (endoskopi) is the most commonly searched procedure. The figure also shows how
- 6. abbreviations may be connected to a semantic type, for instance that ECG (ekg) is a type of laboratory procedure. Figure 2. Analysis of semantic types. Figure 2 (right) presents how visual analytics can be used to identify relations between semantic types in a specific context, for instance relating diseases, treatments and other related topics. In this case we have the relations between myocardial infarction (hjärtinfarkt), angina pectoris (kärlkramp), pharmaceuticals like Seloken and the tool balloon (ballong) used in the treatment of certain heart disease. The term Varan (another term for the blood thinner Warfarin) is not in the terminology, thereby raising the question of what is and should be part of a terminology. In this case the used expression is a Swedish “translation” of Waran, which in turn is a “layman” name for Warfarin. The visualization provides insight into the use of terms and therefore enables terminologists to reason about how to form terminologies. Interestingly, the figure shows more edges among treatments than between diseases and treatment, which can be seen as an indication that searchers already know about the use of the treatments and medication procedures but want to know more about the differences and commonalities among different treatments. Figure 3. Co-occurrence graphs showing common concepts. Left, stomach flu and right a heart attack-cluster. Figure 3(left) illustrates how visual analytics may also help to identify different terms used to denote a common concept, for instance different ways to express an interest in stomach flu (kräksjuka, maginfluensa, magsjuka). The most common term is the most general name for the disease (magsjuka) and the second most common is the term for winter vomiting disease (vinterkräksjuka). This type of information can be useful for terminologists to identify different terms that may be used by searchers to denote a topic, even though the terms formally denote different medical concepts. For instance, winter vomiting disease may be used as a search term even in cases when stomach flu in general is of interest.
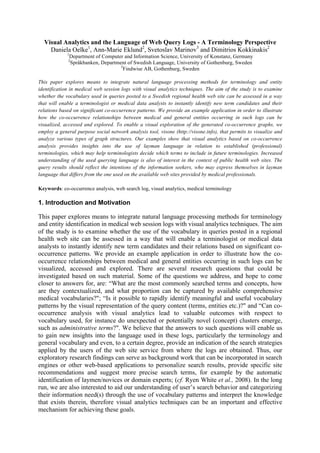
- 7. Figure 3 (right) shows a heart attack cluster. Here the node size illustrates the frequency of the term while the coloring illustrates whether the term is actually already in the terminology (blue) or not (grey). The red edge color connects two terms that are in the terminology, the green two terms where one is in and one is not, and the grey edge color indicates that both terms are not in the terminology. Finally, Figure 4 shows co-occurrence graphs for which none of the nodes is colored (left) because none of the terms was found in the terminology. Very few are colored on the graph to the right, mainly because a part of a location name is also a term in SNOMED CT. When inspected in detail and colored according to an entity class (here: location), it becomes apparent that this graph connects different queries for health care providers. This information could help to compile a terminological resource with e.g., various types of administrative terms in the future. Figure 4. Co-occurrence graphs showing location clusters. 5. Conclusions In this paper we illustrated how visual analytics in the context of web query logs provides e.g., terminologists with a user-friendly environment to address questions regarding search term usage. As shown by our examples, visual analytics based on co-occurrence analysis provides insights into the use of layman language in relation to established (professional) terminologies. This may help terminologists decide which terms to include in future terminologies, but also to understand the used querying language. The analysis also highlights relations like synonyms and other semantic relations that further describe search patterns and language used when querying web sites. These aspects are of particular interest in the context of public health web sites, where the query results should reflect as close as possible the intentions of the information seekers, who may express themselves in layman language that differs from the one used on the available web sites provided by medical professionals or from the terms used to actually index the web sites.
- 8. References Brandes, U. and Wagner, D. 2003. Visone – Analysis and Visualization of Social Networks. Graph Drawing Software. Pp. 321–340. Springer-Verlag. Dunning, T. 1993. Accurate Methods for the Statistics of Surprise and Coincidence. Journal of Computational Linguistics. 19:61–74. Heyer, G., Quasthoff, U. and Wittig, T. 2008. Text Mining: Wissensrohstoff Text - Konzepte, Algorithmen, Ergebnisse. W3L-Verlag. Kokkinakis D. 2004. Reducing the Effect of Name Explosion. In Proceedings of the LREC Workshop: Beyond Named Entity Recognition, Semantic Labelling for NLP tasks. Fourth Language Resources and Evaluation Conference (LREC). Pp. 1-6. Lisbon, Portugal. Kokkinakis, D. and Gerdin, U. 2009. Issues on Quality Assessment of SNOMED CT Subsets – Term Validation and Term Extraction. In Proceedings of the RANLP Workshop: Biomedical Information Extraction. Borovets, Bulgaria. Madani, O. and Yu, J. 2010. Discovery of Numerous Specific Topics via Term Co- occurrence Analysis. In Proceedings of the Conference on Information and Knowledge Management (CIKM). ACM New York, NY, USA Navigli, R., Velardi, P. and Faralli, S. 2011. A Graph-based Algorithm for Inducing Lexical Taxonomies from Scratch. In Proceedings of the 22nd International Joint Conference on Artificial Intelligence (IJCAI). Pp. 1872–1877, Barcelona, Spain. Rijsbergen, C. 1977. A Theoretical Basis For The Use Of Co-Occurrence Data In Information Retrieval. Journal of Documentation, 33:106–119. Ryen White, W., Dumais, S. and Teevan, J. 2008. How Medical Expertise Influences Web Search Interaction. In Proceedings of the 31st ACM SIGIR Conference on Research and Development in Information Retrieval. New York, NY, USA. Thomas, J.J. and Cook, K.A. 2005. Illuminating the Path: The Research and Development Agenda for Visual Analytics. National Visualization and Analytics Ctr. Veling, A. and van der Weerd, P. 1999. Conceptual Grouping in Word Co-occurrence Networks. In Proceedings of the 16th International Joint Conference on Artificial intelligence (IJCAI). Morgan Kaufmann, San Francisco, CA, USA.