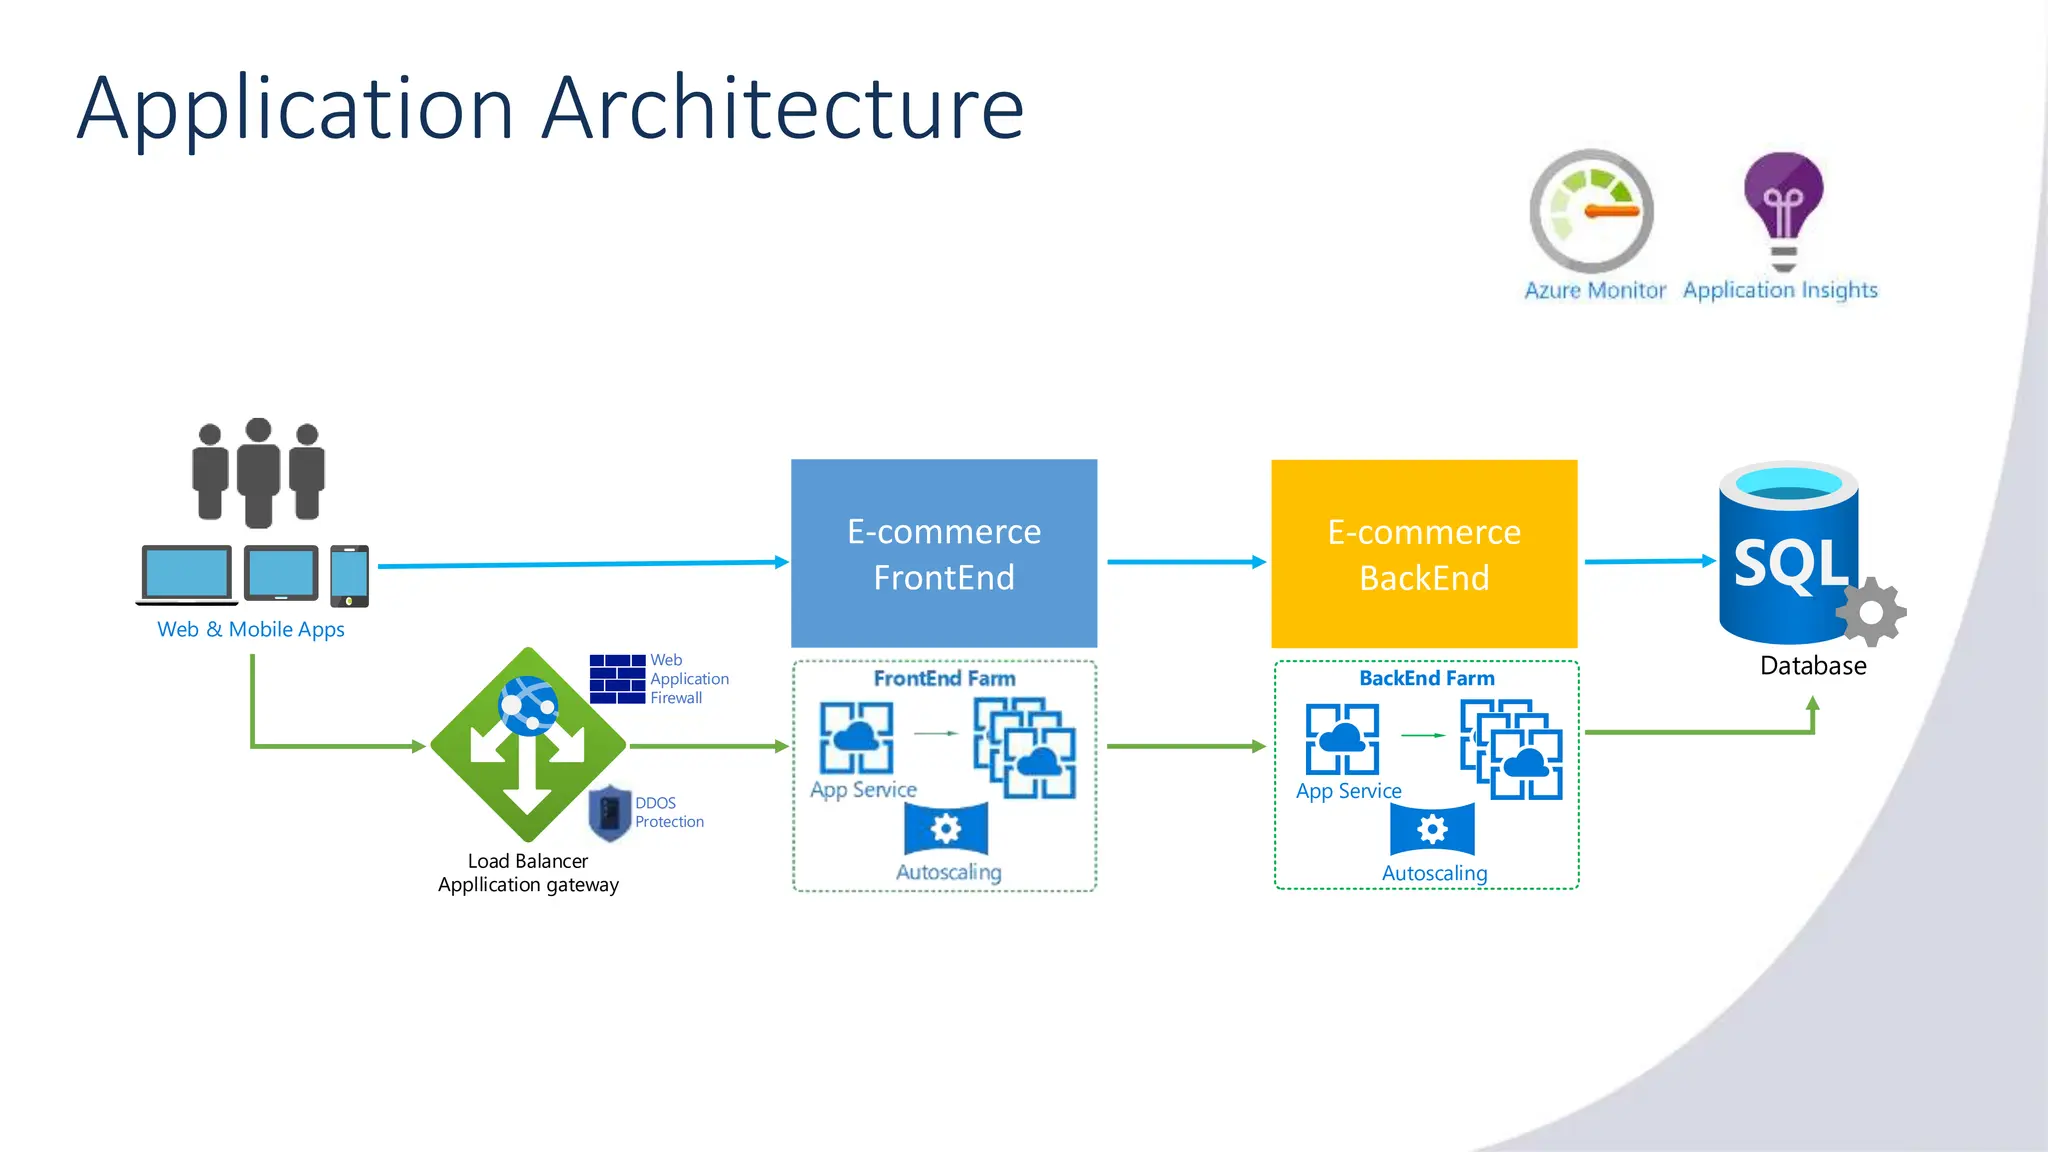
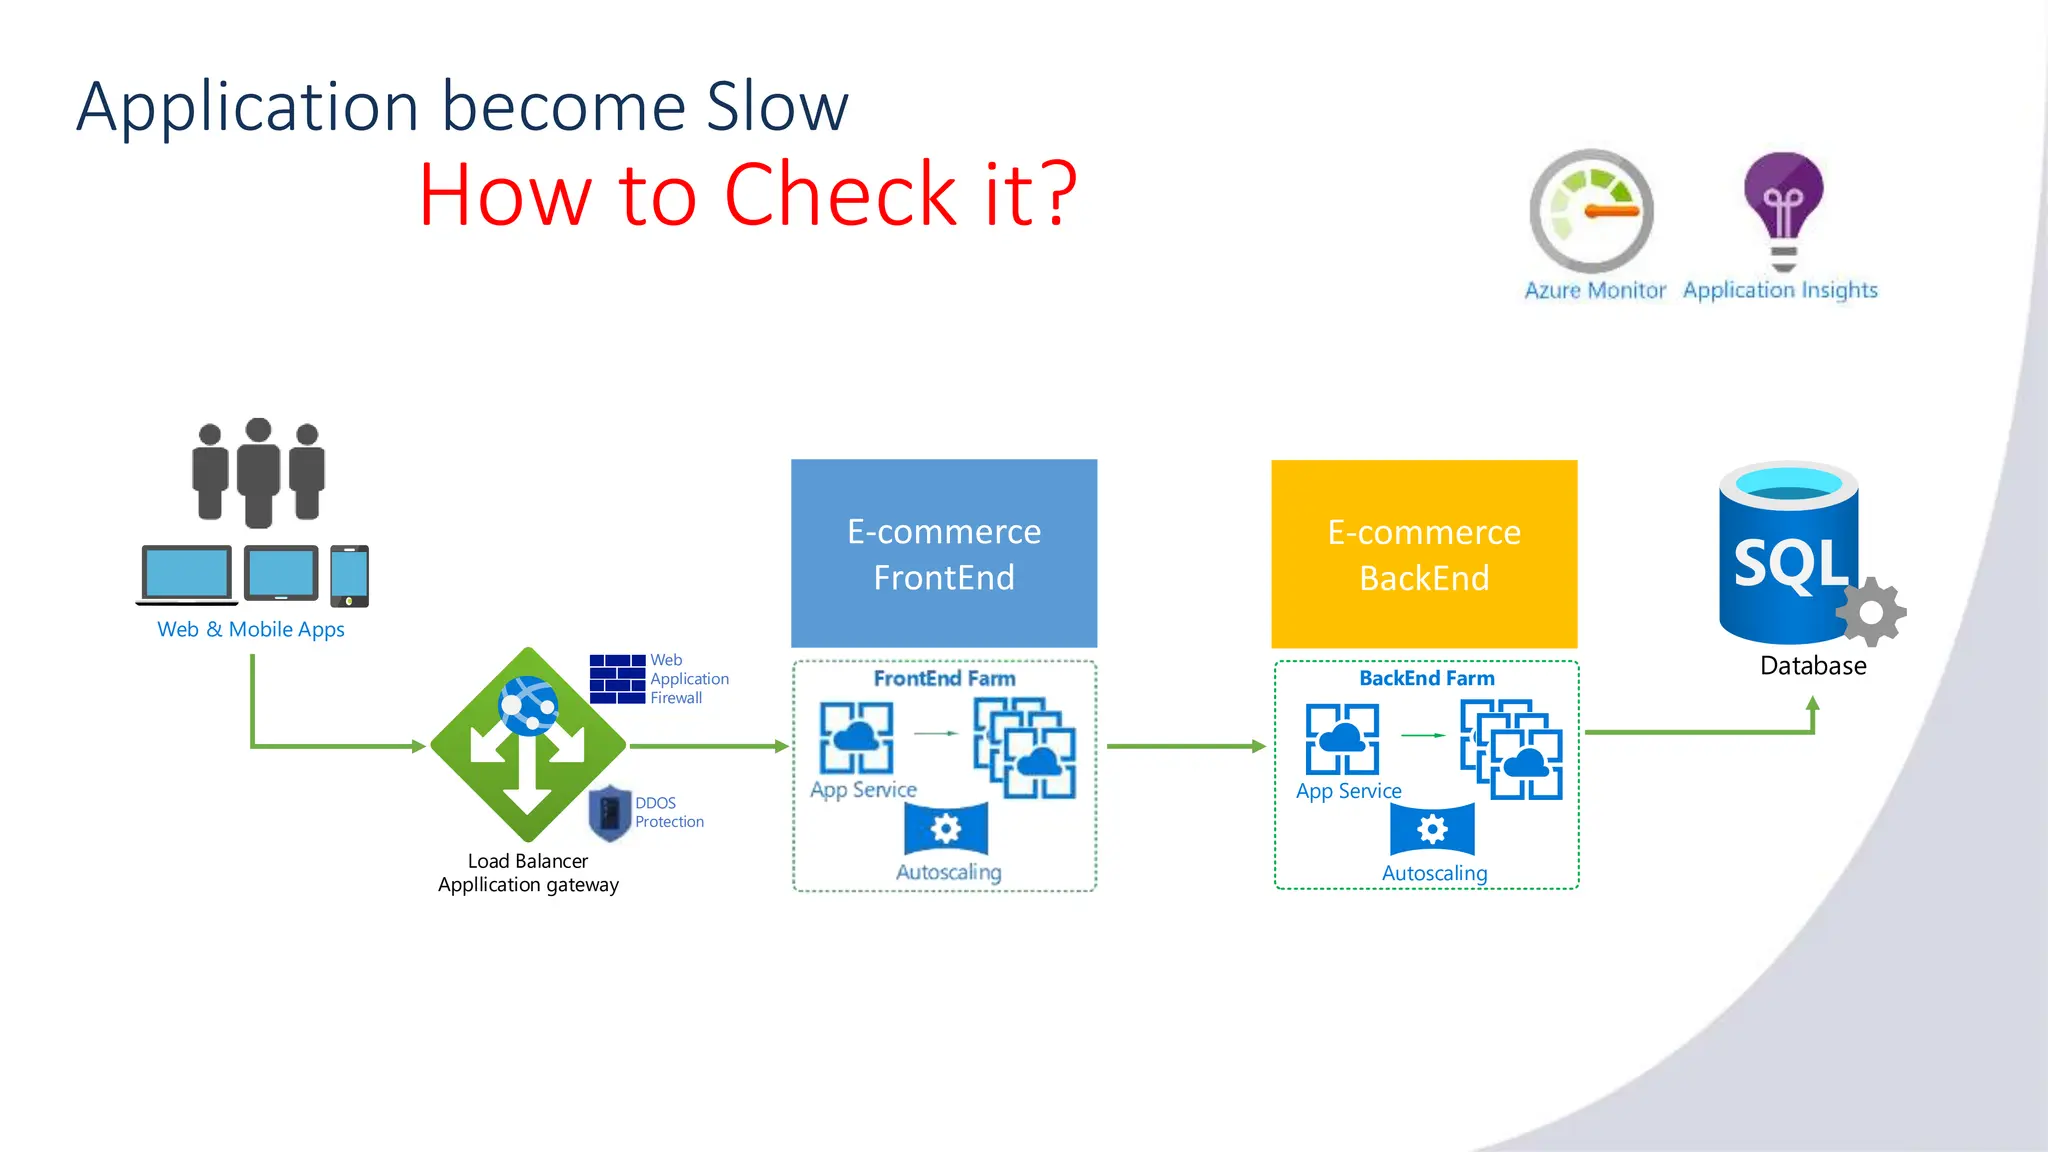
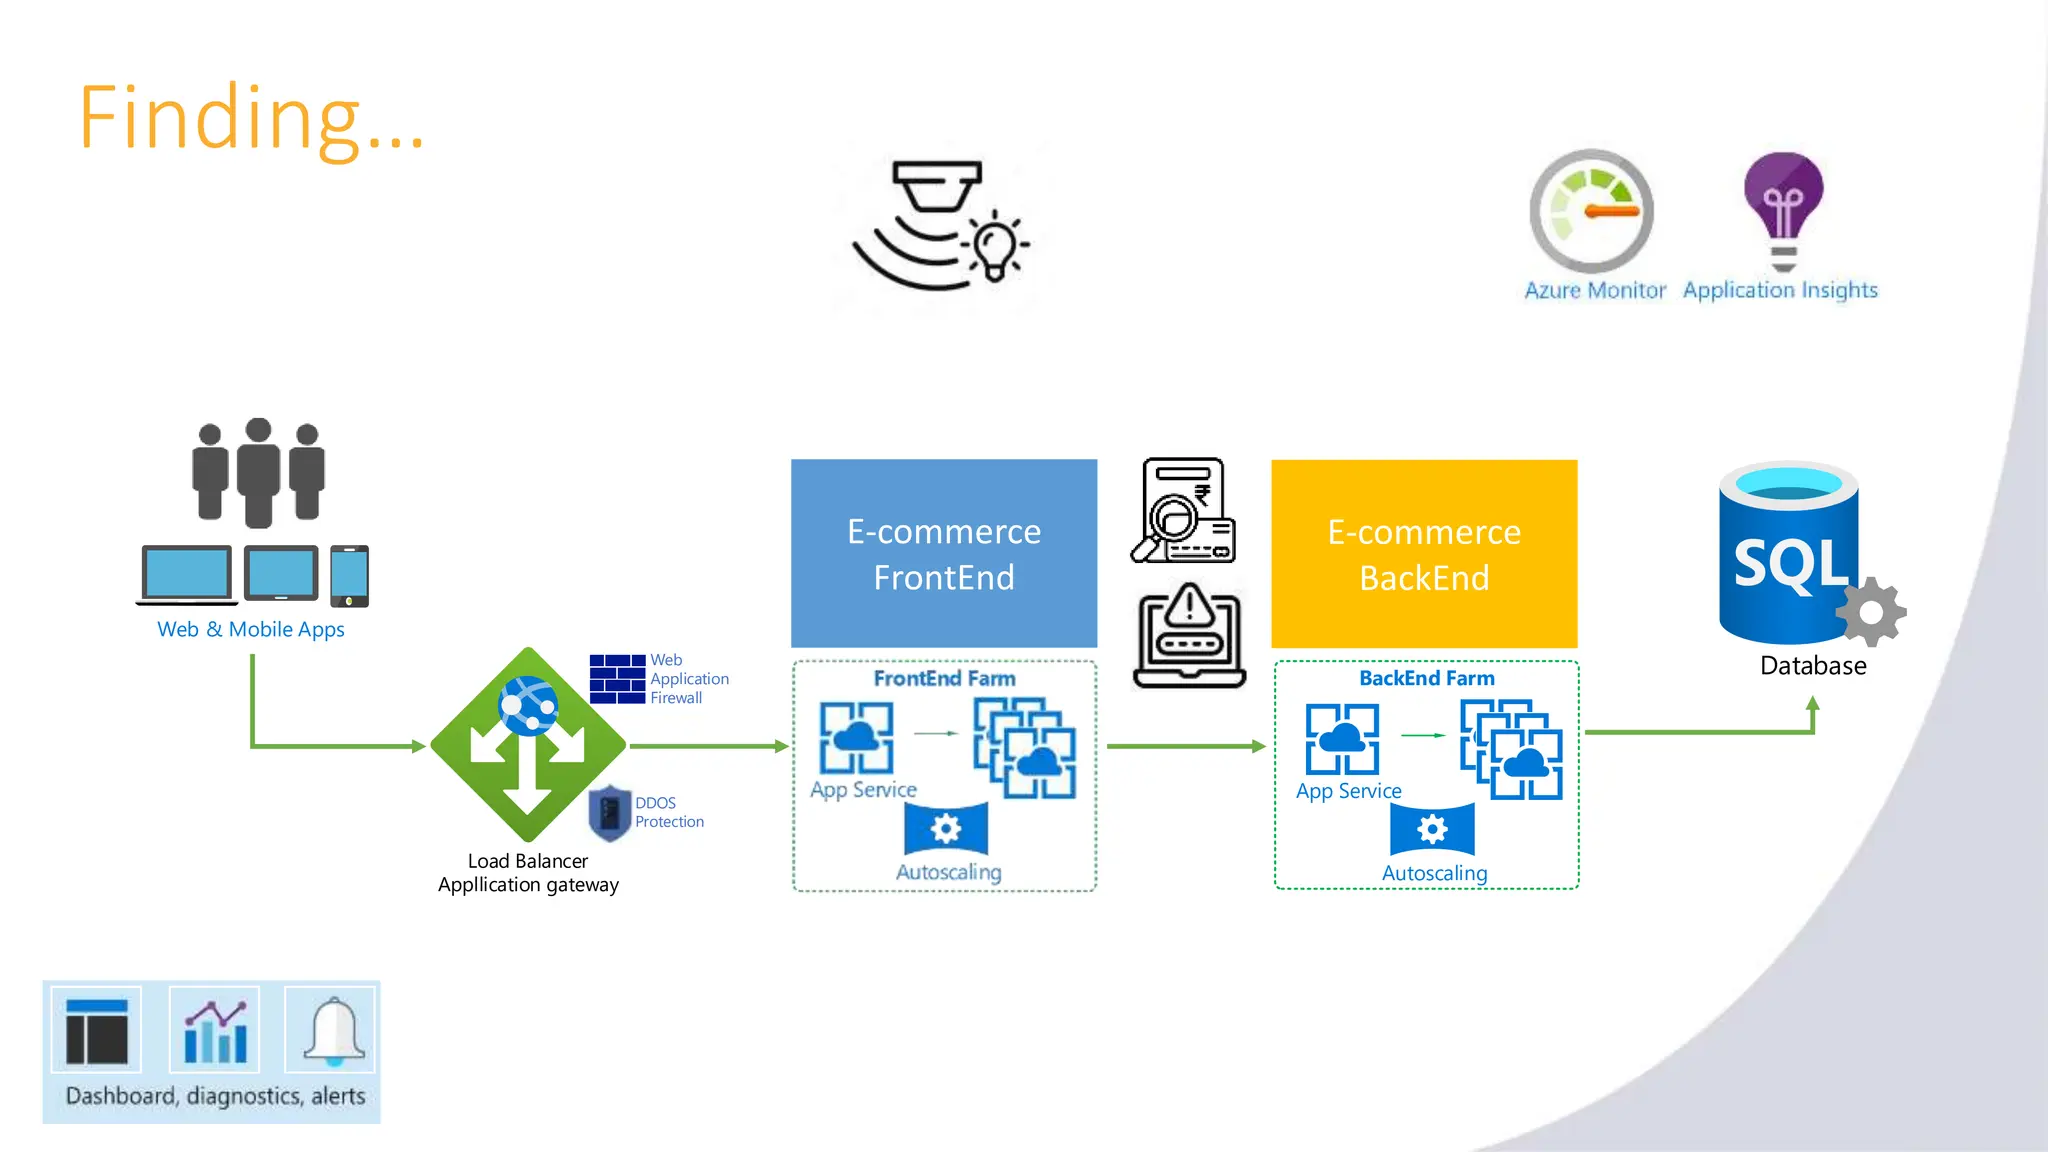
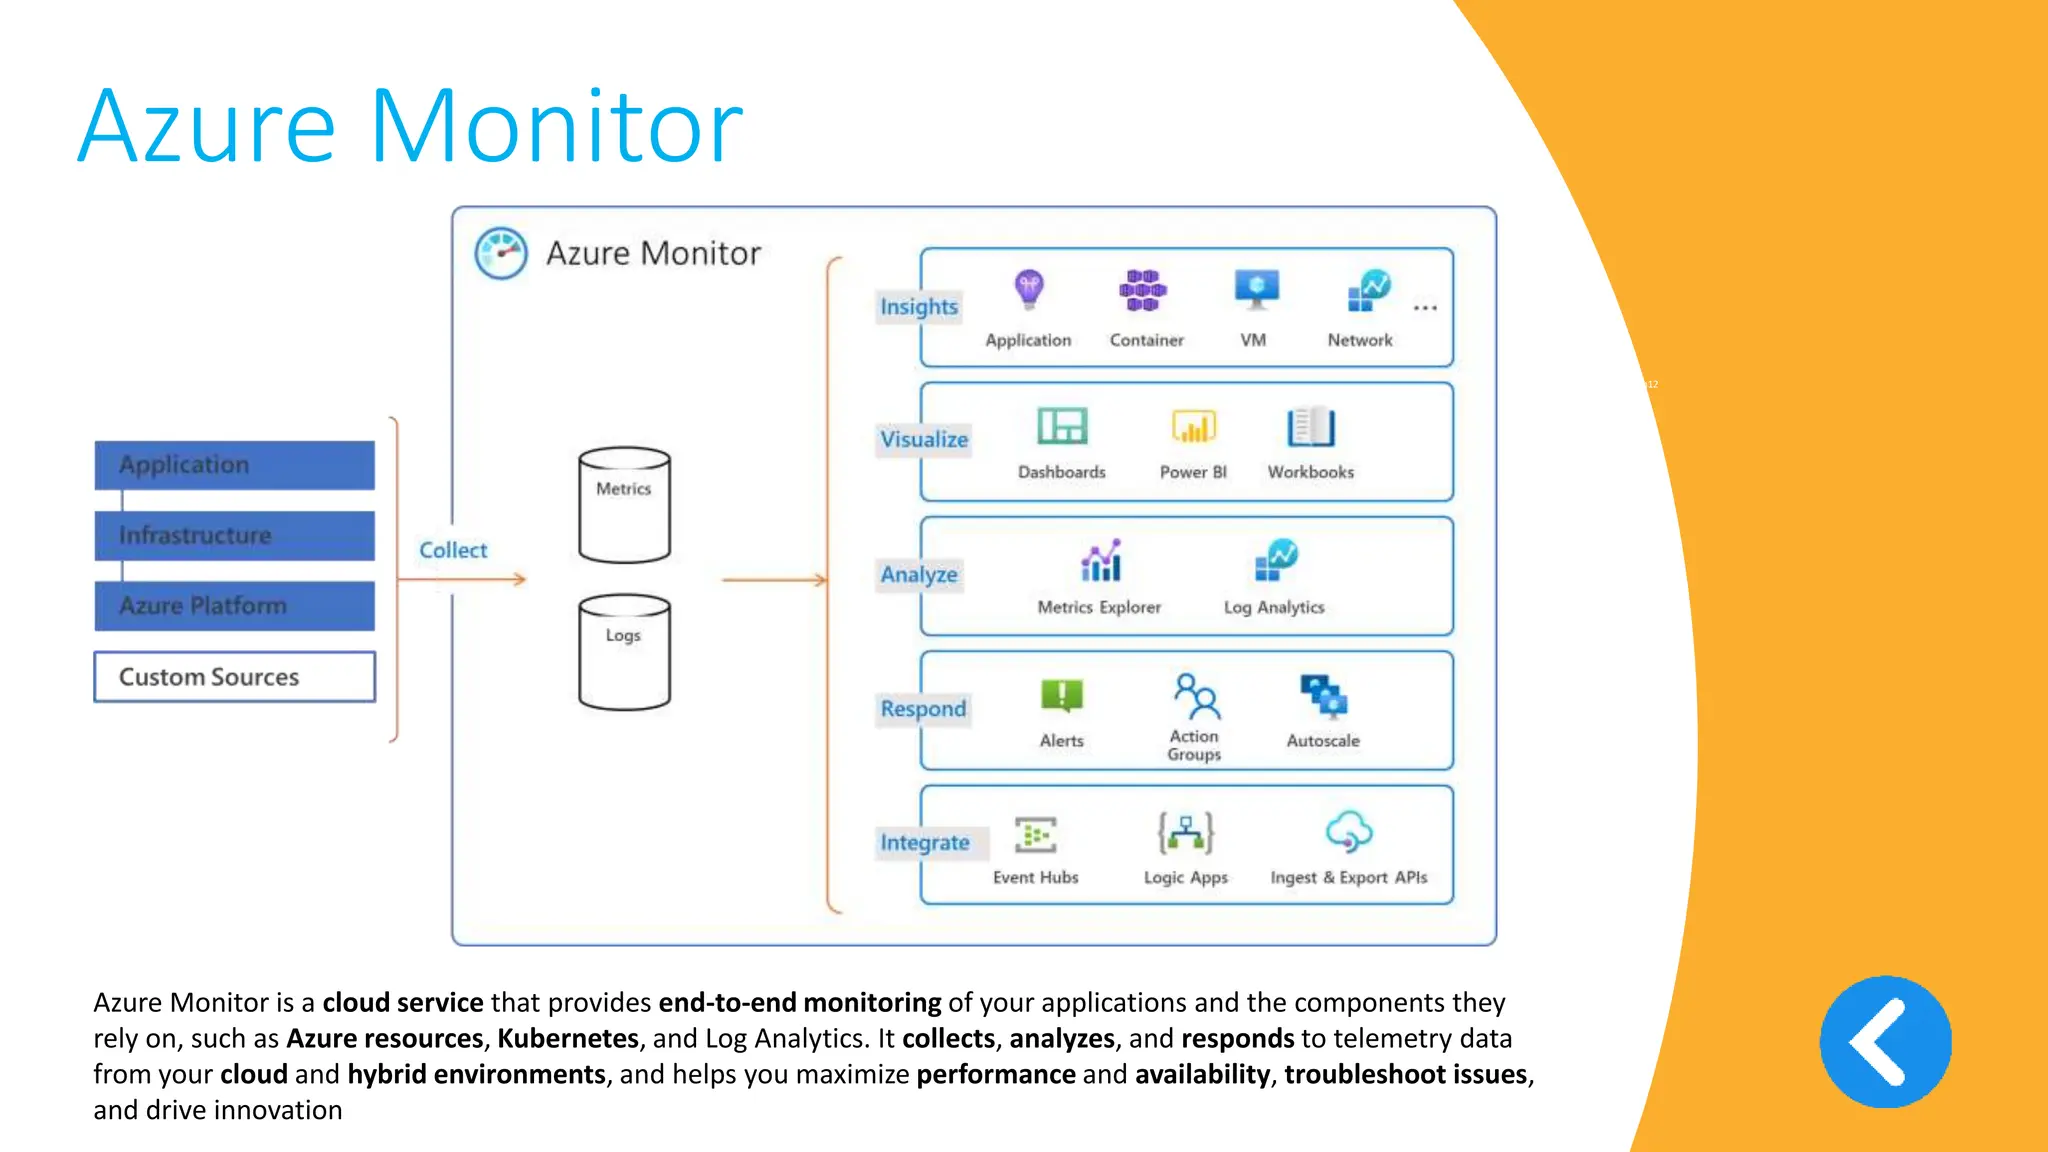
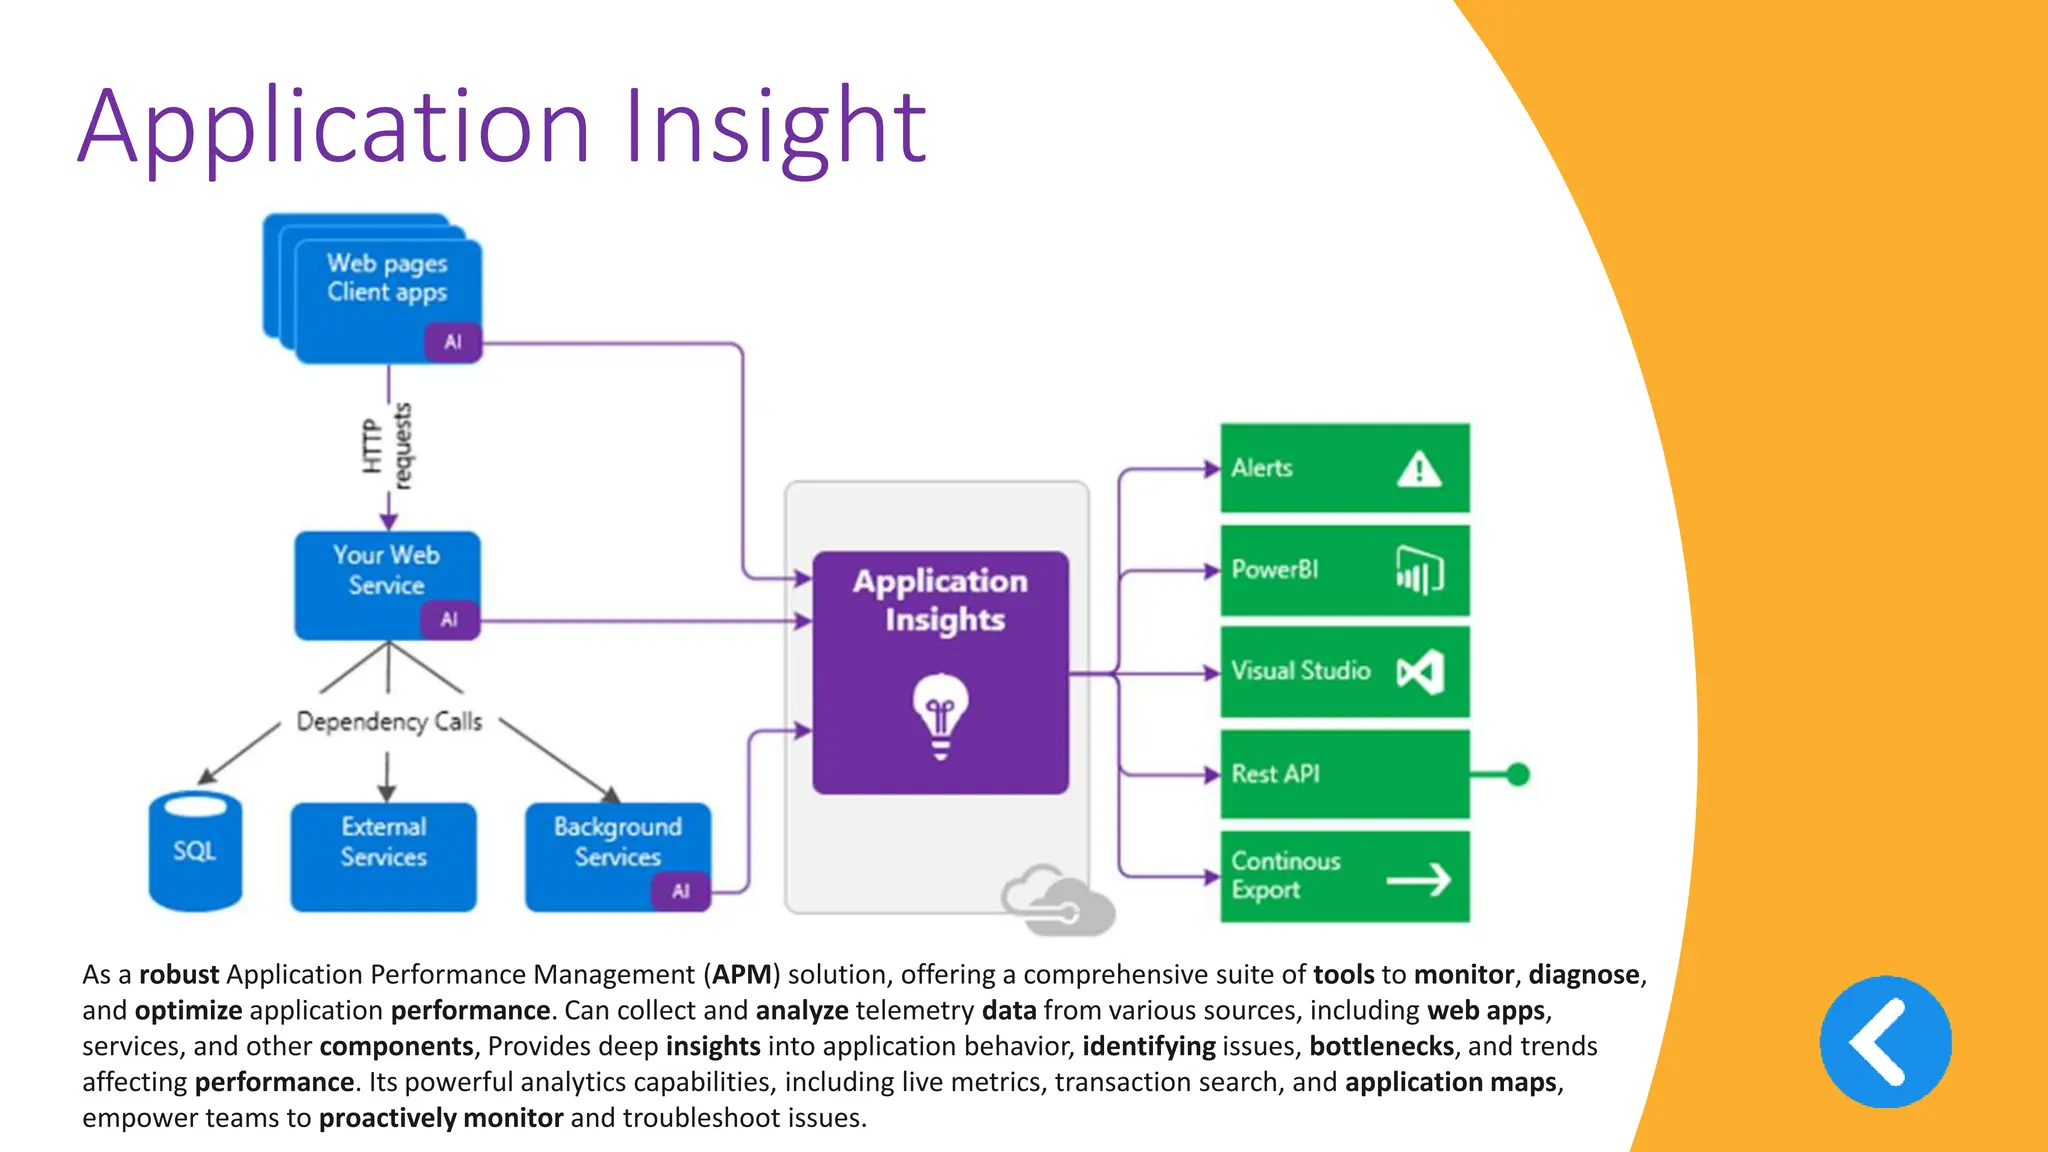
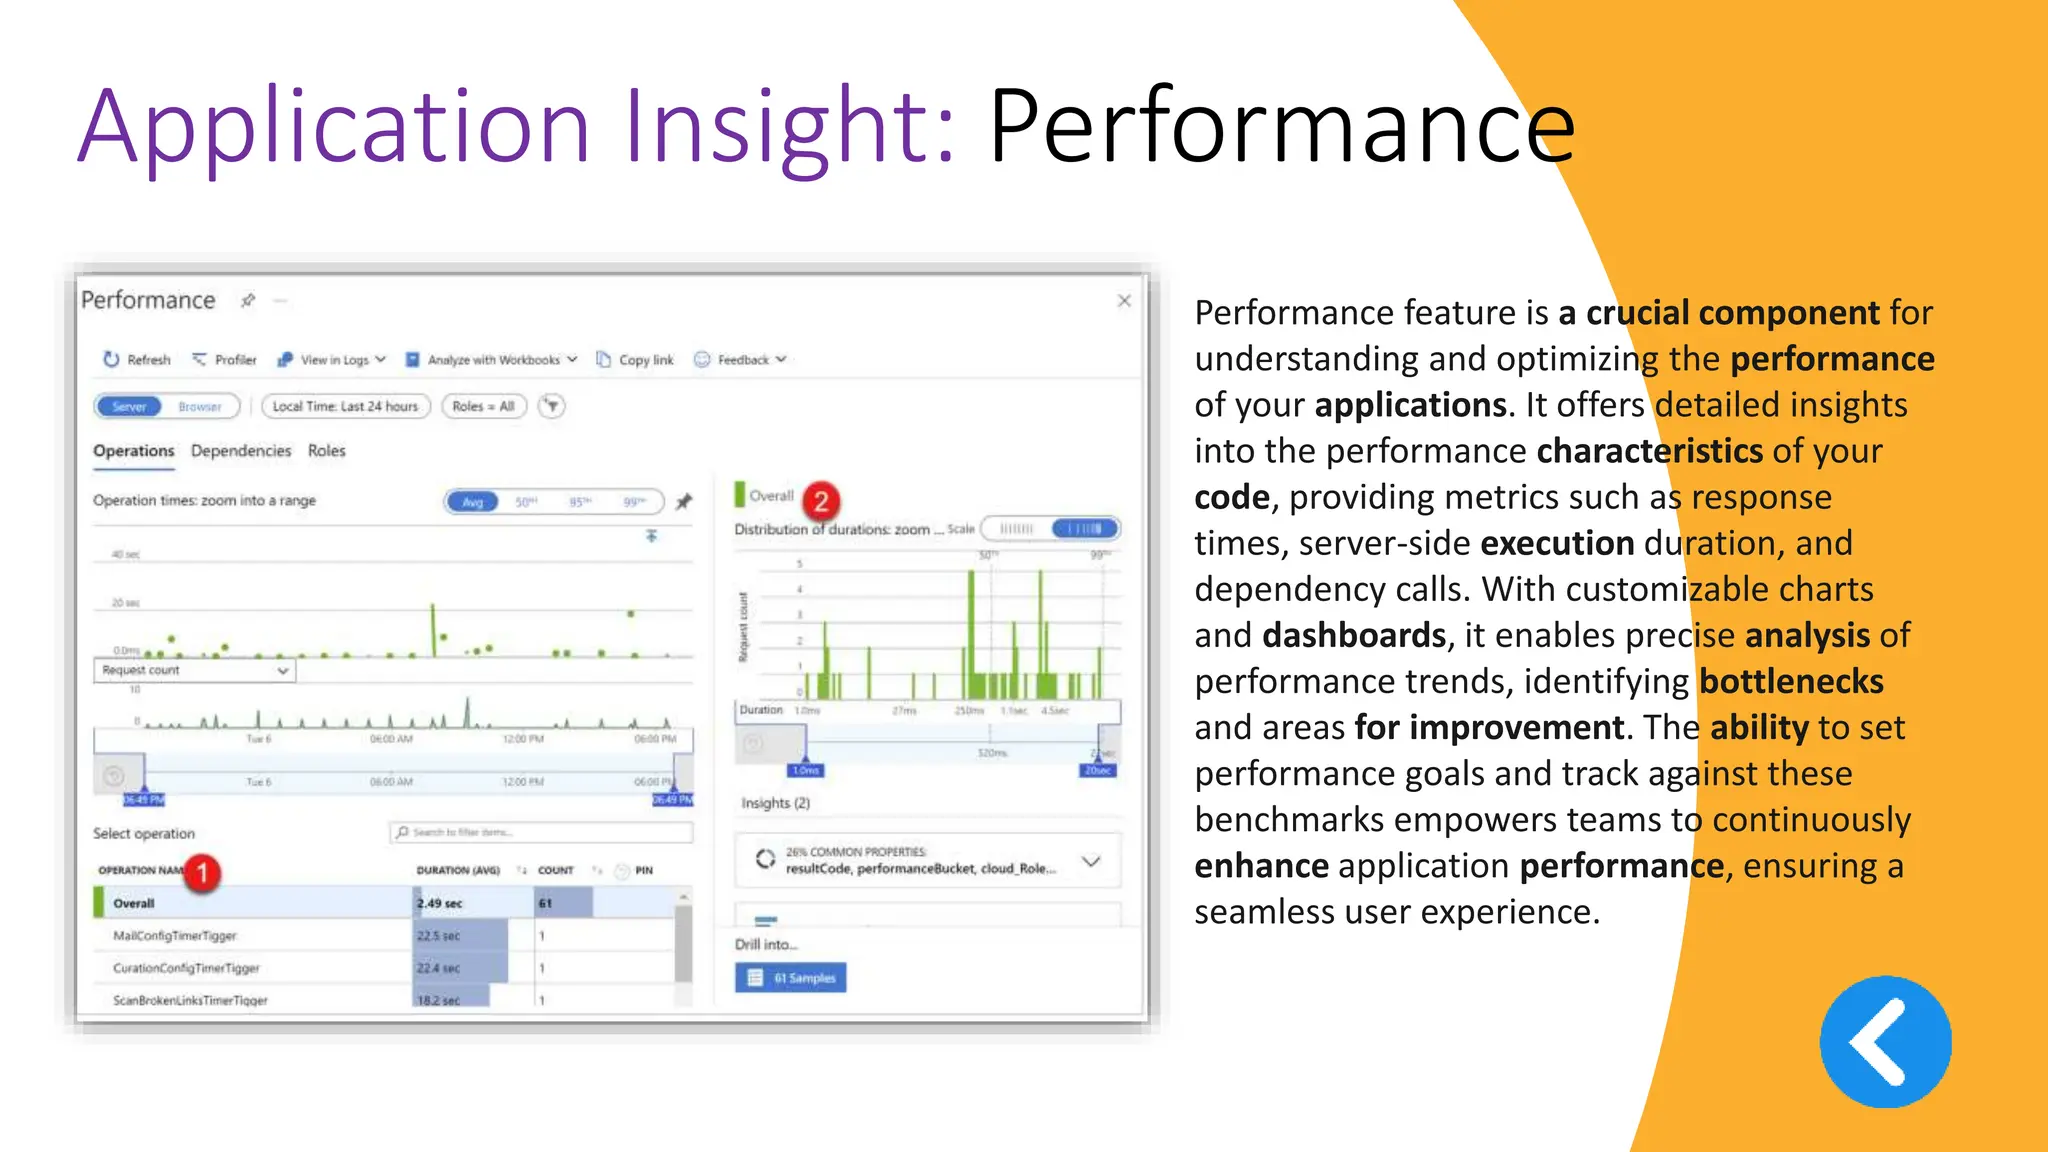
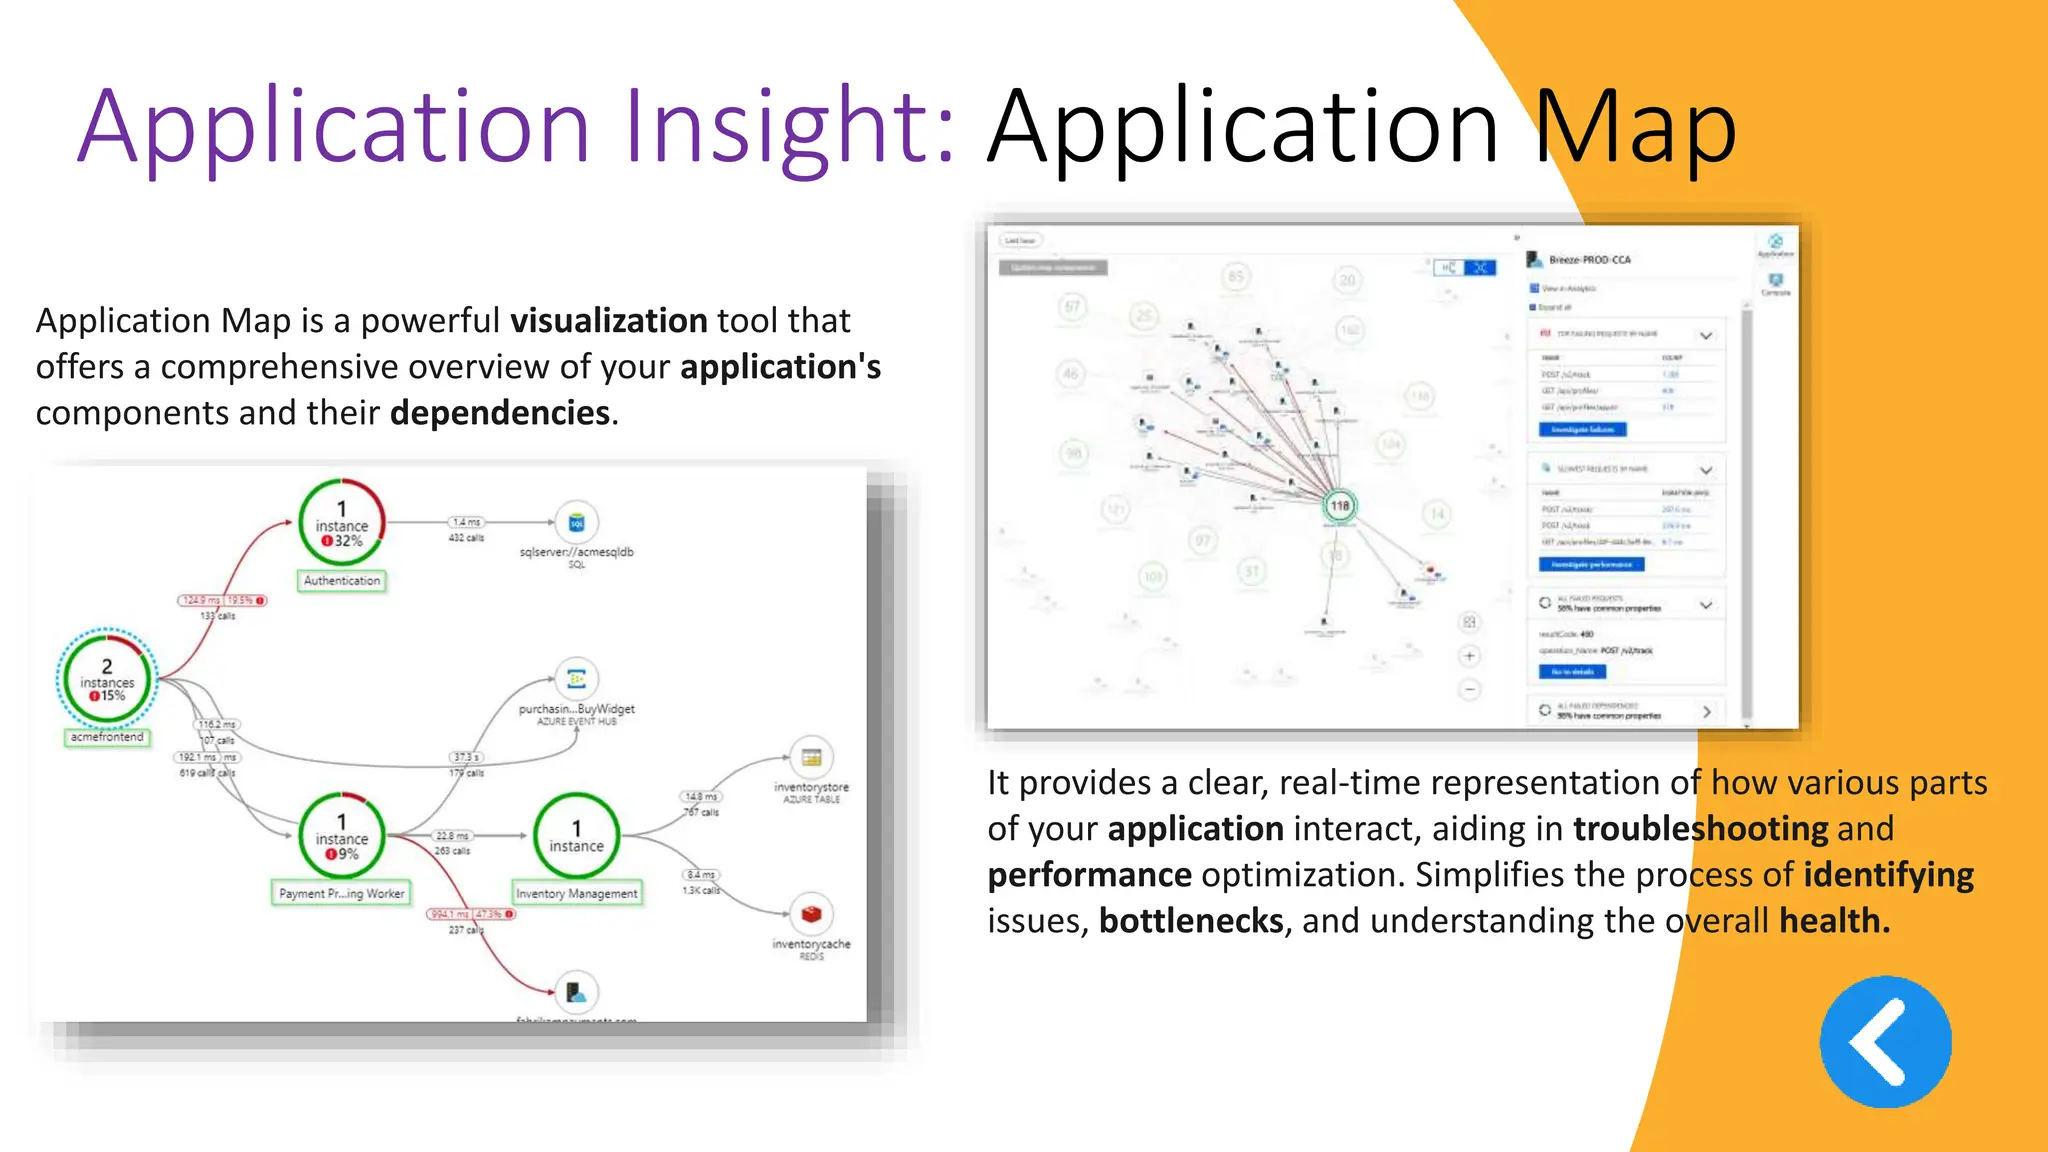
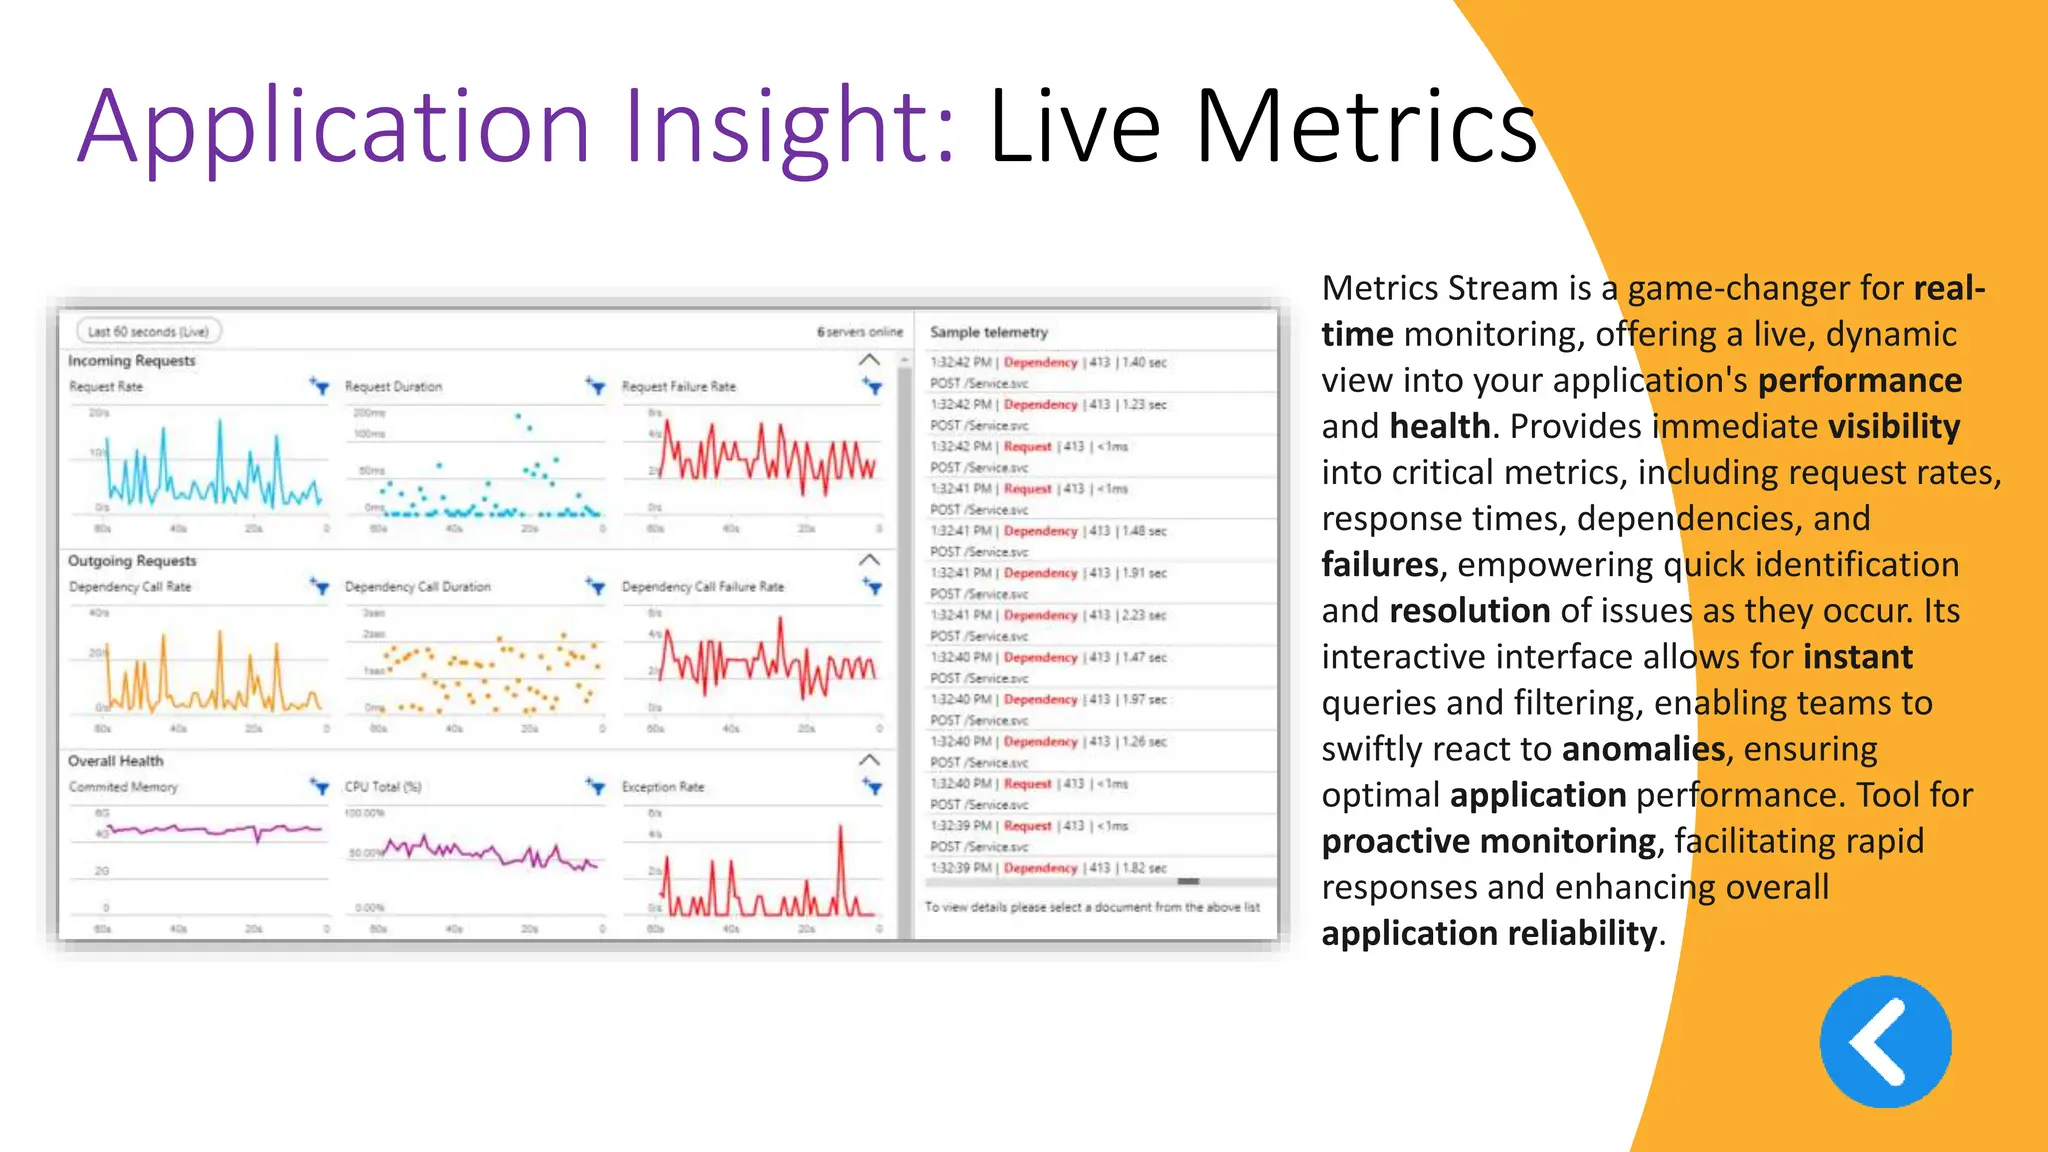
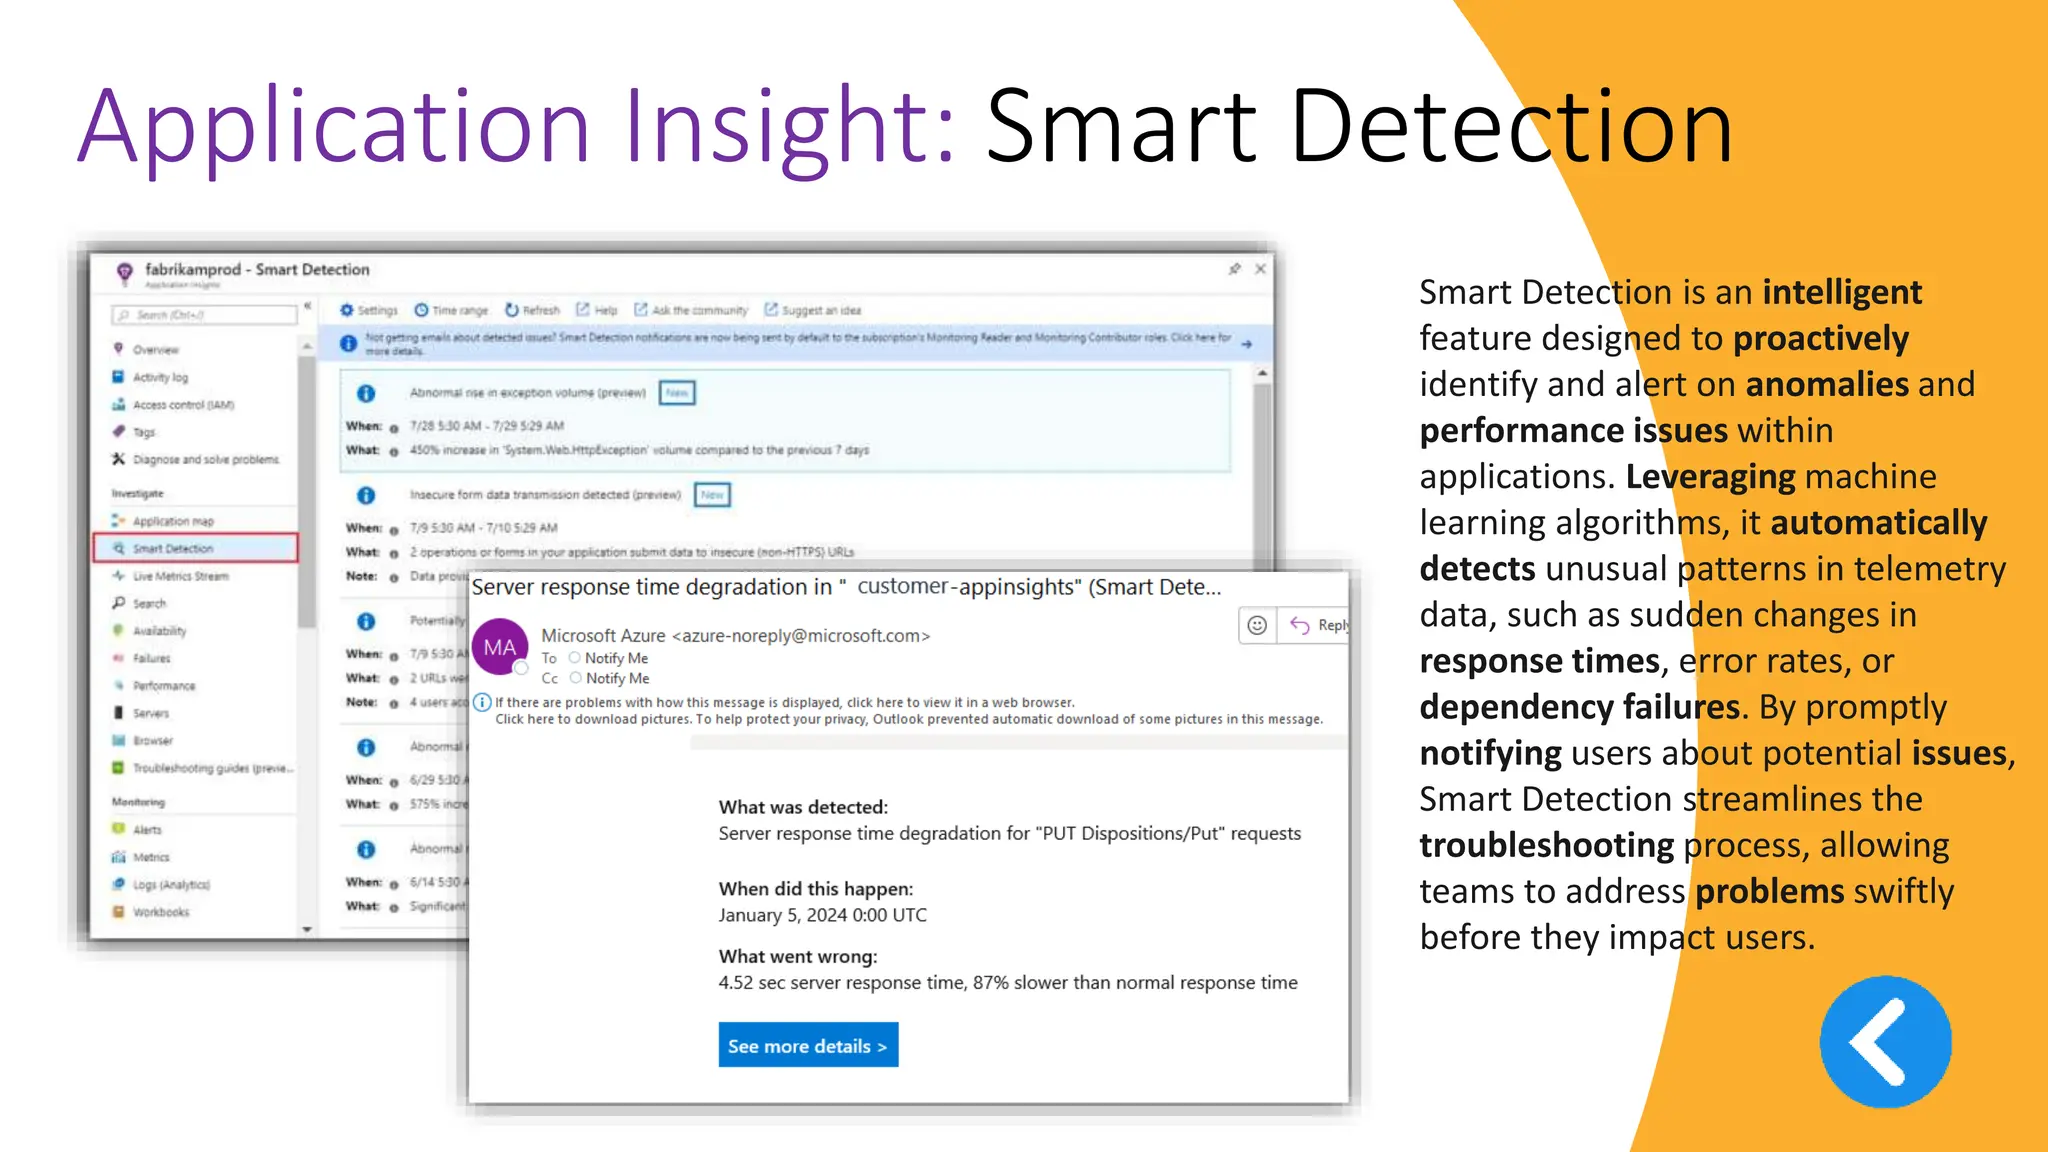
vv
Monitoring your Application with
Application Insight and Azure
Monitor
Presented by andik@ysi.co.id
Database
Web & Mobile Apps
E-commerce
FrontEnd
E-commerce
BackEnd
Application Architecture
Database
Web & Mobile Apps
E-commerce
FrontEnd
E-commerce
BackEnd
Application Architecture
BackEnd Farm
App Service
Autoscaling
Web
Application
Firewall
DDOS
Protection
Load Balancer
Appllication gateway
Database
Web & Mobile Apps
E-commerce
FrontEnd
E-commerce
BackEnd
Application Architecture
BackEnd Farm
App Service
Autoscaling
Web
Application
Firewall
DDOS
Protection
Load Balancer
Appllication gateway
Database
Web & Mobile Apps
E-commerce
FrontEnd
E-commerce
BackEnd
Application become Slow
BackEnd Farm
App Service
Autoscaling
Web
Application
Firewall
DDOS
Protection
Load Balancer
Appllication gateway
How to Check it?
Database
Web & Mobile Apps
E-commerce
FrontEnd
E-commerce
BackEnd
Finding…
BackEnd Farm
App Service
Autoscaling
Web
Application
Firewall
DDOS
Protection
Load Balancer
Appllication gateway
Azure Monitor is a cloud service that provides end-to-end monitoringof your applications and the components they rely on, such as Azure resources, Kubernetes, and Log Analytics. It collects, analyzes, and responds to telemetrydata from your cloud and hybrid environments, and helps you maximizeperformanceand availability,troubleshoot issues, and drive innovation12
Learn more
1
learn.microsoft.com
2
azure.microsoft.com
3
azure.microsoft.com
+1 more
Answer from the web instead
How do I set up Azure Monitor?
What types of data can be monitored with Azure Monitor?
Can I use Azure Monitor for security monitoring?
Your personal and company data are protected
Response stopped
New topic
Ask me anything...
0/4000
Azure Monitor
Azure Monitor is a cloud service that provides end-to-end monitoring of your applications and the components they
rely on, such as Azure resources, Kubernetes, and Log Analytics. It collects, analyzes, and responds to telemetry data
from your cloud and hybrid environments, and helps you maximize performance and availability, troubleshoot issues,
and drive innovation
v
Application Insight
As a robust Application Performance Management (APM) solution, offering a comprehensive suite of tools to monitor, diagnose,
and optimize application performance. Can collect and analyze telemetry data from various sources, including web apps,
services, and other components, Provides deep insights into application behavior, identifying issues, bottlenecks, and trends
affecting performance. Its powerful analytics capabilities, including live metrics, transaction search, and application maps,
empower teams to proactively monitor and troubleshoot issues.
v
Azure Monitor Scenario
Correlate issues at infra level with insights
for VMs, containers, SQL, network, etc.
Operationalize at scale with smart
alerts and automated actions
Detect & diagnose issues across apps and
dependencies with application insights
Drill down with log analytics for
troubleshooting & deeper diagnostics
Create visualizations with Azure
dashboards & workbooks
v
Azure Monitor: Alert Alert feature is a crucial component
for proactive monitoring. It allows
users to set up customized alerts
based on defined metrics, thresholds,
or specific conditions, triggering
notifications when anomalies or
predefined criteria are met. This
capability ensures immediate
awareness of critical issues or
performance deviations, enabling
swift action to address potential
problems before they impact users.
With its flexible configuration options
and integration with various
communication channels, including
emails, SMS, or third-party tools.
v
Application Insight: Performance
Performance feature is a crucial component for
understanding and optimizing the performance
of your applications. It offers detailed insights
into the performance characteristics of your
code, providing metrics such as response
times, server-side execution duration, and
dependency calls. With customizable charts
and dashboards, it enables precise analysis of
performance trends, identifying bottlenecks
and areas for improvement. The ability to set
performance goals and track against these
benchmarks empowers teams to continuously
enhance application performance, ensuring a
seamless user experience.
v
Application Insight: Application Map
Application Map is a powerful visualization tool that
offers a comprehensive overview of your application's
components and their dependencies.
It provides a clear, real-time representation of how various parts
of your application interact, aiding in troubleshooting and
performance optimization. Simplifies the process of identifying
issues, bottlenecks, and understanding the overall health.
v
Application Insight: Live Metrics
Metrics Stream is a game-changer for real-
time monitoring, offering a live, dynamic
view into your application's performance
and health. Provides immediate visibility
into critical metrics, including request rates,
response times, dependencies, and
failures, empowering quick identification
and resolution of issues as they occur. Its
interactive interface allows for instant
queries and filtering, enabling teams to
swiftly react to anomalies, ensuring
optimal application performance. Tool for
proactive monitoring, facilitating rapid
responses and enhancing overall
application reliability.
v
Application Insight: Smart Detection
Smart Detection is an intelligent
feature designed to proactively
identify and alert on anomalies and
performance issues within
applications. Leveraging machine
learning algorithms, it automatically
detects unusual patterns in telemetry
data, such as sudden changes in
response times, error rates, or
dependency failures. By promptly
notifying users about potential issues,
Smart Detection streamlines the
troubleshooting process, allowing
teams to address problems swiftly
before they impact users.
v
Application Insight: Failures
Failures feature is a pivotal component
for detecting, diagnosing, and
resolving issues within applications. It
offers a comprehensive overview of
exceptions and errors occurring within
the application, providing detailed
insights into the root causes of
failures. With its intelligent grouping
and aggregation of similar exceptions,
it streamlines the troubleshooting
process by highlighting patterns and
trends in error occurrences.
v
Application Insight: Transaction Search
Transaction Search is a robust and
versatile tool for investigating and
analyzing specific requests within your
application. It offers a powerful search
capability that allows you to delve into
individual transactions, enabling the
retrieval of detailed telemetry data
such as requests, dependencies,
traces, and exceptions. This feature is
invaluable for pinpointing and
understanding the behavior of specific
user interactions or problematic
transactions, facilitating in-depth
analysis for performance optimization
and issue resolution.
vm
Application Gateway: Request
vm
Application Gateway: Resource Health
vm
Azure Monitor: Query Performance Insight
vm
Application Gateway: SQL Dependency
vm
Azure Monitor: Response Time
vm
Azure Monitor: Resource Usage
vm
Azure Monitor: BackendFirstByteResponseTime
vm
Web Application Firewall: Rules
vm
Azure Monitor: Anti DDOS
Terima Kasih
email: andik@ysi.co.id

Azure Monitor & Application Insight to monitor Infrastructure & Application

  • 1.
    vv Monitoring your Applicationwith Application Insight and Azure Monitor Presented by andik@ysi.co.id
  • 2.
    Database Web & MobileApps E-commerce FrontEnd E-commerce BackEnd Application Architecture
  • 3.
    Database Web & MobileApps E-commerce FrontEnd E-commerce BackEnd Application Architecture BackEnd Farm App Service Autoscaling Web Application Firewall DDOS Protection Load Balancer Appllication gateway
  • 4.
    Database Web & MobileApps E-commerce FrontEnd E-commerce BackEnd Application Architecture BackEnd Farm App Service Autoscaling Web Application Firewall DDOS Protection Load Balancer Appllication gateway
  • 5.
    Database Web & MobileApps E-commerce FrontEnd E-commerce BackEnd Application become Slow BackEnd Farm App Service Autoscaling Web Application Firewall DDOS Protection Load Balancer Appllication gateway How to Check it?
  • 6.
    Database Web & MobileApps E-commerce FrontEnd E-commerce BackEnd Finding… BackEnd Farm App Service Autoscaling Web Application Firewall DDOS Protection Load Balancer Appllication gateway
  • 7.
    Azure Monitor isa cloud service that provides end-to-end monitoringof your applications and the components they rely on, such as Azure resources, Kubernetes, and Log Analytics. It collects, analyzes, and responds to telemetrydata from your cloud and hybrid environments, and helps you maximizeperformanceand availability,troubleshoot issues, and drive innovation12 Learn more 1 learn.microsoft.com 2 azure.microsoft.com 3 azure.microsoft.com +1 more Answer from the web instead How do I set up Azure Monitor? What types of data can be monitored with Azure Monitor? Can I use Azure Monitor for security monitoring? Your personal and company data are protected Response stopped New topic Ask me anything... 0/4000 Azure Monitor Azure Monitor is a cloud service that provides end-to-end monitoring of your applications and the components they rely on, such as Azure resources, Kubernetes, and Log Analytics. It collects, analyzes, and responds to telemetry data from your cloud and hybrid environments, and helps you maximize performance and availability, troubleshoot issues, and drive innovation
  • 8.
    v Application Insight As arobust Application Performance Management (APM) solution, offering a comprehensive suite of tools to monitor, diagnose, and optimize application performance. Can collect and analyze telemetry data from various sources, including web apps, services, and other components, Provides deep insights into application behavior, identifying issues, bottlenecks, and trends affecting performance. Its powerful analytics capabilities, including live metrics, transaction search, and application maps, empower teams to proactively monitor and troubleshoot issues.
  • 9.
    v Azure Monitor Scenario Correlateissues at infra level with insights for VMs, containers, SQL, network, etc. Operationalize at scale with smart alerts and automated actions Detect & diagnose issues across apps and dependencies with application insights Drill down with log analytics for troubleshooting & deeper diagnostics Create visualizations with Azure dashboards & workbooks
  • 10.
    v Azure Monitor: AlertAlert feature is a crucial component for proactive monitoring. It allows users to set up customized alerts based on defined metrics, thresholds, or specific conditions, triggering notifications when anomalies or predefined criteria are met. This capability ensures immediate awareness of critical issues or performance deviations, enabling swift action to address potential problems before they impact users. With its flexible configuration options and integration with various communication channels, including emails, SMS, or third-party tools.
  • 11.
    v Application Insight: Performance Performancefeature is a crucial component for understanding and optimizing the performance of your applications. It offers detailed insights into the performance characteristics of your code, providing metrics such as response times, server-side execution duration, and dependency calls. With customizable charts and dashboards, it enables precise analysis of performance trends, identifying bottlenecks and areas for improvement. The ability to set performance goals and track against these benchmarks empowers teams to continuously enhance application performance, ensuring a seamless user experience.
  • 12.
    v Application Insight: ApplicationMap Application Map is a powerful visualization tool that offers a comprehensive overview of your application's components and their dependencies. It provides a clear, real-time representation of how various parts of your application interact, aiding in troubleshooting and performance optimization. Simplifies the process of identifying issues, bottlenecks, and understanding the overall health.
  • 13.
    v Application Insight: LiveMetrics Metrics Stream is a game-changer for real- time monitoring, offering a live, dynamic view into your application's performance and health. Provides immediate visibility into critical metrics, including request rates, response times, dependencies, and failures, empowering quick identification and resolution of issues as they occur. Its interactive interface allows for instant queries and filtering, enabling teams to swiftly react to anomalies, ensuring optimal application performance. Tool for proactive monitoring, facilitating rapid responses and enhancing overall application reliability.
  • 14.
    v Application Insight: SmartDetection Smart Detection is an intelligent feature designed to proactively identify and alert on anomalies and performance issues within applications. Leveraging machine learning algorithms, it automatically detects unusual patterns in telemetry data, such as sudden changes in response times, error rates, or dependency failures. By promptly notifying users about potential issues, Smart Detection streamlines the troubleshooting process, allowing teams to address problems swiftly before they impact users.
  • 15.
    v Application Insight: Failures Failuresfeature is a pivotal component for detecting, diagnosing, and resolving issues within applications. It offers a comprehensive overview of exceptions and errors occurring within the application, providing detailed insights into the root causes of failures. With its intelligent grouping and aggregation of similar exceptions, it streamlines the troubleshooting process by highlighting patterns and trends in error occurrences.
  • 16.
    v Application Insight: TransactionSearch Transaction Search is a robust and versatile tool for investigating and analyzing specific requests within your application. It offers a powerful search capability that allows you to delve into individual transactions, enabling the retrieval of detailed telemetry data such as requests, dependencies, traces, and exceptions. This feature is invaluable for pinpointing and understanding the behavior of specific user interactions or problematic transactions, facilitating in-depth analysis for performance optimization and issue resolution.
  • 17.
  • 18.
  • 19.
    vm Azure Monitor: QueryPerformance Insight
  • 20.
  • 21.
  • 22.
  • 23.
  • 24.
  • 25.
  • 26.