![Biogeochemistry
Panel
System
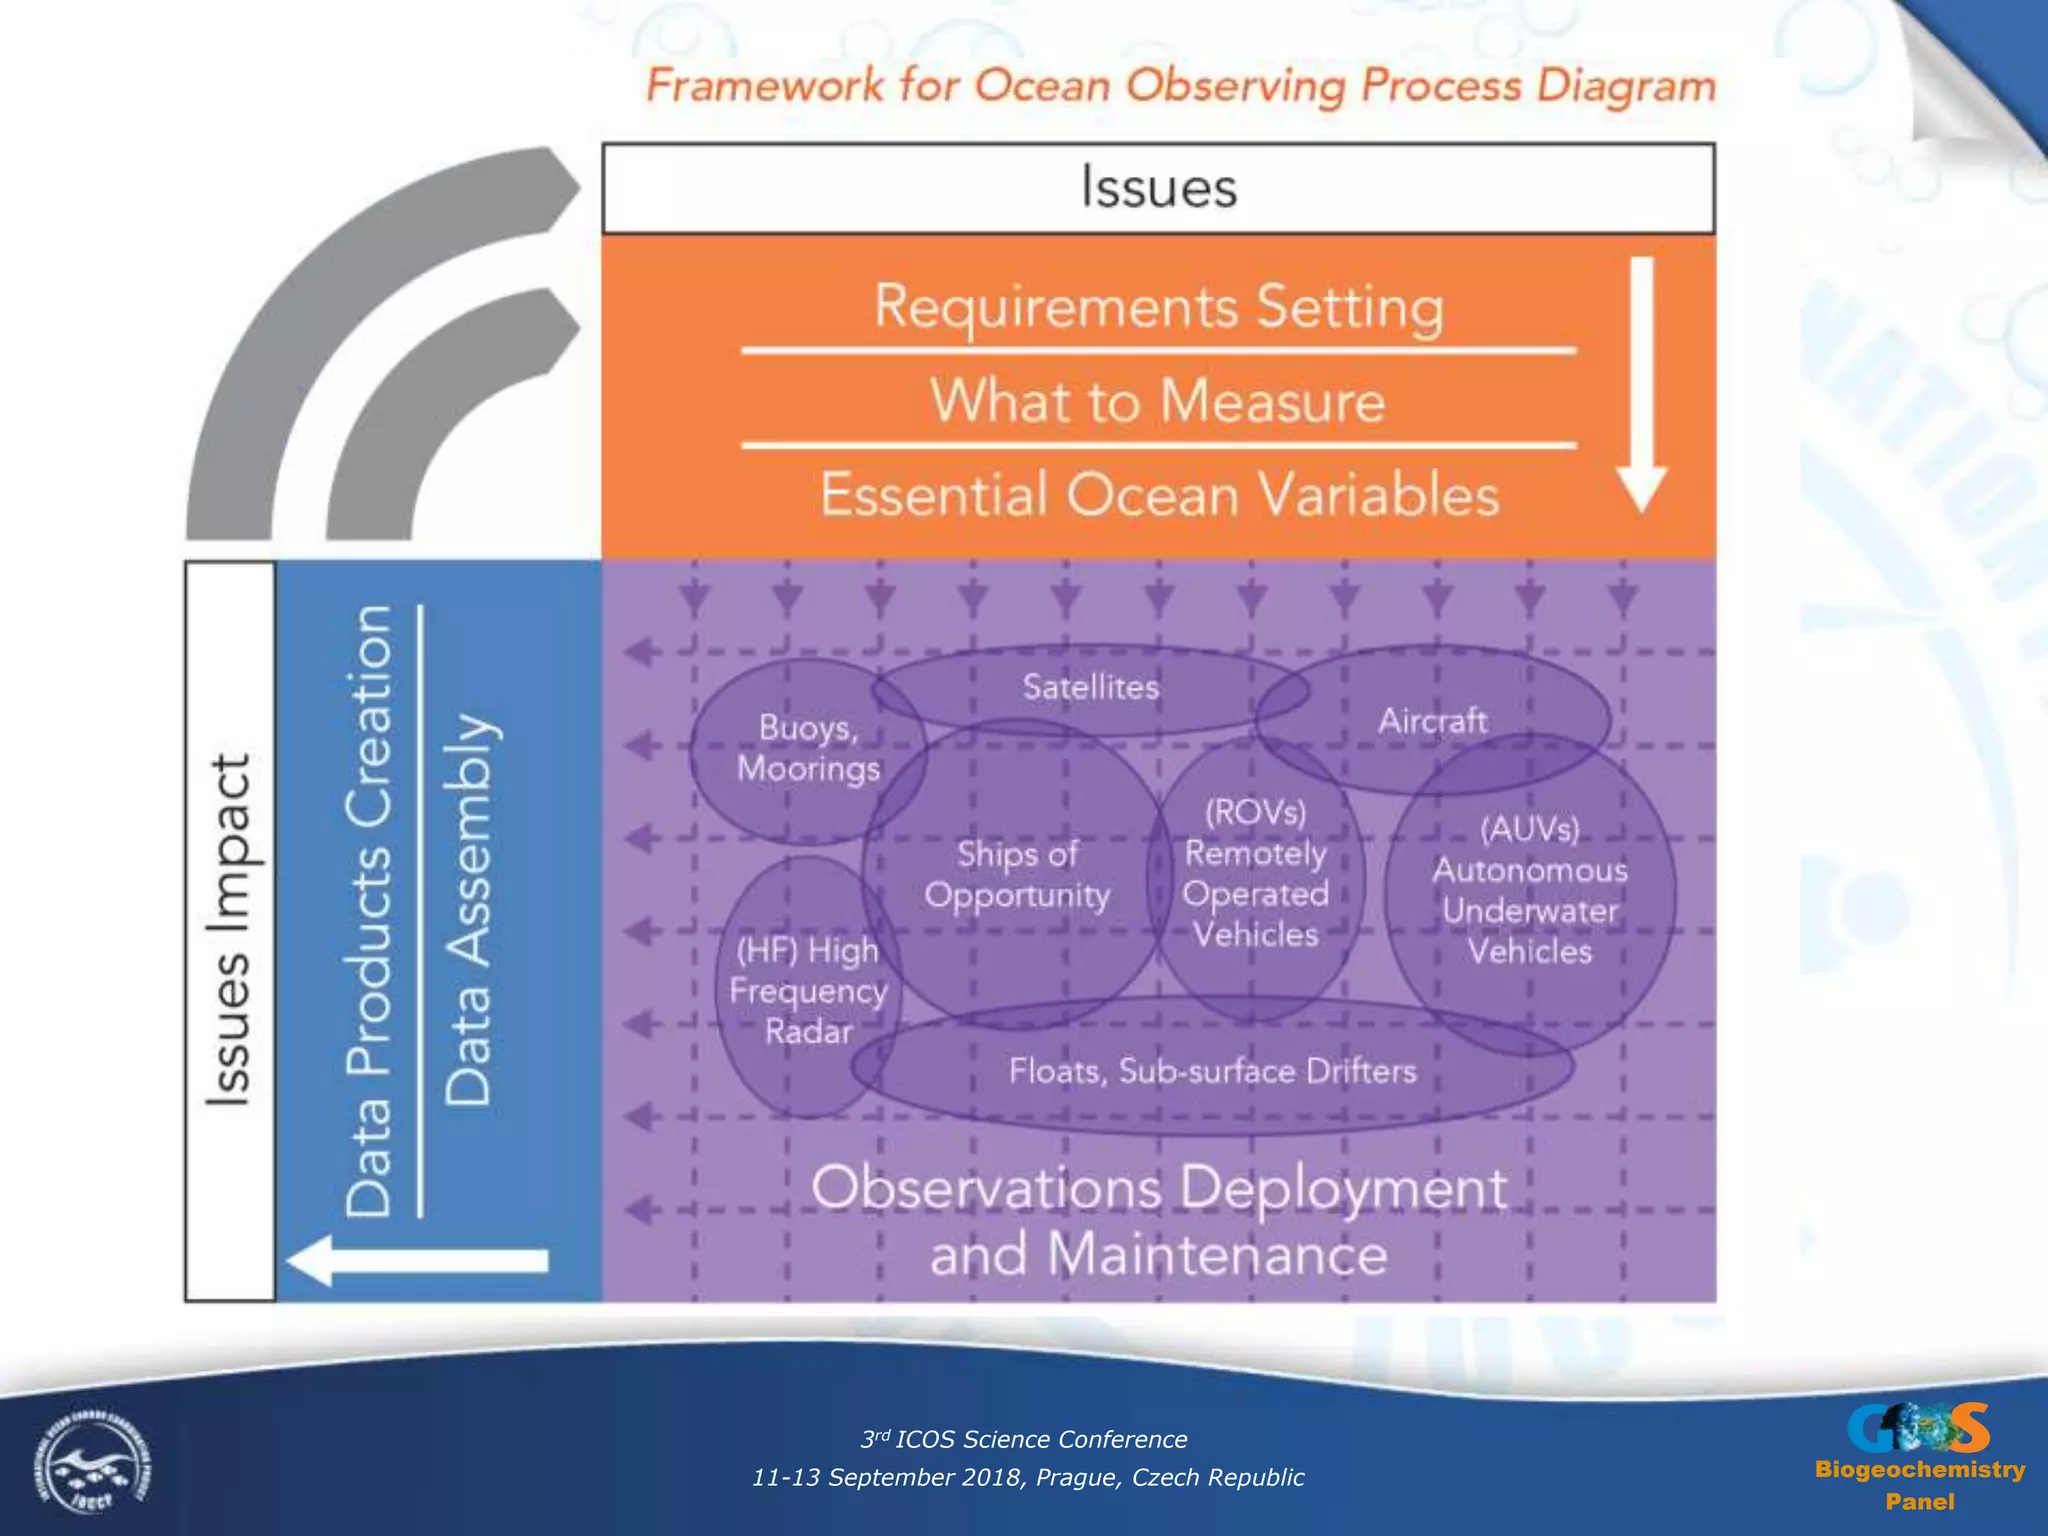
A broad schematic of a full value chain in
sustained ocean observing programs
Observations
Coordination
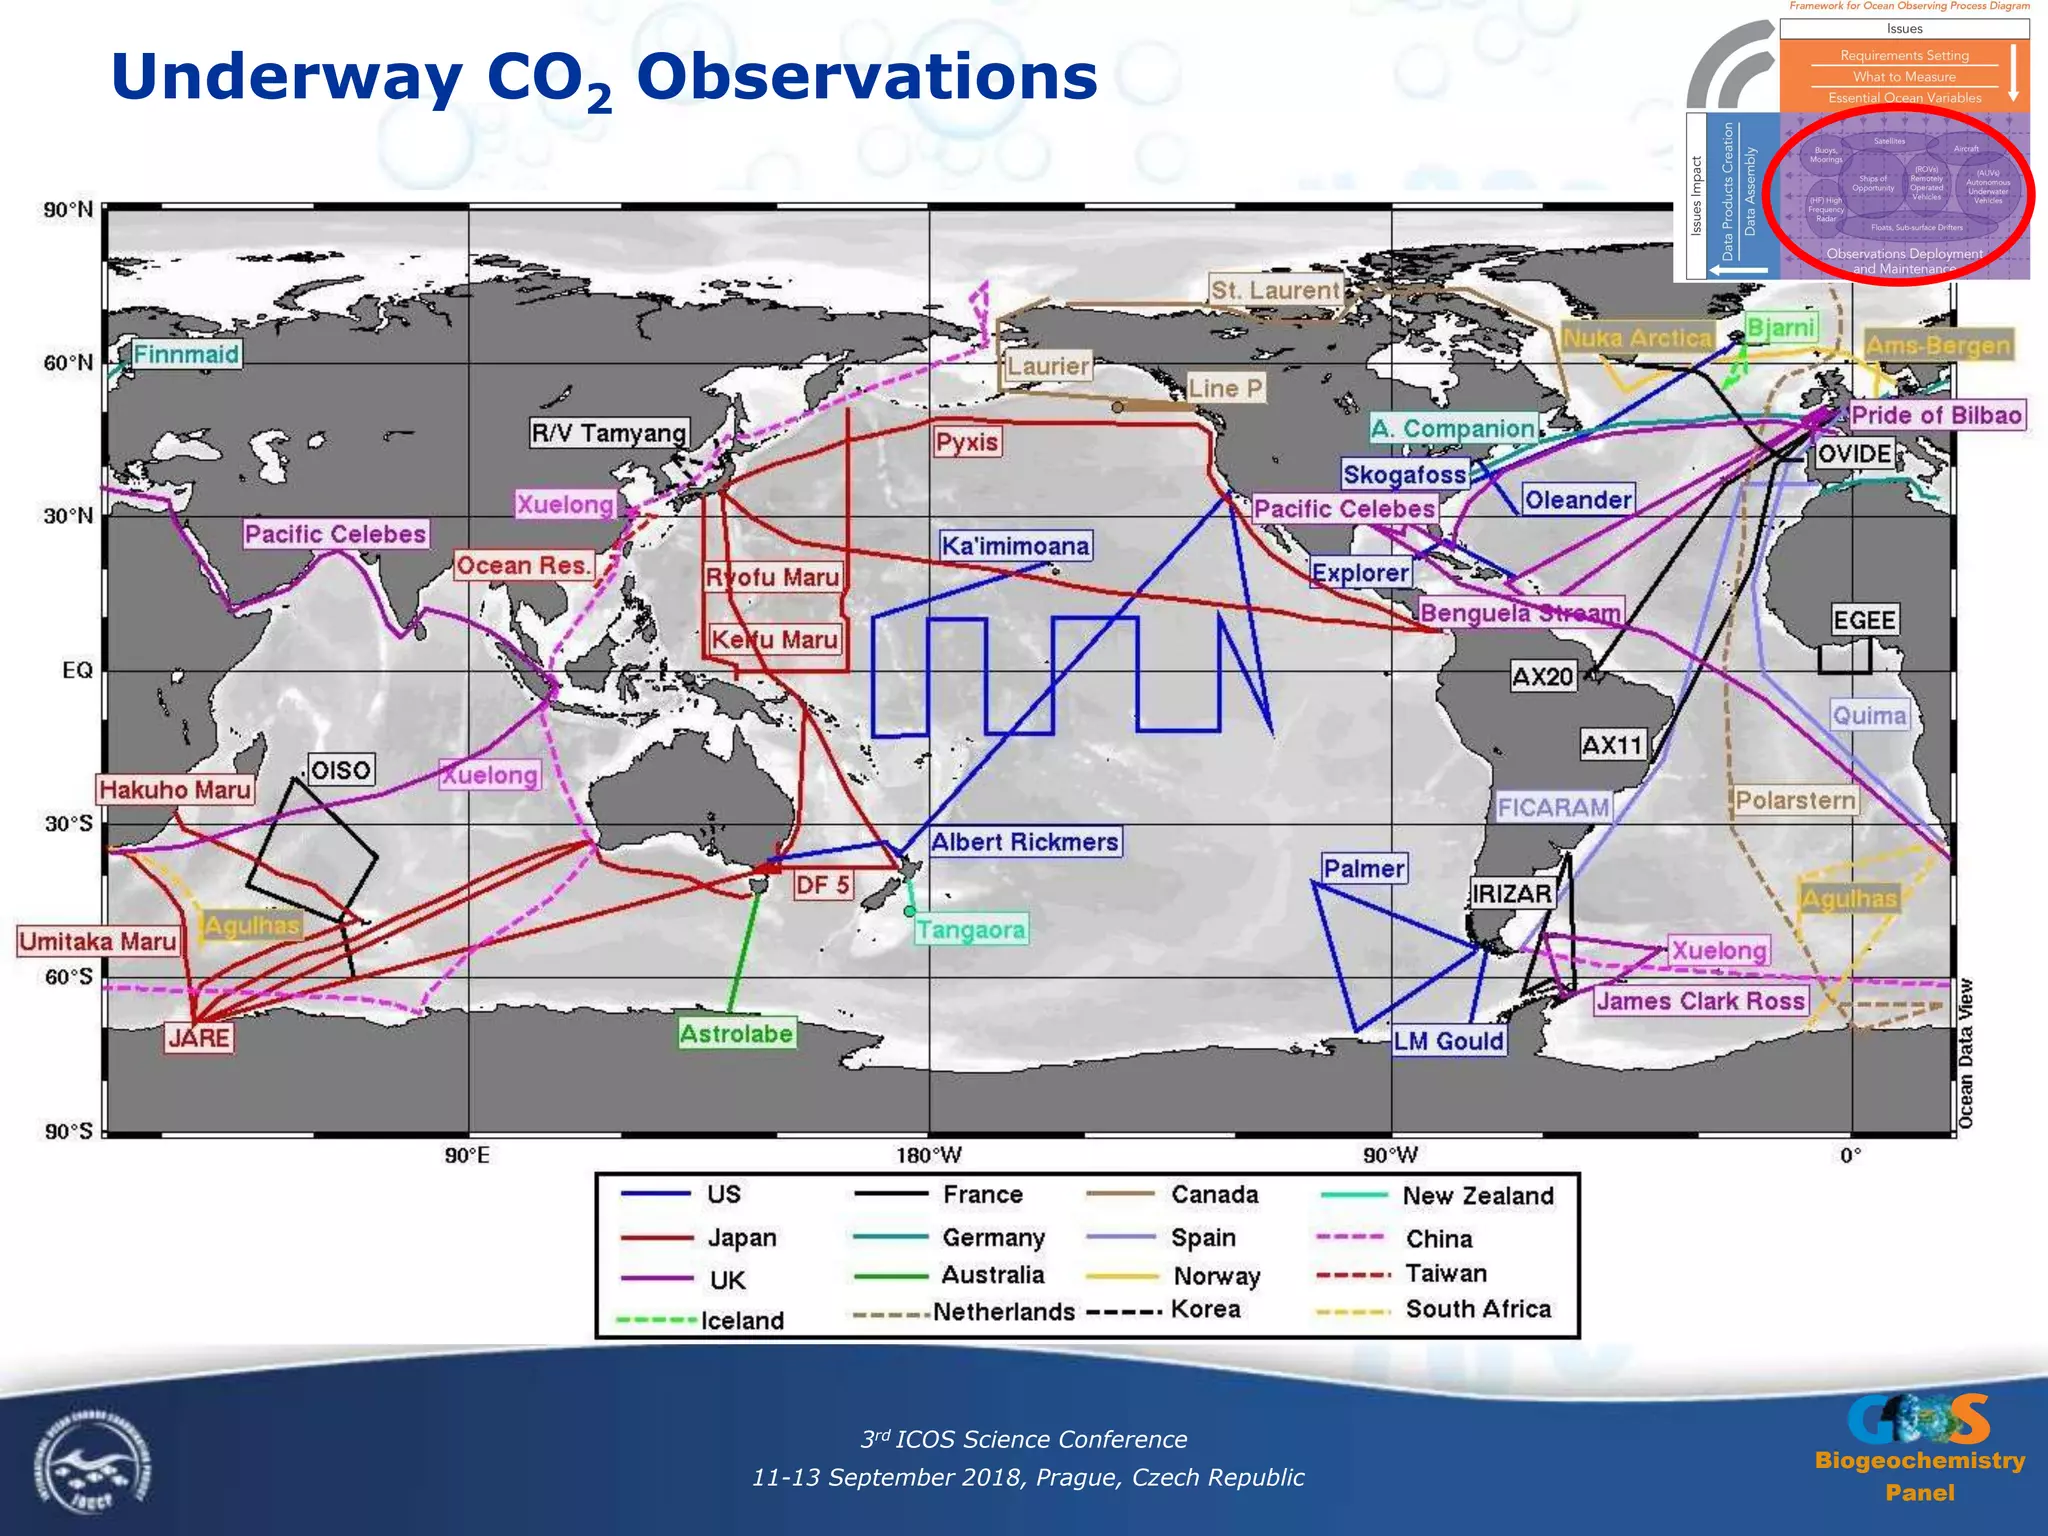
In situ and satellite observations
Global networks and global
approaches
System requirements
Applications/products, knowledge challenges,
phenomena, EOVs, network design
Data
systems
Assembly
and
dissemination
Understanding
Scientific analysis,
indicators
Predicting / Modeling
Ocean forecast systems
Societal benefit from actionable
information
Policy, public and private management and individual decisions
Assessing
Policy-relevant scientific
assessments
Services
[informing]
Early warning, forecasts,
short and long term
direct advice
www.ioccp.org/foo
Climate and
Weather
Real-time
services
Assessments and
management of
ecosystem services
Emission policies
Food security
Tourism
3rd ICOS Science Conference
11-13 September 2018, Prague, Czech Republic](https://image.slidesharecdn.com/03maciejtelszewskirequirementsdrivenobservingsystem20180910-181002124210/75/Viewing-ICOS-in-a-Global-Context-From-requirements-driven-ocean-observations-through-high-quality-data-to-fit-for-purpose-information-delivery-8-2048.jpg)
![Biogeochemistry
Panel
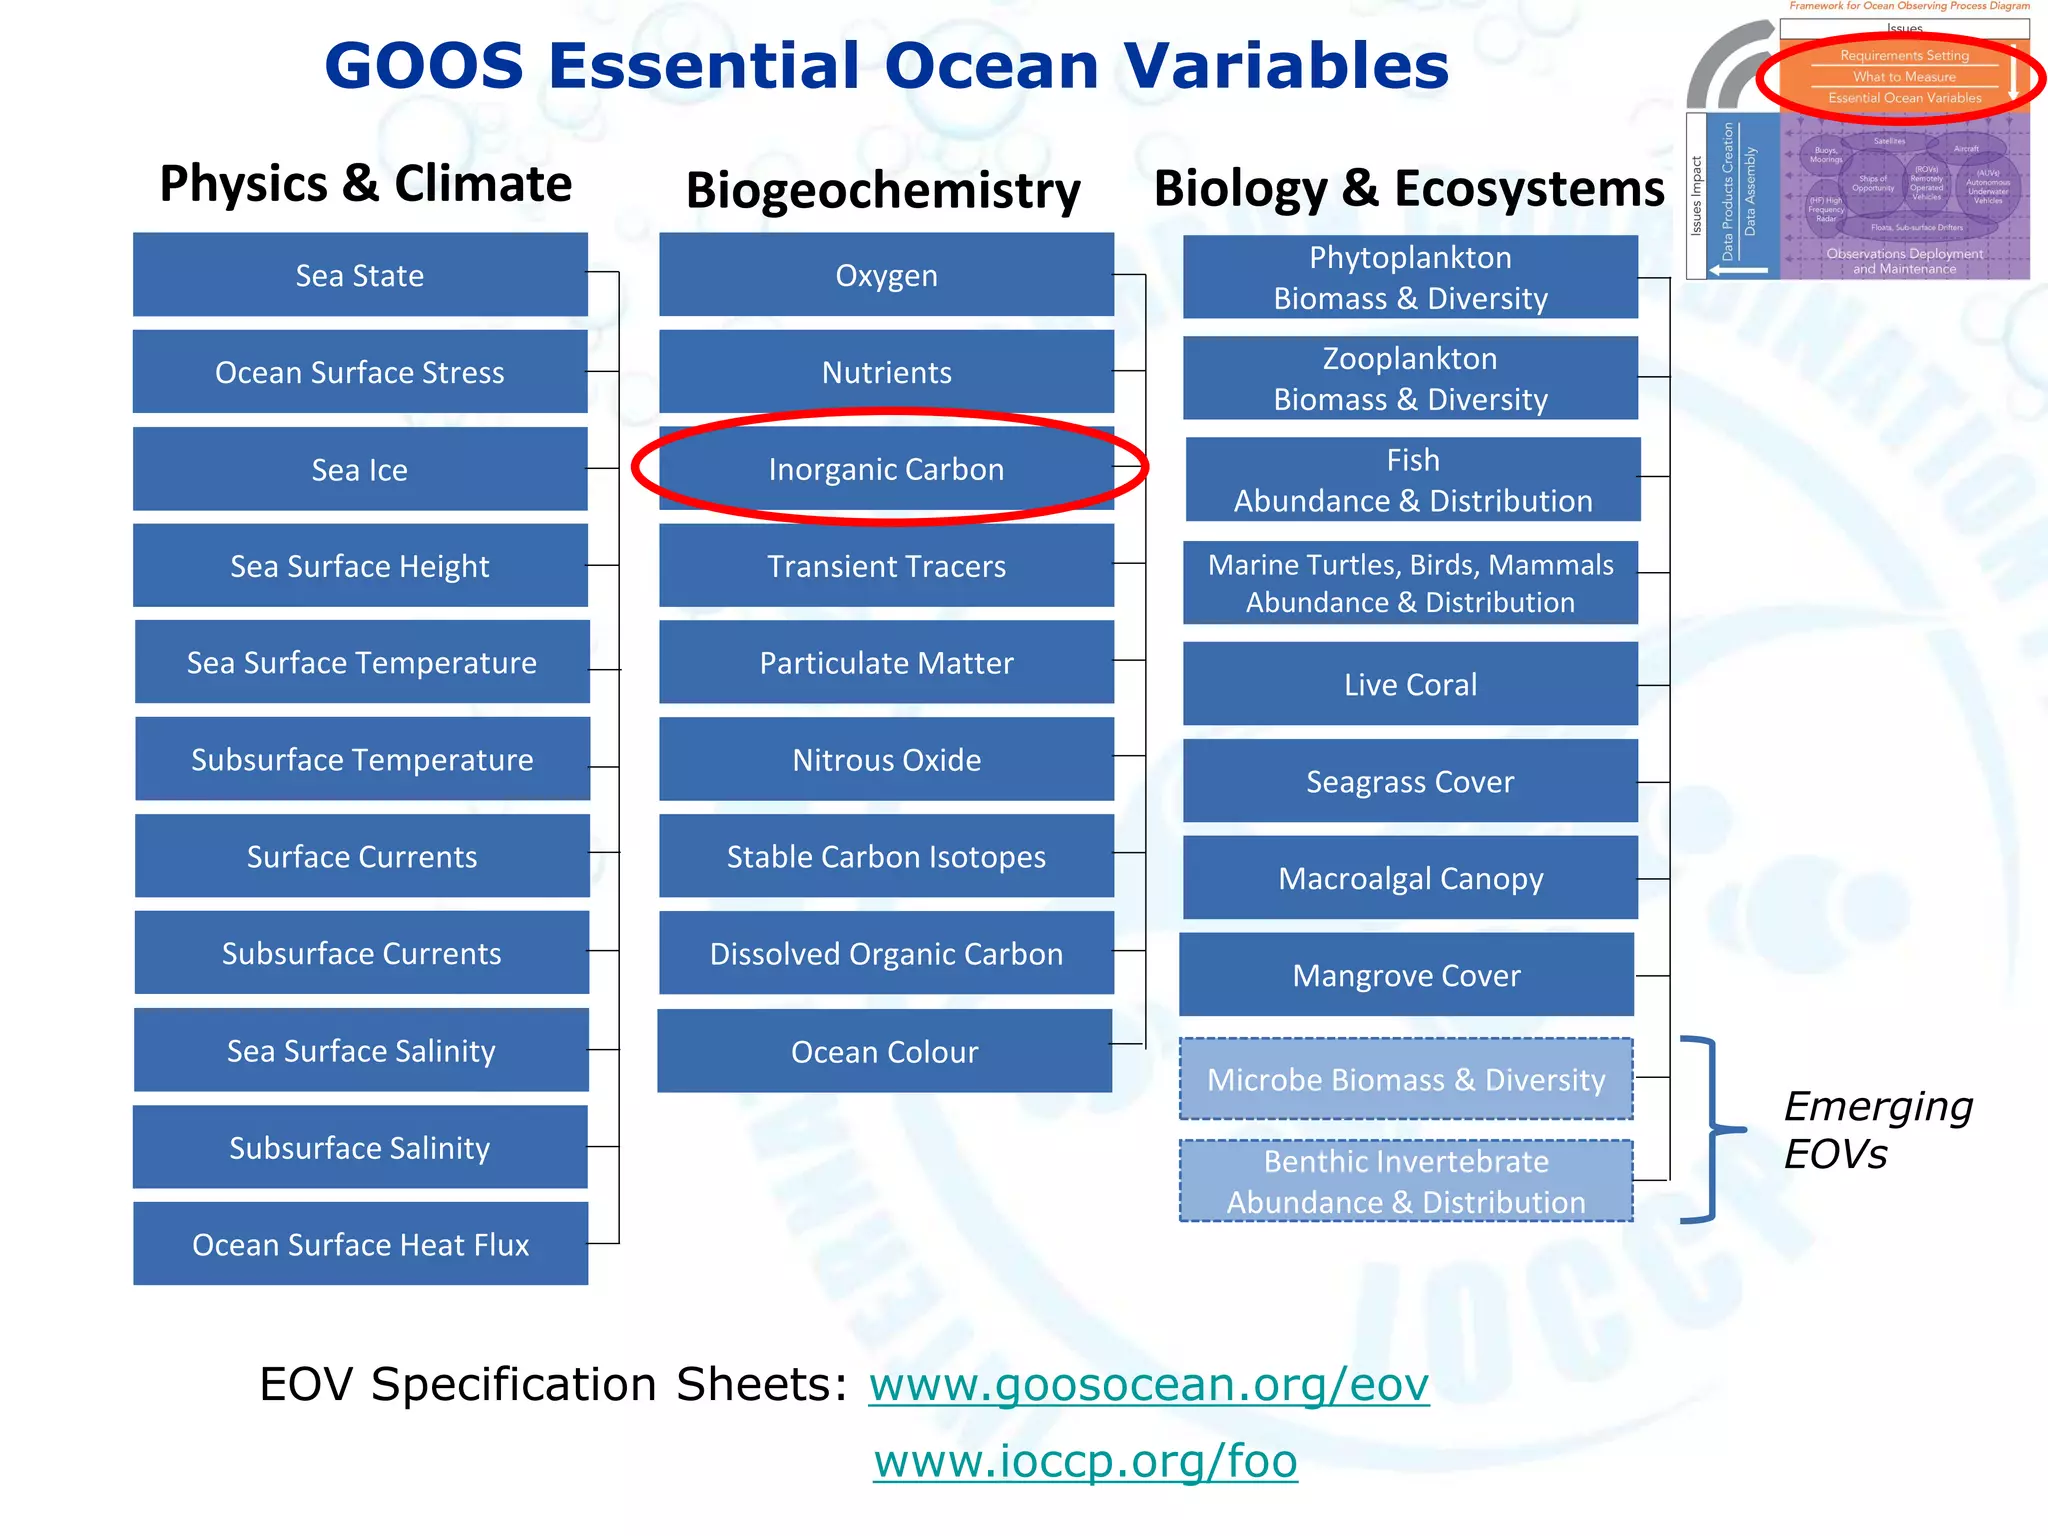
Essential Ocean Variable (EOV): Inorganic Carbon
Name of EOV Inorganic Carbon
Sub-Variables Dissolved Inorganic Carbon (DIC), Total Alkalinity (TA), Partial pressure of carbon
dioxide (pCO2) and pH.
[At least two of the four Sub-Variables are needed.]
Derived Products Saturation state (aragonite, calcite), Dissolved carbonate ion concentration, Air-sea
flux of CO2, Anthropogenic carbon, Change in total carbon
Supporting Variables Surface and subsurface Temperature, Surface and subsurface Salinity, Ocean vector
stress (wind speed), Atmospheric column-averaged dry-air mole fraction of CO2
(xCO2), Barometric pressure, Oxygen, Calcium concentration, Transient tracers,
Oxygen to argon ratio (O2/Ar)
Responsible GOOS Panel GOOS Biogeochemistry Panel
Contact: ioccp@ioccp.org
The Essential Ocean Variables
Specification Sheets
3rd ICOS Science Conference
11-13 September 2018, Prague, Czech Republic
EOV Specification Sheets:
www.goosocean.org/eov
www.ioccp.org/foo](https://image.slidesharecdn.com/03maciejtelszewskirequirementsdrivenobservingsystem20180910-181002124210/75/Viewing-ICOS-in-a-Global-Context-From-requirements-driven-ocean-observations-through-high-quality-data-to-fit-for-purpose-information-delivery-15-2048.jpg)
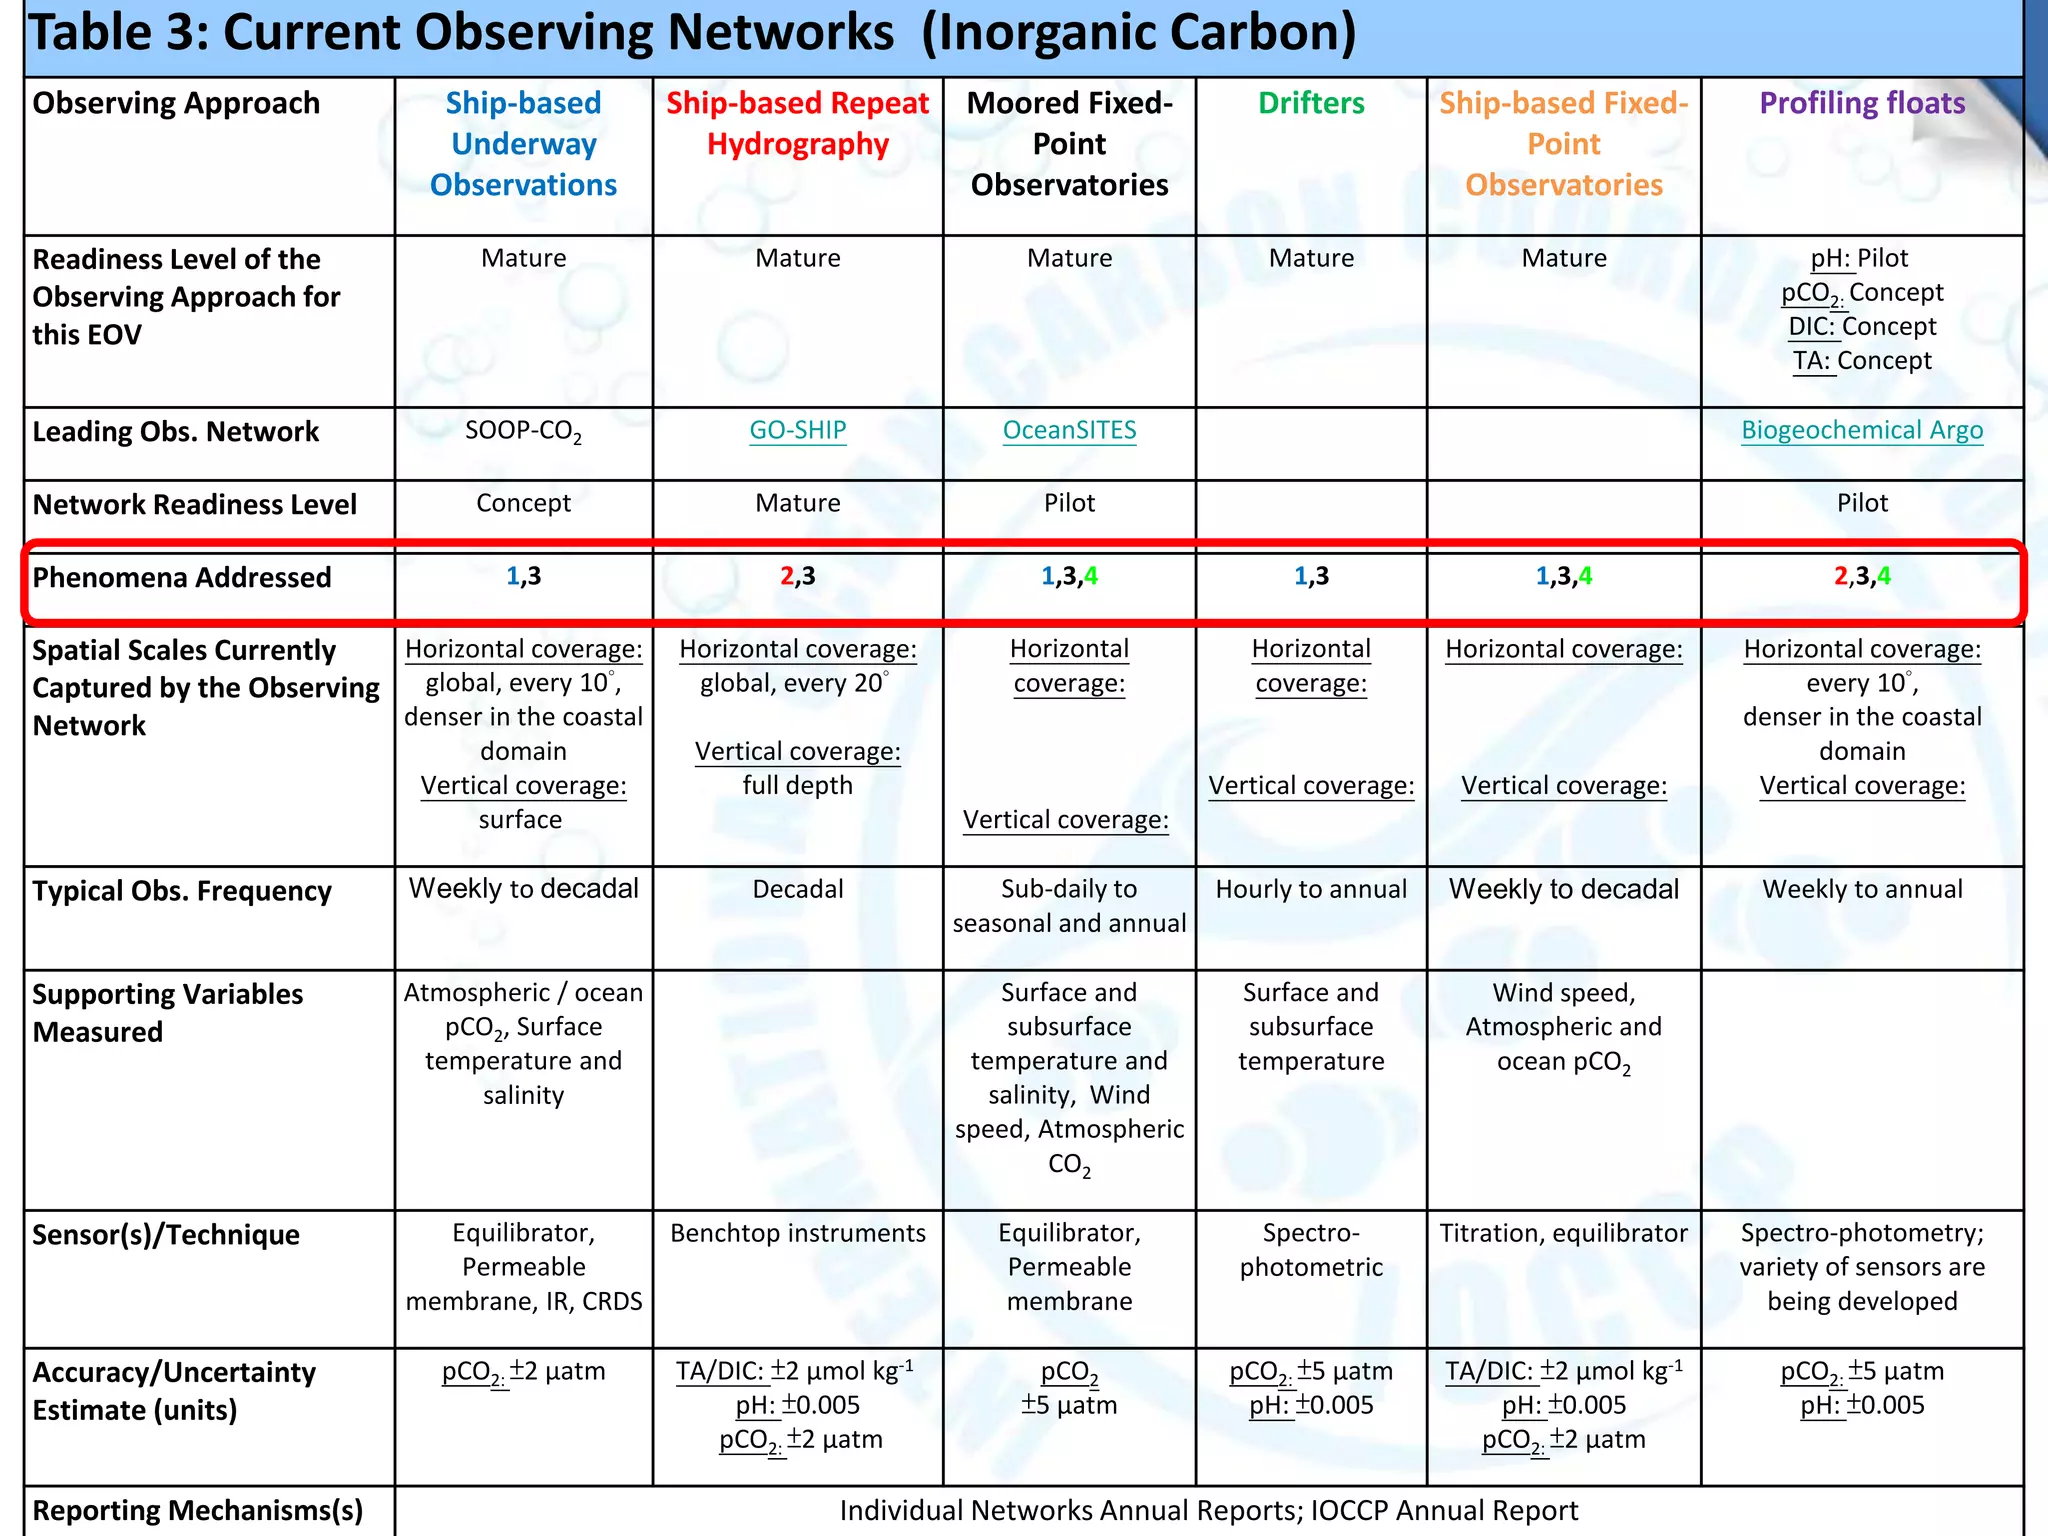
![Table 2: Requirements Setting (Inorganic Carbon)
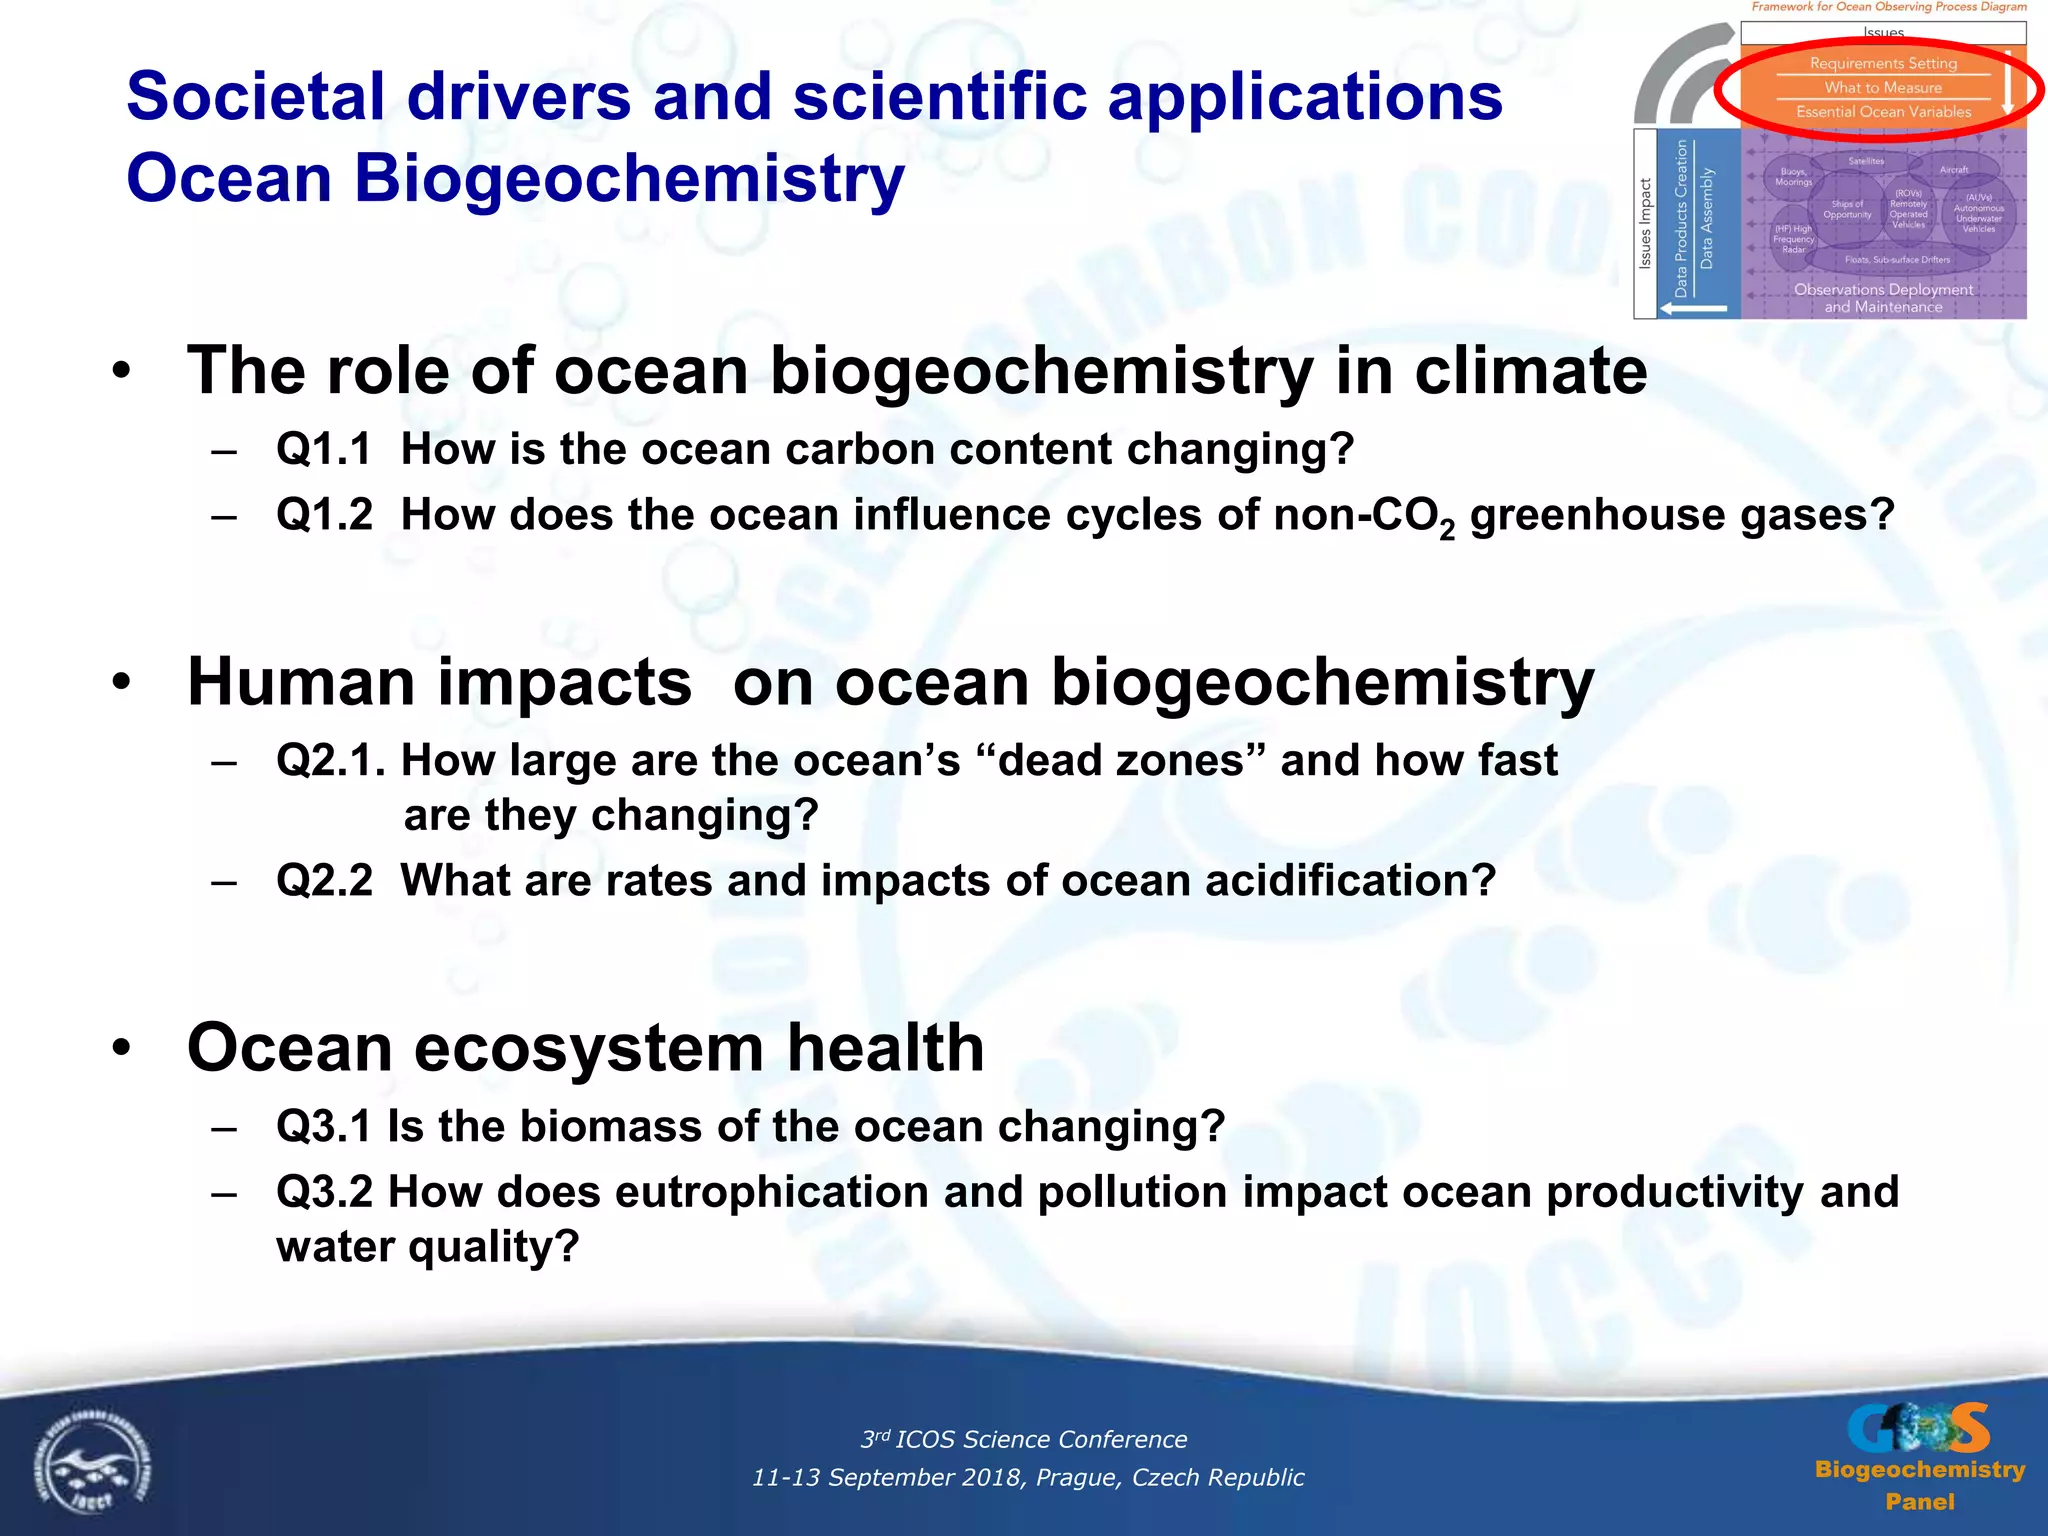
Societal Drivers 1. The role of ocean biogeochemistry in climate
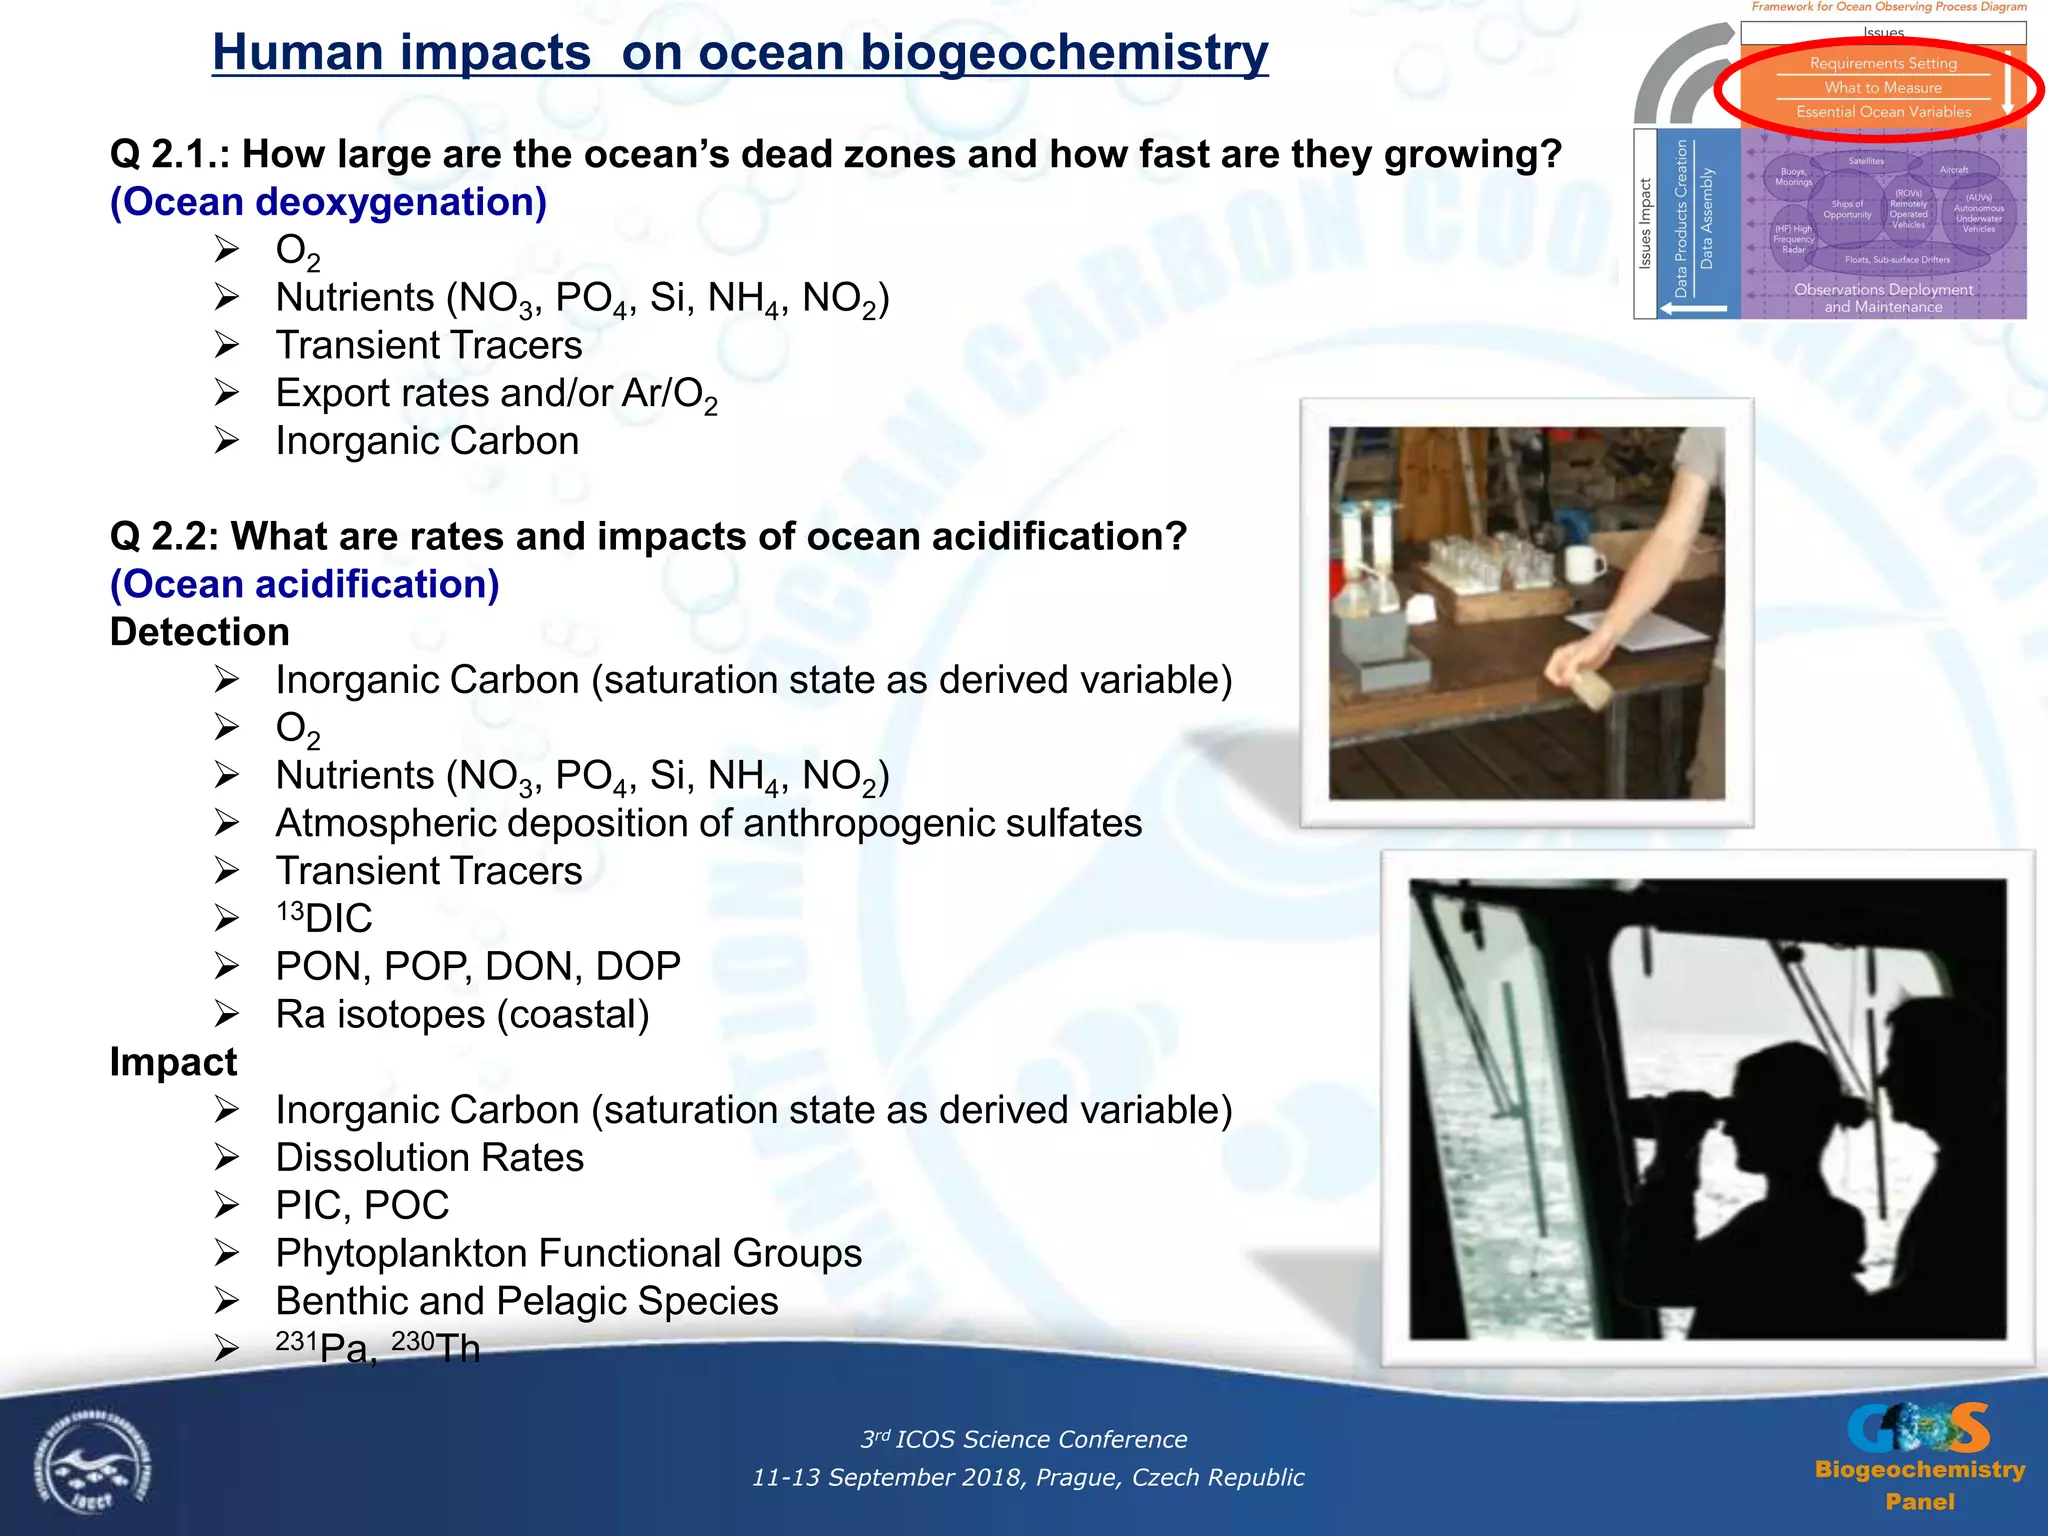
2. Human impacts on ocean biogeochemistry
3. Ocean ecosystem health
Scientific Application(s) Q 1.1. How is the ocean carbon content changing?
Q 2.1. How large are the ocean’s dead zones and how fast are they growing?
Q 2.2. What are rates and impacts of ocean acidification?
Q 3.1. Is the biomass of the oceans changing?
Readiness Level
[as defined in the FOO]
Mature
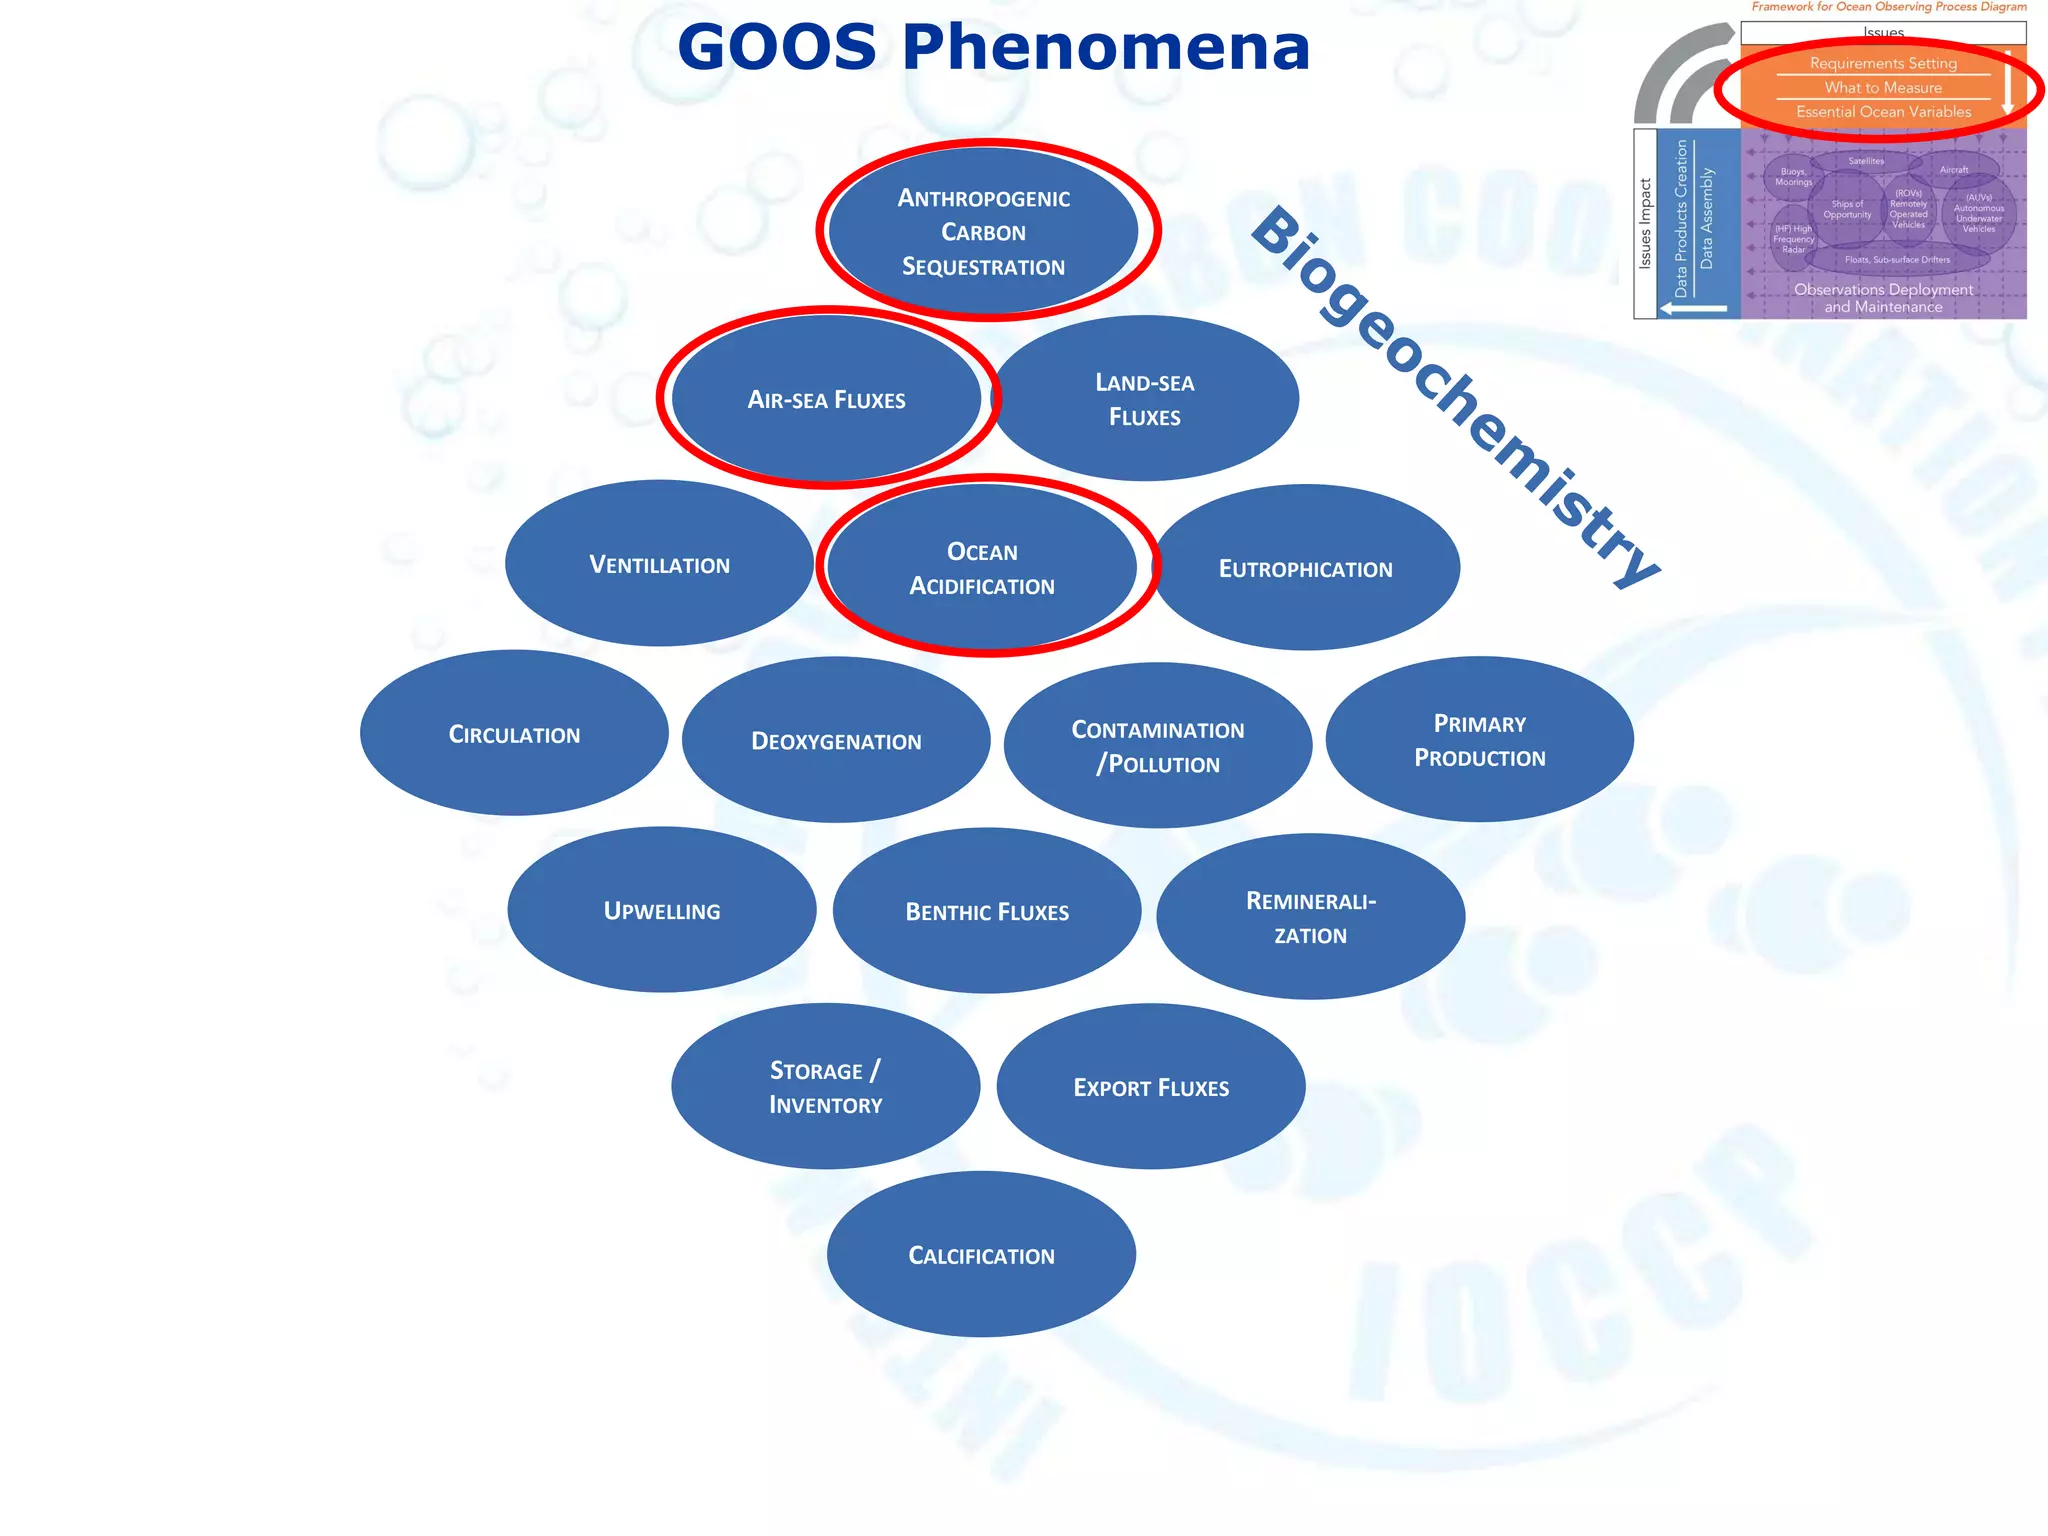
Phenomena to Capture 1
Air-Sea Fluxes
2
Storage / inventory
3
Ocean Acidification
4
Primary production
Temporal Scales of the
Phenomena
Monthly Annual Coastal
Daily
Open Ocean
Seasonal
Seasonal to decadal
Spatial Scales of the Phenomena 1-250 km 100-1000 km Coastal
0.1-100 km
Open Ocean
100-1000km
Coastal
1-100 km
Open Ocean
100-1000 km
Magnitudes/Range of the Signal
to Capture
2 Pg C yr-1 20 Pg C decade-1 Saturation states
0.1 decade-1
pH
0.01 decade-1
0.5 Pg C yr-1 decade-1
(net community
production)
Current Uncertainty Relative to
the Signal
Target Uncertainty Relative to the
Signal
±10% ±10% ±20%](https://image.slidesharecdn.com/03maciejtelszewskirequirementsdrivenobservingsystem20180910-181002124210/75/Viewing-ICOS-in-a-Global-Context-From-requirements-driven-ocean-observations-through-high-quality-data-to-fit-for-purpose-information-delivery-16-2048.jpg)
![Biogeochemistry
Panel
System
A broad schematic of a full value chain in
sustained ocean observing programs
Observations
Coordination
In situ and satellite observations
Global networks and global
approaches
System requirements
Applications/products, knowledge challenges,
phenomena, EOVs, network design
Data
systems
Assembly
and
dissemination
Understanding
Scientific analysis,
indicators
Predicting / Modeling
Ocean forecast systems
Societal benefit from actionable
information
Policy, public and private management and individual decisions
Assessing
Policy-relevant scientific
assessments
Services
[informing]
Early warning, forecasts,
short and long term
direct advice
www.ioccp.org/foo
3rd ICOS Science Conference
11-13 September 2018, Prague, Czech Republic](https://image.slidesharecdn.com/03maciejtelszewskirequirementsdrivenobservingsystem20180910-181002124210/75/Viewing-ICOS-in-a-Global-Context-From-requirements-driven-ocean-observations-through-high-quality-data-to-fit-for-purpose-information-delivery-42-2048.jpg)

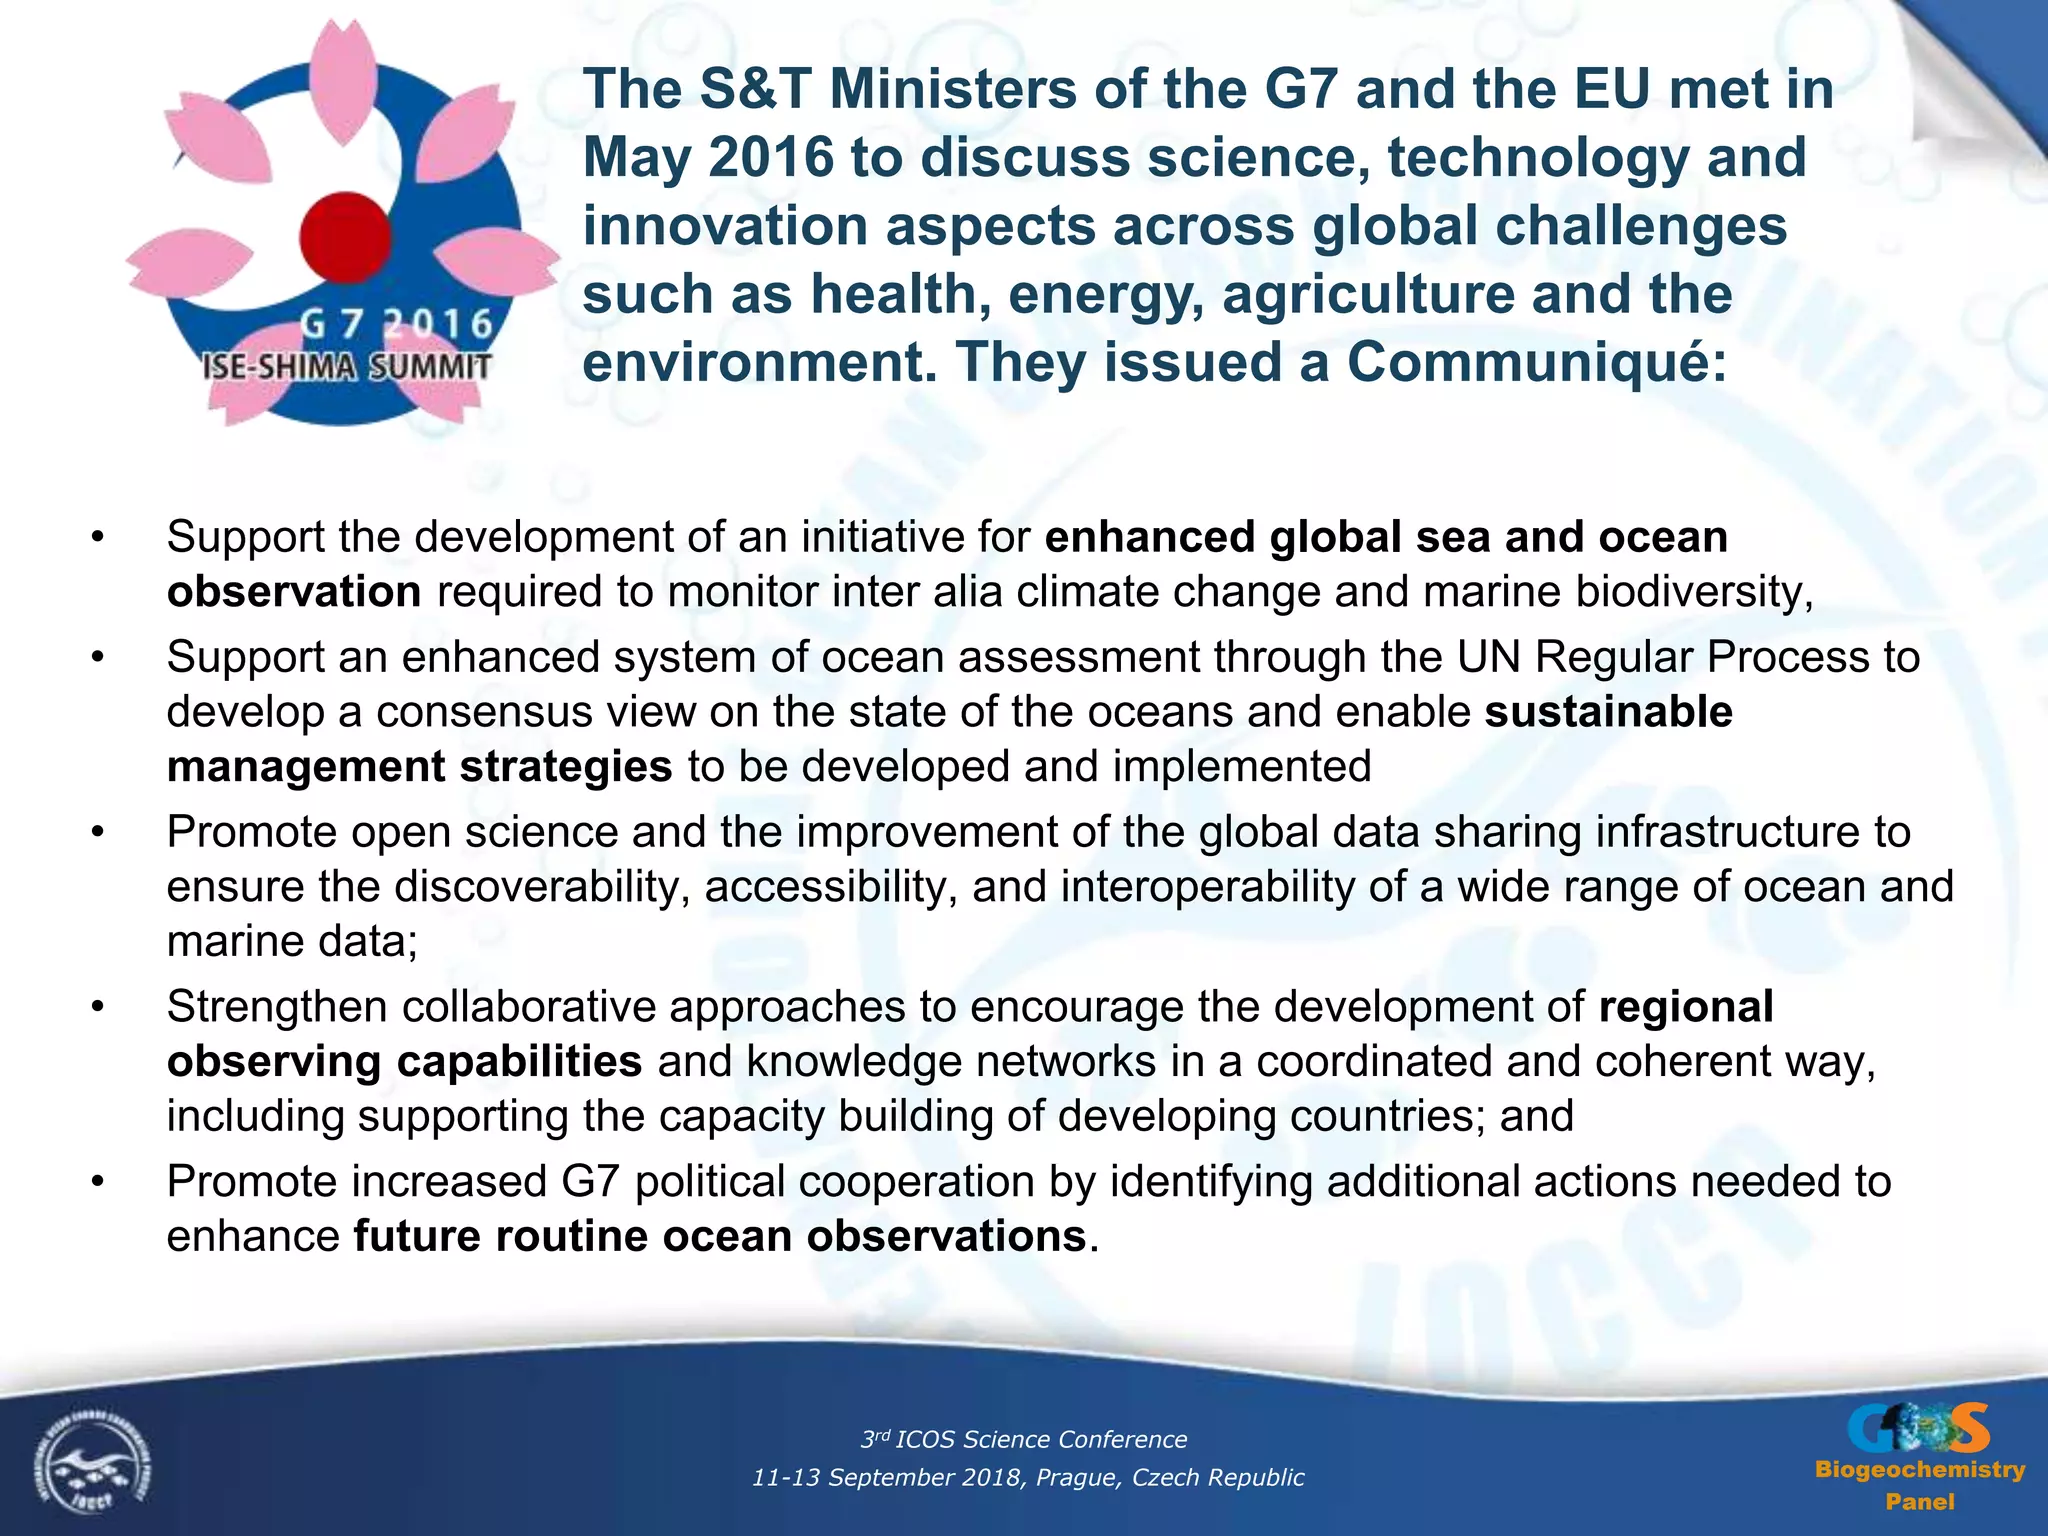
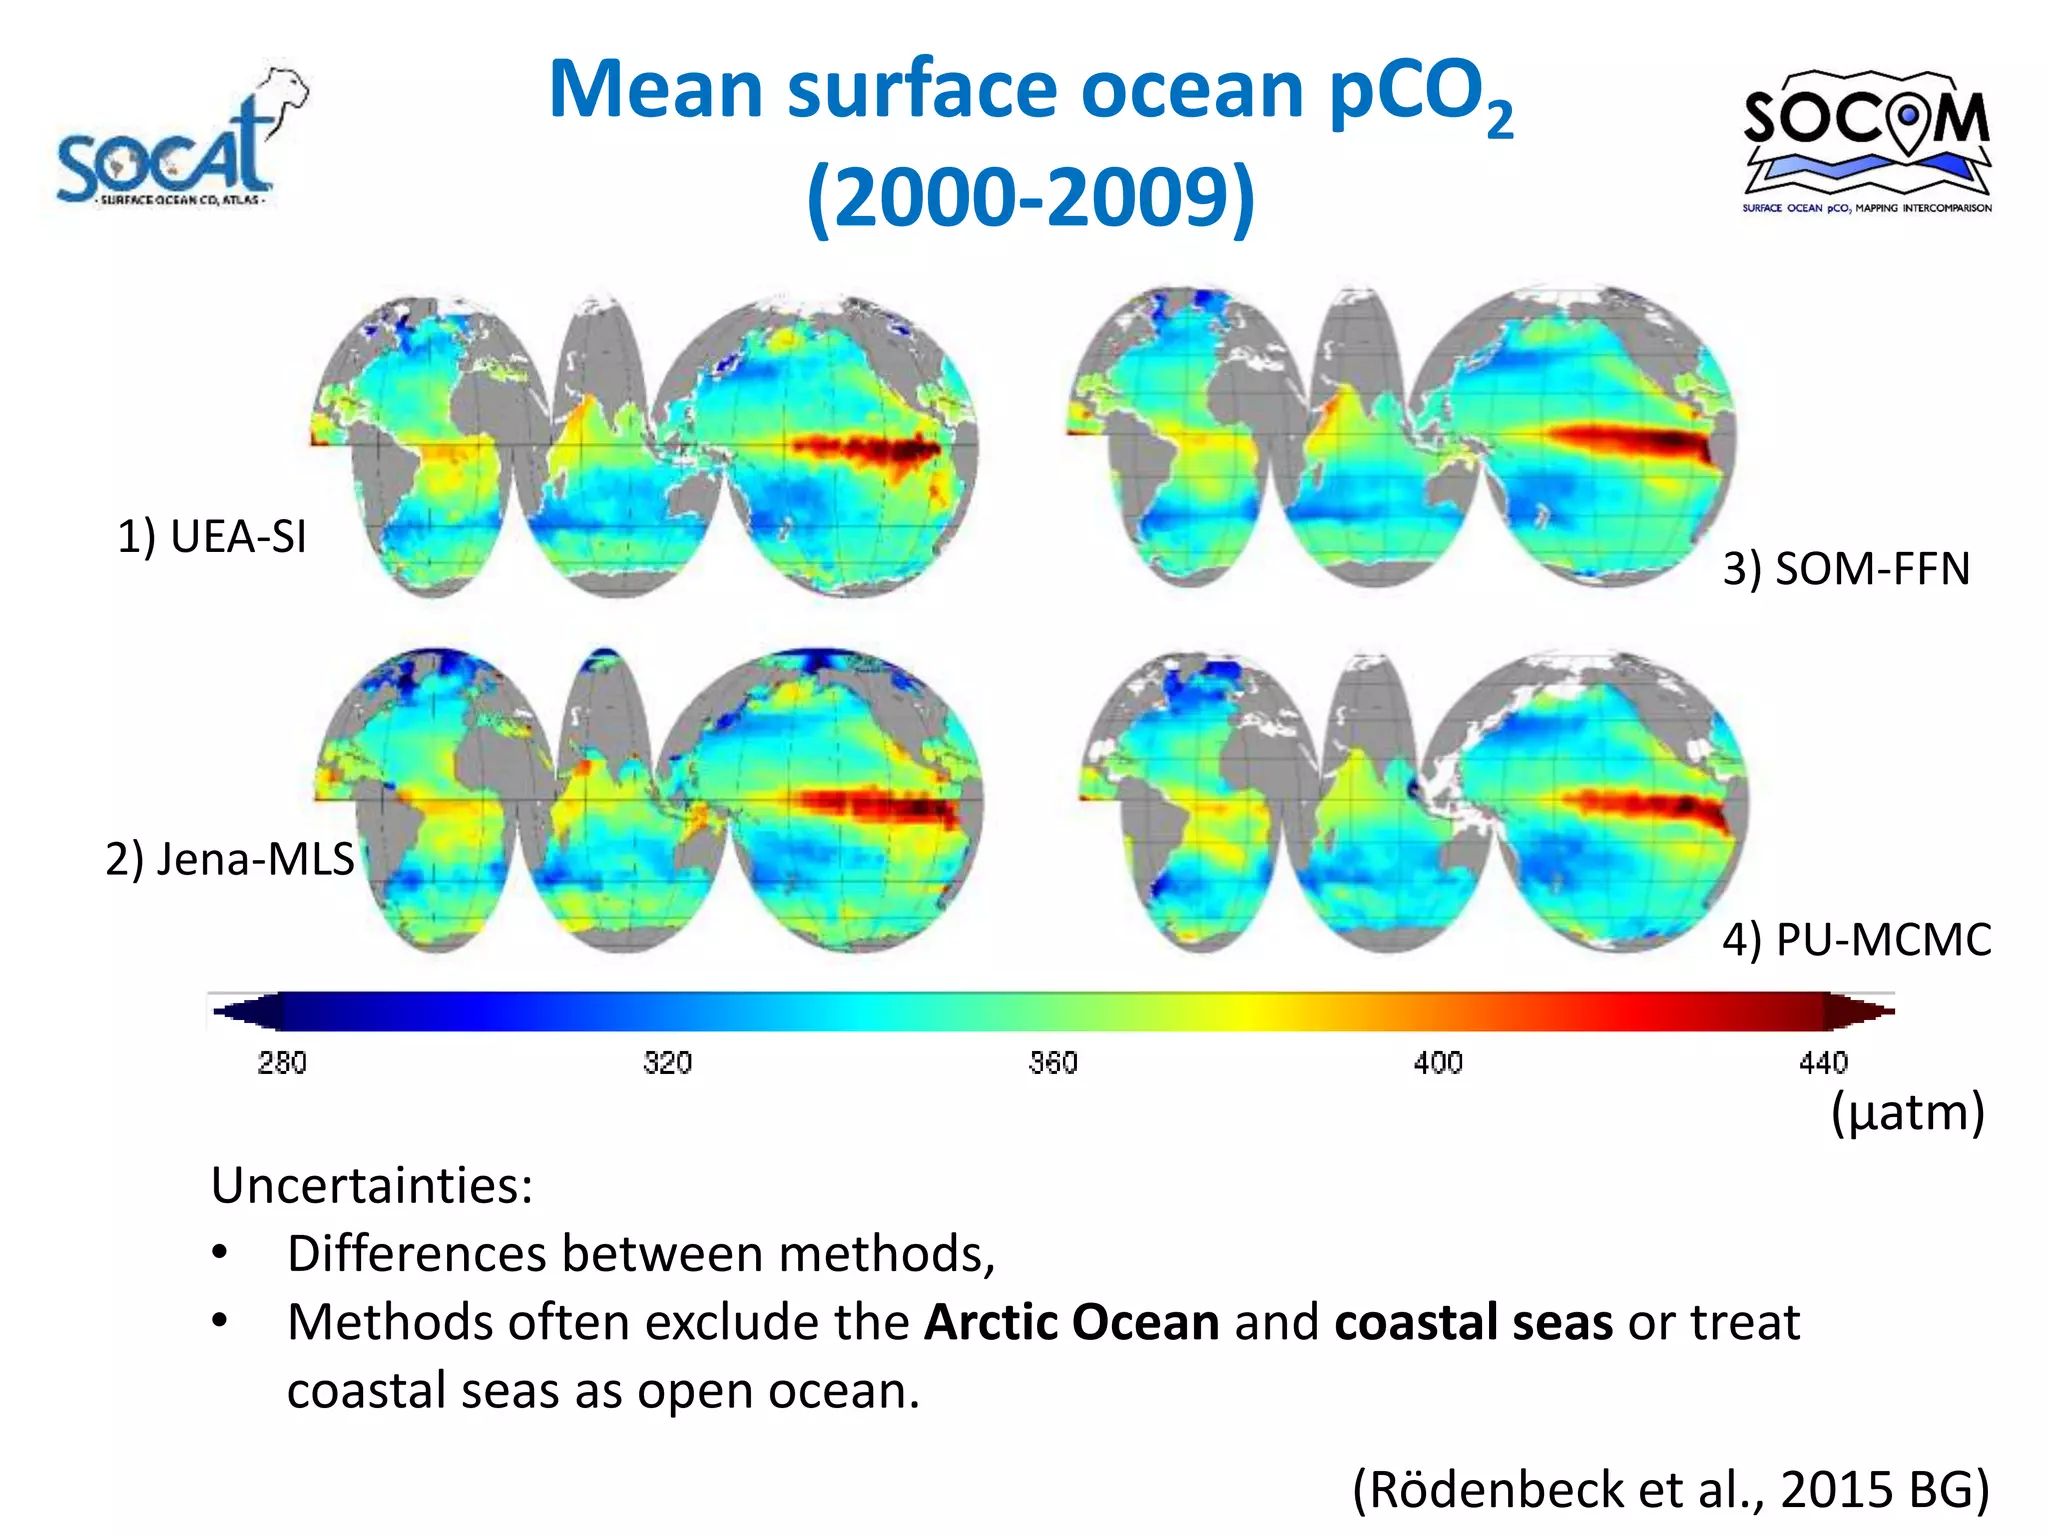
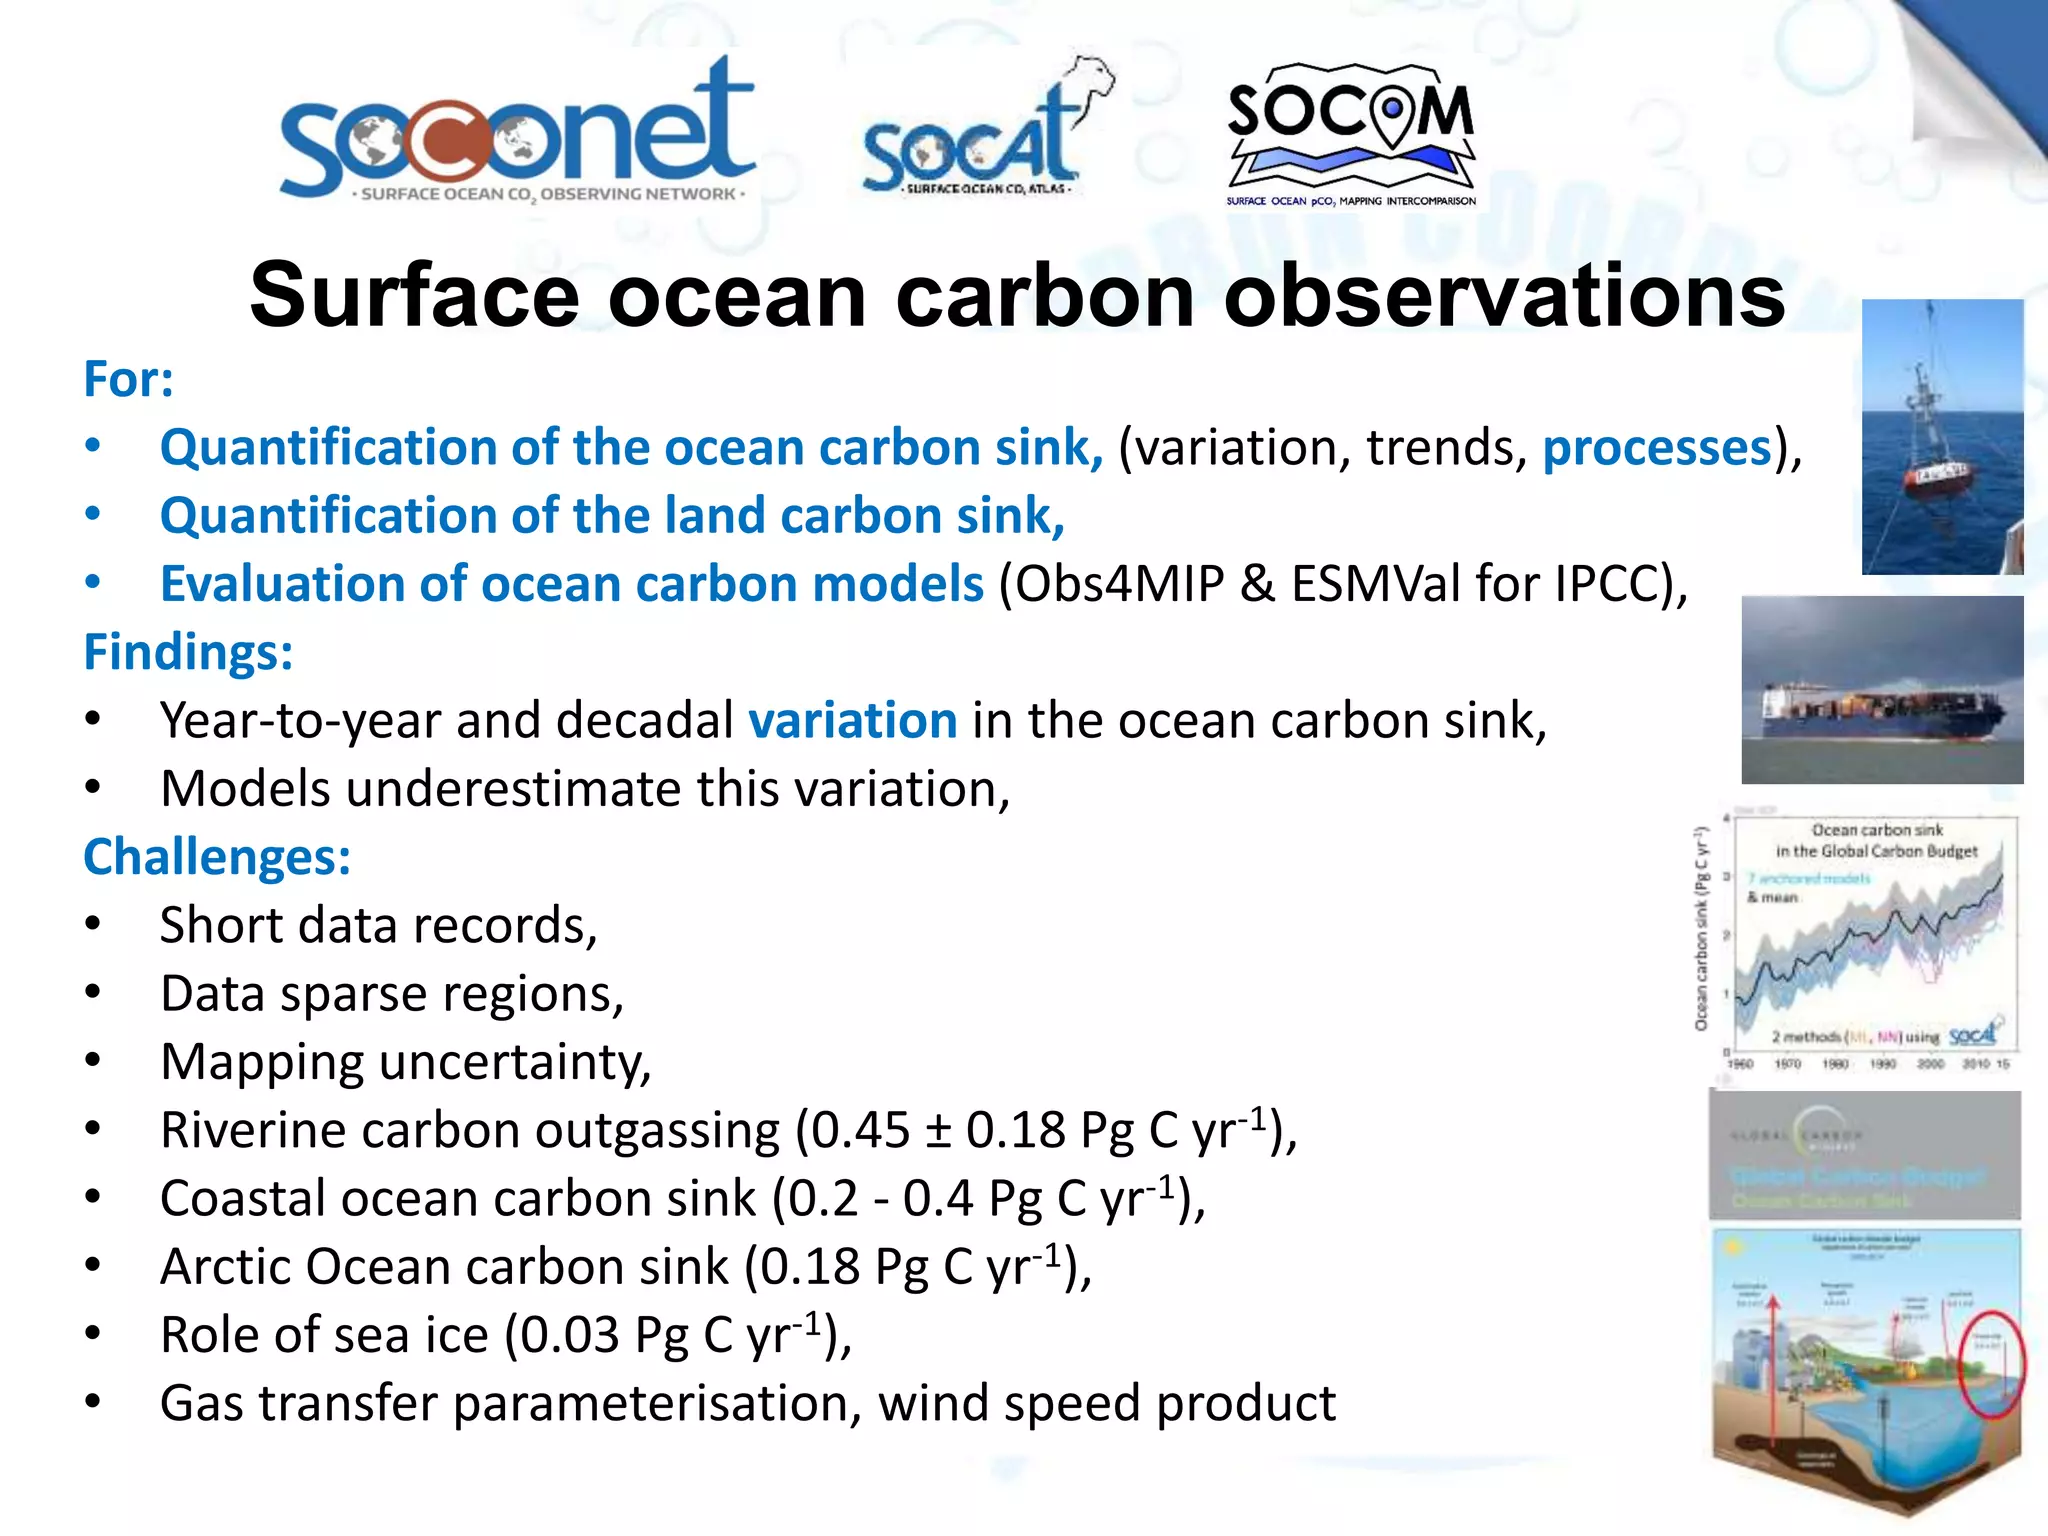
This document provides an overview and summary of a presentation on viewing ocean observations in a global context. It discusses requirements-driven ocean observations, high quality data collection, and delivering information to end users. The presentation covers topics like essential ocean variables, phenomena to monitor, scientific questions to address regarding climate change and human impacts on ocean biogeochemistry. It also discusses the role of organizations like GOOS and key conferences in coordinating global ocean observing efforts.


