Download as PDF, PPTX

![INPUT
[DATA]
PREDICTION
Machine
Learning](https://image.slidesharecdn.com/zlabeiarpcpresentation-240314161148-9ee71281/85/Explainable-AI-approach-for-evaluating-climate-models-in-the-Arctic-24-320.jpg)

![CLIMATE MODEL
MAP
[DATA]
Machine
Learning
CLASSIFICATION](https://image.slidesharecdn.com/zlabeiarpcpresentation-240314161148-9ee71281/85/Explainable-AI-approach-for-evaluating-climate-models-in-the-Arctic-28-320.jpg)
![CLASSIFICATION
Machine
Learning
CLIMATE MODEL
MAP
[DATA]](https://image.slidesharecdn.com/zlabeiarpcpresentation-240314161148-9ee71281/85/Explainable-AI-approach-for-evaluating-climate-models-in-the-Arctic-29-320.jpg)
![CLASSIFICATION
Machine
Learning
CLIMATE MODEL
MAP
[DATA]
Explainable AI
Learn new
science!](https://image.slidesharecdn.com/zlabeiarpcpresentation-240314161148-9ee71281/85/Explainable-AI-approach-for-evaluating-climate-models-in-the-Arctic-30-320.jpg)
![EXPLAINABLE AI (XAI)
THERE ARE MANY
METHODS
A bird!
XAI
[Adapted from Adebayo et al., 2020]](https://image.slidesharecdn.com/zlabeiarpcpresentation-240314161148-9ee71281/85/Explainable-AI-approach-for-evaluating-climate-models-in-the-Arctic-33-320.jpg)
![THERE ARE MANY
METHODS
EXPLAINABLE AI (XAI)
[Adapted from Adebayo et al., 2020]](https://image.slidesharecdn.com/zlabeiarpcpresentation-240314161148-9ee71281/85/Explainable-AI-approach-for-evaluating-climate-models-in-the-Arctic-34-320.jpg)
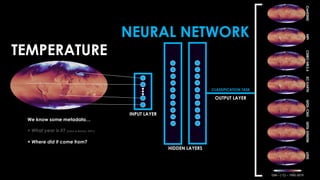
![Neural
Network
[0] La Niña [1] El Niño
Input a map of sea surface temperatures
[Toms et al. 2020, JAMES]](https://image.slidesharecdn.com/zlabeiarpcpresentation-240314161148-9ee71281/85/Explainable-AI-approach-for-evaluating-climate-models-in-the-Arctic-36-320.jpg)
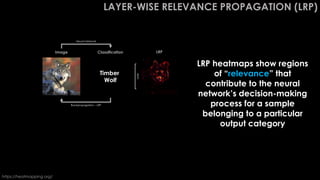
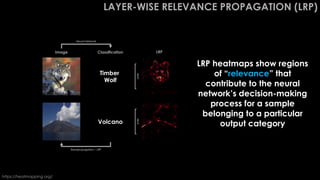
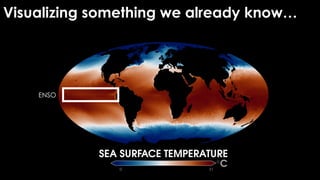
![Visualizing something we already know…
Input maps of sea surface
temperatures (SST) to
identify El Niño or La Niña
Use ‘LRP’ to see how the
neural network is making
its decision
[Toms et al. 2020, JAMES]
Layer-wise Relevance Propagation
Composite SST Observations
LRP [Relevance]
SST Anomaly [°C]
0.00 0.75
0.0 1.5
-1.5
Warmer
Colder
High
Low](https://image.slidesharecdn.com/zlabeiarpcpresentation-240314161148-9ee71281/85/Explainable-AI-approach-for-evaluating-climate-models-in-the-Arctic-37-320.jpg)

![APPLY SOFTMAX OPERATOR
IN THE OUTPUT LAYER
[ 0.71 ]
[ 0.05 ]
[ 0.01 ]
[ 0.01 ]
[ 0.03 ]
[ 0.11 ]
[ 0.08 ]
RANK
LABE AND BARNES 2022, ESS](https://image.slidesharecdn.com/zlabeiarpcpresentation-240314161148-9ee71281/85/Explainable-AI-approach-for-evaluating-climate-models-in-the-Arctic-41-320.jpg)
![APPLY SOFTMAX OPERATOR
IN THE OUTPUT LAYER
[ 0.71 ]
[ 0.05 ]
[ 0.01 ]
[ 0.01 ]
[ 0.03 ]
[ 0.11 ]
[ 0.08 ]
RANK
[ 1 ]
[ 4 ]
[ 7 ]
[ 6 ]
[ 5 ]
[ 2 ]
[ 3 ]
LABE AND BARNES 2022, ESS](https://image.slidesharecdn.com/zlabeiarpcpresentation-240314161148-9ee71281/85/Explainable-AI-approach-for-evaluating-climate-models-in-the-Arctic-42-320.jpg)
![APPLY SOFTMAX OPERATOR
IN THE OUTPUT LAYER
[ 0.71 ]
[ 0.05 ]
[ 0.01 ]
[ 0.01 ]
[ 0.03 ]
[ 0.11 ]
[ 0.08 ]
RANK
[ 1 ]
[ 4 ]
[ 7 ]
[ 6 ]
[ 5 ]
[ 2 ]
[ 3 ]
Confidence/Probability
LABE AND BARNES 2022, ESS](https://image.slidesharecdn.com/zlabeiarpcpresentation-240314161148-9ee71281/85/Explainable-AI-approach-for-evaluating-climate-models-in-the-Arctic-43-320.jpg)
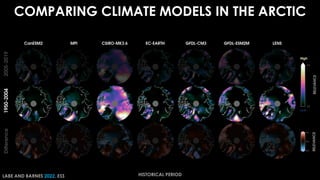
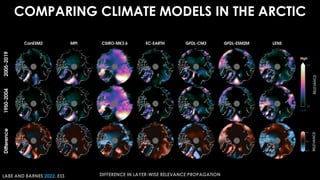
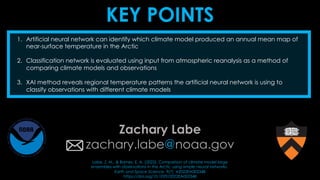

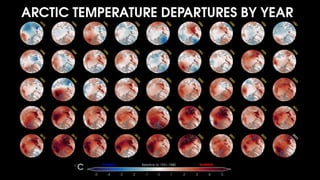
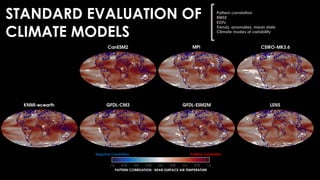
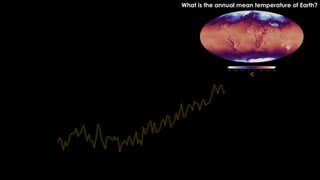
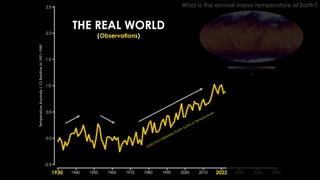
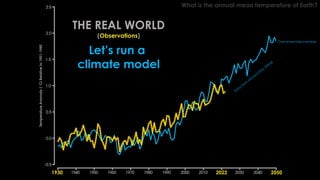
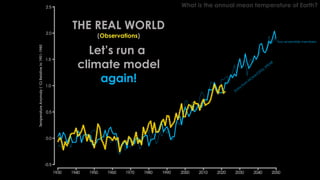
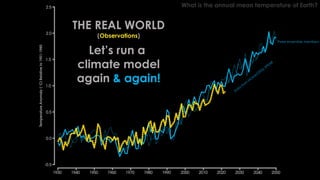
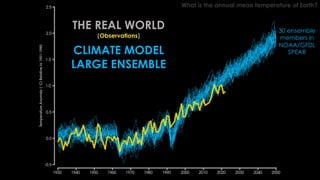
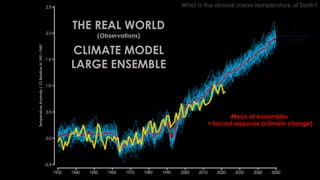
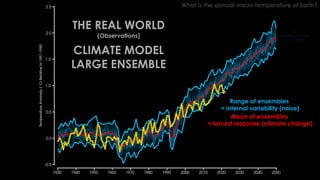
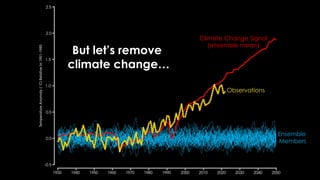
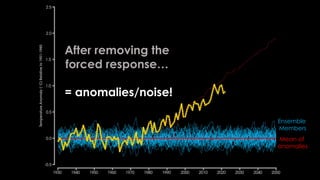
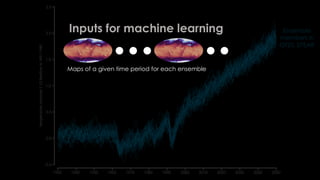
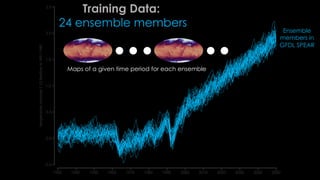
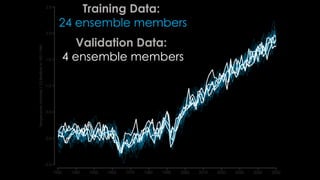
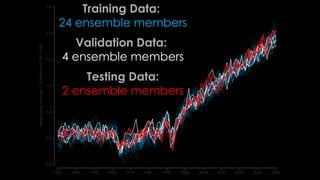
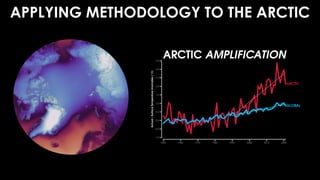
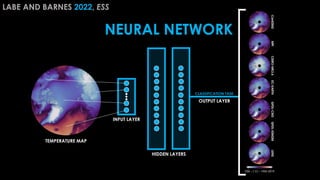
The document discusses an explainable AI approach for evaluating climate models in the Arctic, emphasizing the use of machine learning to enhance model accuracy and speed. It details how artificial neural networks can be employed to classify climate model outputs and compares them to actual observations, providing insights into temperature patterns. The methodology includes layer-wise relevance propagation to understand the decision-making processes of the neural networks implemented.


![ANIMAL_CELL_,_TISSUE_AND_ORGAN_CULTURE[1].pptx](https://cdn.slidesharecdn.com/ss_thumbnails/animalcelltissueandorganculture1-260204172026-4462b440-thumbnail.jpg?width=640&height=640&fit=bounds)


![Polymer [ बहुलक ] Chemistry Notes PDF - Irfanullah Mehar - JJ Sir Chemistry.pdf](https://cdn.slidesharecdn.com/ss_thumbnails/polymerchemistrynotespdf-irfanullahmehar-jjsirchemistry-260210172118-3f9b37f7-thumbnail.jpg?width=640&height=640&fit=bounds)

