Download to read offline
![INPUT
[DATA]
PREDICTION
Machine
Learning](https://image.slidesharecdn.com/zlabepresentationfsu2023-230205154045-2faa8349/85/Exploring-explainable-machine-learning-for-detecting-changes-in-climate-10-320.jpg)
![INPUT
[DATA]
PREDICTION
~Statistical
Algorithm~](https://image.slidesharecdn.com/zlabepresentationfsu2023-230205154045-2faa8349/85/Exploring-explainable-machine-learning-for-detecting-changes-in-climate-11-320.jpg)
![INPUT
[DATA]
PREDICTION
Machine
Learning](https://image.slidesharecdn.com/zlabepresentationfsu2023-230205154045-2faa8349/85/Exploring-explainable-machine-learning-for-detecting-changes-in-climate-12-320.jpg)
![X1
X2
INPUTS
Artificial Neural Networks [ANN]](https://image.slidesharecdn.com/zlabepresentationfsu2023-230205154045-2faa8349/85/Exploring-explainable-machine-learning-for-detecting-changes-in-climate-14-320.jpg)
![Linear regression!
Artificial Neural Networks [ANN]
X1
X2
W1
W2
∑ = X1W1+ X2W2 + b
INPUTS
NODE](https://image.slidesharecdn.com/zlabepresentationfsu2023-230205154045-2faa8349/85/Exploring-explainable-machine-learning-for-detecting-changes-in-climate-15-320.jpg)
![Artificial Neural Networks [ANN]
X1
X2
W1
W2
∑
INPUTS
NODE
Linear regression with non-linear
mapping by an “activation function”
Training of the network is merely
determining the weights “w” and
bias/offset “b"
= factivation(X1W1+ X2W2 + b)](https://image.slidesharecdn.com/zlabepresentationfsu2023-230205154045-2faa8349/85/Exploring-explainable-machine-learning-for-detecting-changes-in-climate-16-320.jpg)
![Artificial Neural Networks [ANN]
X1
X2
W1
W2
∑
INPUTS
NODE
= factivation(X1W1+ X2W2 + b)
ReLU Sigmoid Linear](https://image.slidesharecdn.com/zlabepresentationfsu2023-230205154045-2faa8349/85/Exploring-explainable-machine-learning-for-detecting-changes-in-climate-17-320.jpg)
![X1
X2
∑
inputs
HIDDEN LAYERS
X3
∑
∑
∑
OUTPUT
= predictions
Artificial Neural Networks [ANN]
: : ::
INPUTS](https://image.slidesharecdn.com/zlabepresentationfsu2023-230205154045-2faa8349/85/Exploring-explainable-machine-learning-for-detecting-changes-in-climate-18-320.jpg)
![Complexity and nonlinearities of the ANN allow it to learn many
different pathways of predictable behavior
Once trained, you have an array of weights and biases which can be
used for prediction on new data
INPUT
[DATA]
PREDICTION
Artificial Neural Networks [ANN]](https://image.slidesharecdn.com/zlabepresentationfsu2023-230205154045-2faa8349/85/Exploring-explainable-machine-learning-for-detecting-changes-in-climate-19-320.jpg)
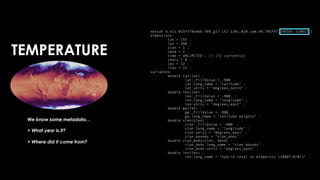
![We know some metadata…
+ What year is it?
+ Where did it come from?
[Labe and Barnes, 2022; ESS]
TEMPERATURE](https://image.slidesharecdn.com/zlabepresentationfsu2023-230205154045-2faa8349/85/Exploring-explainable-machine-learning-for-detecting-changes-in-climate-22-320.jpg)
![TEMPERATURE
Neural network learns nonlinear
combinations of forced climate
patterns to identify the year
We know some metadata…
+ What year is it?
+ Where did it come from?
[Labe and Barnes, 2022; ESS]](https://image.slidesharecdn.com/zlabepresentationfsu2023-230205154045-2faa8349/85/Exploring-explainable-machine-learning-for-detecting-changes-in-climate-23-320.jpg)
![----ANN----
2 Hidden Layers
10 Nodes each
Ridge Regularization
Early Stopping
[e.g., Barnes et al. 2019, 2020]
[e.g., Labe and Barnes, 2021]
TIMING OF EMERGENCE
(COMBINED VARIABLES)
RESPONSES TO
EXTERNAL CLIMATE
FORCINGS
PATTERNS OF
CLIMATE INDICATORS
[e.g., Rader et al. 2022]
Surface Temperature Map Precipitation Map
+
TEMPERATURE
We know some metadata…
+ What year is it?
+ Where did it come from?
[Labe and Barnes, 2022; ESS]](https://image.slidesharecdn.com/zlabepresentationfsu2023-230205154045-2faa8349/85/Exploring-explainable-machine-learning-for-detecting-changes-in-climate-24-320.jpg)
![----ANN----
2 Hidden Layers
10 Nodes each
Ridge Regularization
Early Stopping
[e.g., Barnes et al. 2019, 2020]
[e.g., Labe and Barnes, 2021]
TIMING OF EMERGENCE
(COMBINED VARIABLES)
RESPONSES TO
EXTERNAL CLIMATE
FORCINGS
PATTERNS OF
CLIMATE INDICATORS
Surface Temperature Map Precipitation Map
+
TEMPERATURE
[e.g., Rader et al. 2022]
We know some metadata…
+ What year is it?
+ Where did it come from?
[Labe and Barnes, 2022; ESS]](https://image.slidesharecdn.com/zlabepresentationfsu2023-230205154045-2faa8349/85/Exploring-explainable-machine-learning-for-detecting-changes-in-climate-25-320.jpg)
![Greenhouse gases fixed to 1920 levels
All forcings (CESM-LE)
Industrial aerosols fixed to 1920 levels
[Deser et al. 2020, JCLI]
Fully-coupled CESM1.1
20 Ensemble Members
Run from 1920-2080
Observations](https://image.slidesharecdn.com/zlabepresentationfsu2023-230205154045-2faa8349/85/Exploring-explainable-machine-learning-for-detecting-changes-in-climate-38-320.jpg)
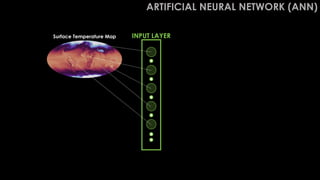
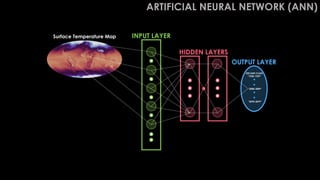
![INPUT LAYER
HIDDEN LAYERS
OUTPUT LAYER
Layer-wise Relevance Propagation
Surface Temperature Map
“2000-2009”
DECADE CLASS
“2070-2079”
“1920-1929”
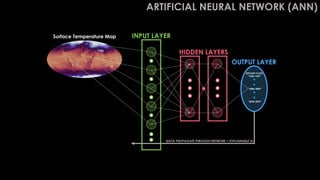
BACK-PROPAGATE THROUGH NETWORK = EXPLAINABLE AI
ARTIFICIAL NEURAL NETWORK (ANN)
[Barnes et al. 2020, JAMES]
[Labe and Barnes 2021, JAMES]](https://image.slidesharecdn.com/zlabepresentationfsu2023-230205154045-2faa8349/85/Exploring-explainable-machine-learning-for-detecting-changes-in-climate-44-320.jpg)
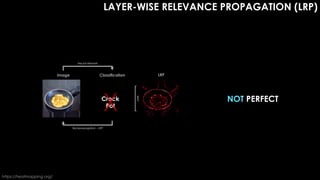
![[Adapted from Adebayo et al., 2020]
EXPLAINABLE AI IS
NOT PERFECT
THERE ARE MANY
METHODS](https://image.slidesharecdn.com/zlabepresentationfsu2023-230205154045-2faa8349/85/Exploring-explainable-machine-learning-for-detecting-changes-in-climate-49-320.jpg)
![[Adapted from Adebayo et al., 2020]
THERE ARE MANY
METHODS
EXPLAINABLE AI IS
NOT PERFECT](https://image.slidesharecdn.com/zlabepresentationfsu2023-230205154045-2faa8349/85/Exploring-explainable-machine-learning-for-detecting-changes-in-climate-50-320.jpg)
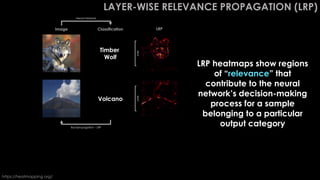
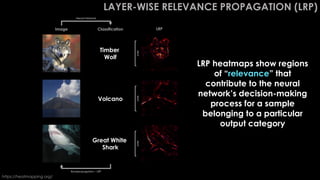
![Neural
Network
[0] La Niña [1] El Niño
[Toms et al. 2020, JAMES]
Input a map of sea surface temperatures](https://image.slidesharecdn.com/zlabepresentationfsu2023-230205154045-2faa8349/85/Exploring-explainable-machine-learning-for-detecting-changes-in-climate-52-320.jpg)
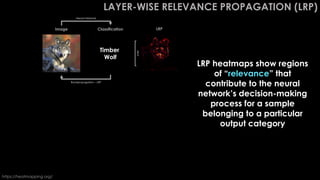
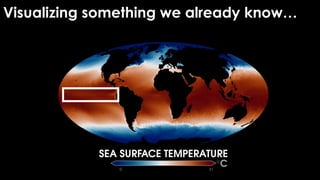
![Visualizing something we already know…
Input maps of sea surface
temperatures to identify
El Niño or La Niña
Use ‘LRP’ to see how the
neural network is making
its decision
[Toms et al. 2020, JAMES]
Layer-wise Relevance Propagation
Composite Observations
LRP [Relevance]
SST Anomaly [°C]
0.00 0.75
0.0 1.5
-1.5](https://image.slidesharecdn.com/zlabepresentationfsu2023-230205154045-2faa8349/85/Exploring-explainable-machine-learning-for-detecting-changes-in-climate-53-320.jpg)
![INPUT LAYER
HIDDEN LAYERS
OUTPUT LAYER
Layer-wise Relevance Propagation
Surface Temperature Map
“2000-2009”
DECADE CLASS
“2070-2079”
“1920-1929”
BACK-PROPAGATE THROUGH NETWORK = EXPLAINABLE AI
ARTIFICIAL NEURAL NETWORK (ANN)
[Barnes et al. 2020, JAMES]
[Labe and Barnes 2021, JAMES]](https://image.slidesharecdn.com/zlabepresentationfsu2023-230205154045-2faa8349/85/Exploring-explainable-machine-learning-for-detecting-changes-in-climate-54-320.jpg)
![1960-1999: ANNUAL MEAN TEMPERATURE TRENDS
Greenhouse gases fixed
to 1920 levels
[AEROSOLS PREVAIL]
Industrial aerosols fixed
to 1920 levels
[GREENHOUSE GASES PREVAIL]
All forcings
[STANDARD CESM-LE]
DATA](https://image.slidesharecdn.com/zlabepresentationfsu2023-230205154045-2faa8349/85/Exploring-explainable-machine-learning-for-detecting-changes-in-climate-55-320.jpg)
![1960-1999: ANNUAL MEAN TEMPERATURE TRENDS
Greenhouse gases fixed
to 1920 levels
[AEROSOLS PREVAIL]
Industrial aerosols fixed
to 1920 levels
[GREENHOUSE GASES PREVAIL]
All forcings
[STANDARD CESM-LE]
DATA](https://image.slidesharecdn.com/zlabepresentationfsu2023-230205154045-2faa8349/85/Exploring-explainable-machine-learning-for-detecting-changes-in-climate-56-320.jpg)
![1960-1999: ANNUAL MEAN TEMPERATURE TRENDS
Greenhouse gases fixed
to 1920 levels
[AEROSOLS PREVAIL]
Industrial aerosols fixed
to 1920 levels
[GREENHOUSE GASES PREVAIL]
All forcings
[STANDARD CESM-LE]
DATA](https://image.slidesharecdn.com/zlabepresentationfsu2023-230205154045-2faa8349/85/Exploring-explainable-machine-learning-for-detecting-changes-in-climate-57-320.jpg)
![1960-1999: ANNUAL MEAN TEMPERATURE TRENDS
Greenhouse gases fixed
to 1920 levels
[AEROSOLS PREVAIL]
Industrial aerosols fixed
to 1920 levels
[GREENHOUSE GASES PREVAIL]
All forcings
[STANDARD CESM-LE]
DATA](https://image.slidesharecdn.com/zlabepresentationfsu2023-230205154045-2faa8349/85/Exploring-explainable-machine-learning-for-detecting-changes-in-climate-58-320.jpg)
![CLIMATE MODEL DATA PREDICT THE YEAR FROM MAPS OF TEMPERATURE
AEROSOLS
PREVAIL
GREENHOUSE GASES
PREVAIL
STANDARD
CLIMATE MODEL
[Labe and Barnes 2021, JAMES]](https://image.slidesharecdn.com/zlabepresentationfsu2023-230205154045-2faa8349/85/Exploring-explainable-machine-learning-for-detecting-changes-in-climate-59-320.jpg)
![OBSERVATIONS PREDICT THE YEAR FROM MAPS OF TEMPERATURE
AEROSOLS
PREVAIL
GREENHOUSE GASES
PREVAIL
STANDARD
CLIMATE MODEL
[Labe and Barnes 2021, JAMES]](https://image.slidesharecdn.com/zlabepresentationfsu2023-230205154045-2faa8349/85/Exploring-explainable-machine-learning-for-detecting-changes-in-climate-60-320.jpg)
![OBSERVATIONS
SLOPES
PREDICT THE YEAR FROM MAPS OF TEMPERATURE
AEROSOLS
PREVAIL
GREENHOUSE GASES
PREVAIL
STANDARD
CLIMATE MODEL
[Labe and Barnes 2021, JAMES]](https://image.slidesharecdn.com/zlabepresentationfsu2023-230205154045-2faa8349/85/Exploring-explainable-machine-learning-for-detecting-changes-in-climate-61-320.jpg)
![RESULTS FROM LRP
[Labe and Barnes 2021, JAMES]
Low High](https://image.slidesharecdn.com/zlabepresentationfsu2023-230205154045-2faa8349/85/Exploring-explainable-machine-learning-for-detecting-changes-in-climate-64-320.jpg)
![RESULTS FROM LRP
[Labe and Barnes 2021, JAMES]
Low High](https://image.slidesharecdn.com/zlabepresentationfsu2023-230205154045-2faa8349/85/Exploring-explainable-machine-learning-for-detecting-changes-in-climate-65-320.jpg)
![RESULTS FROM LRP
[Labe and Barnes 2021, JAMES]
Low High](https://image.slidesharecdn.com/zlabepresentationfsu2023-230205154045-2faa8349/85/Exploring-explainable-machine-learning-for-detecting-changes-in-climate-66-320.jpg)
![RESULTS FROM LRP
[Labe and Barnes 2021, JAMES]
Low High](https://image.slidesharecdn.com/zlabepresentationfsu2023-230205154045-2faa8349/85/Exploring-explainable-machine-learning-for-detecting-changes-in-climate-67-320.jpg)
![Higher LRP values indicate greater relevance
for the ANN’s prediction
AVERAGED OVER 1960-2039
Aerosol-driven
Greenhouse gas-driven
All forcings
Low High
[Labe and Barnes 2021, JAMES]](https://image.slidesharecdn.com/zlabepresentationfsu2023-230205154045-2faa8349/85/Exploring-explainable-machine-learning-for-detecting-changes-in-climate-68-320.jpg)
![Greenhouse gas-driven
Aerosol-driven
All forcings
AVERAGED OVER 1960-2039
[Labe and Barnes 2021, JAMES]](https://image.slidesharecdn.com/zlabepresentationfsu2023-230205154045-2faa8349/85/Exploring-explainable-machine-learning-for-detecting-changes-in-climate-69-320.jpg)
![Select one ensemble
member and calculate
the annual mean
global mean surface
temperature (GMST)
2-m TEMPERATURE
ANOMALY
[Labe and Barnes, 2022; GRL]](https://image.slidesharecdn.com/zlabepresentationfsu2023-230205154045-2faa8349/85/Exploring-explainable-machine-learning-for-detecting-changes-in-climate-82-320.jpg)
![Calculate 10-year
moving (linear) trends
2-m TEMPERATURE
ANOMALY
[Labe and Barnes, 2022; GRL]](https://image.slidesharecdn.com/zlabepresentationfsu2023-230205154045-2faa8349/85/Exploring-explainable-machine-learning-for-detecting-changes-in-climate-83-320.jpg)
![Plot the slope of the
linear trends
START OF 10-YEAR
TEMPERATURE TREND
2-m TEMPERATURE
ANOMALY
[Labe and Barnes, 2022; GRL]](https://image.slidesharecdn.com/zlabepresentationfsu2023-230205154045-2faa8349/85/Exploring-explainable-machine-learning-for-detecting-changes-in-climate-84-320.jpg)
![Calculate a threshold
for defining a slowdown
in decadal warming
[Labe and Barnes, 2022; GRL]](https://image.slidesharecdn.com/zlabepresentationfsu2023-230205154045-2faa8349/85/Exploring-explainable-machine-learning-for-detecting-changes-in-climate-85-320.jpg)
![Repeat this exercise for
each ensemble
member in CESM2-LE
[Labe and Barnes, 2022; GRL]](https://image.slidesharecdn.com/zlabepresentationfsu2023-230205154045-2faa8349/85/Exploring-explainable-machine-learning-for-detecting-changes-in-climate-86-320.jpg)
![Compare warming
slowdowns with
reanalysis (ERA5)
[Labe and Barnes, 2022; GRL]](https://image.slidesharecdn.com/zlabepresentationfsu2023-230205154045-2faa8349/85/Exploring-explainable-machine-learning-for-detecting-changes-in-climate-87-320.jpg)
![[Labe and Barnes, 2022; GRL]](https://image.slidesharecdn.com/zlabepresentationfsu2023-230205154045-2faa8349/85/Exploring-explainable-machine-learning-for-detecting-changes-in-climate-88-320.jpg)
![OCEAN HEAT CONTENT – 100 M
Start with anomalous ocean heat…
[Labe and Barnes, 2022; GRL]](https://image.slidesharecdn.com/zlabepresentationfsu2023-230205154045-2faa8349/85/Exploring-explainable-machine-learning-for-detecting-changes-in-climate-89-320.jpg)
![OCEAN HEAT CONTENT – 100 M
INPUT LAYER
Start with anomalous ocean heat…
[Labe and Barnes, 2022; GRL]](https://image.slidesharecdn.com/zlabepresentationfsu2023-230205154045-2faa8349/85/Exploring-explainable-machine-learning-for-detecting-changes-in-climate-90-320.jpg)
![OCEAN HEAT CONTENT – 100 M
INPUT LAYER
HIDDEN LAYERS
OUTPUT LAYER
YES
SLOWDOWN
NO
SLOWDOWN
Will a slowdown begin?
[Labe and Barnes, 2022; GRL]](https://image.slidesharecdn.com/zlabepresentationfsu2023-230205154045-2faa8349/85/Exploring-explainable-machine-learning-for-detecting-changes-in-climate-91-320.jpg)
![OCEAN HEAT CONTENT – 100 M
INPUT LAYER
HIDDEN LAYERS
OUTPUT LAYER
YES
SLOWDOWN
NO
SLOWDOWN
BACK-PROPAGATE THROUGH NETWORK = EXPLAINABLE AI
LAYER-WISE RELEVANCE PROPAGATION
Will a slowdown begin?
[Labe and Barnes, 2022; GRL]](https://image.slidesharecdn.com/zlabepresentationfsu2023-230205154045-2faa8349/85/Exploring-explainable-machine-learning-for-detecting-changes-in-climate-92-320.jpg)
![So how well does the neural network do?
[Labe and Barnes, 2022; GRL]](https://image.slidesharecdn.com/zlabepresentationfsu2023-230205154045-2faa8349/85/Exploring-explainable-machine-learning-for-detecting-changes-in-climate-93-320.jpg)
![Low High Colder Warmer
[Labe and Barnes, 2022; GRL]](https://image.slidesharecdn.com/zlabepresentationfsu2023-230205154045-2faa8349/85/Exploring-explainable-machine-learning-for-detecting-changes-in-climate-94-320.jpg)
![Low High Colder Warmer
[Labe and Barnes, 2022; GRL]](https://image.slidesharecdn.com/zlabepresentationfsu2023-230205154045-2faa8349/85/Exploring-explainable-machine-learning-for-detecting-changes-in-climate-95-320.jpg)
![Low High Colder Warmer
[Labe and Barnes, 2022; GRL]](https://image.slidesharecdn.com/zlabepresentationfsu2023-230205154045-2faa8349/85/Exploring-explainable-machine-learning-for-detecting-changes-in-climate-96-320.jpg)
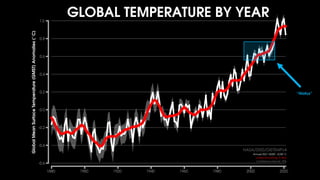
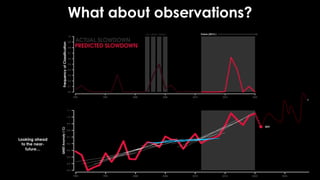
![What about observations?
Future (2012-)
so-called “hiatus”
Comparing
observations to
the IPO
[Labe and Barnes, 2022; GRL]](https://image.slidesharecdn.com/zlabepresentationfsu2023-230205154045-2faa8349/85/Exploring-explainable-machine-learning-for-detecting-changes-in-climate-97-320.jpg)
![What about observations?
Colder Warmer
[2003, 2004] [2016, 2017]
[Labe and Barnes, 2022; GRL]](https://image.slidesharecdn.com/zlabepresentationfsu2023-230205154045-2faa8349/85/Exploring-explainable-machine-learning-for-detecting-changes-in-climate-99-320.jpg)
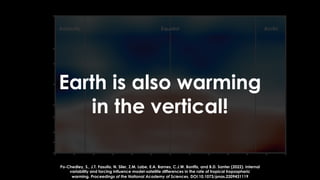
![[Po-Chedley
et
al.
2022,
PNAS]
PREDICT:
INTERNAL + EXTERNAL
COMPONENTS](https://image.slidesharecdn.com/zlabepresentationfsu2023-230205154045-2faa8349/85/Exploring-explainable-machine-learning-for-detecting-changes-in-climate-105-320.jpg)
![[Po-Chedley et al. 2022, PNAS]
Partial least squares regression with CMIP6 large ensembles (test observations)](https://image.slidesharecdn.com/zlabepresentationfsu2023-230205154045-2faa8349/85/Exploring-explainable-machine-learning-for-detecting-changes-in-climate-106-320.jpg)
![[Po-Chedley et al. 2022, PNAS]
UNDERSTANDING OUR
PREDICTIONS
–
Patterns of internal variability
(e.g., Interdecadal Pacific
Oscillation)](https://image.slidesharecdn.com/zlabepresentationfsu2023-230205154045-2faa8349/85/Exploring-explainable-machine-learning-for-detecting-changes-in-climate-107-320.jpg)
![[Po-Chedley et al. 2022, PNAS]](https://image.slidesharecdn.com/zlabepresentationfsu2023-230205154045-2faa8349/85/Exploring-explainable-machine-learning-for-detecting-changes-in-climate-108-320.jpg)
![INPUT
[DATA]
PREDICTION
Machine
Learning
Explainable AI
Learn new
science!](https://image.slidesharecdn.com/zlabepresentationfsu2023-230205154045-2faa8349/85/Exploring-explainable-machine-learning-for-detecting-changes-in-climate-109-320.jpg)

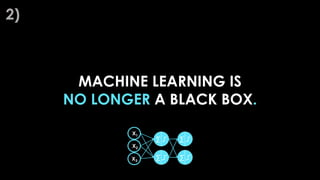
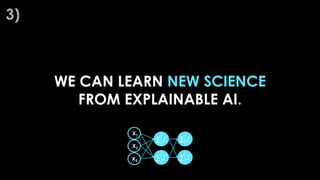
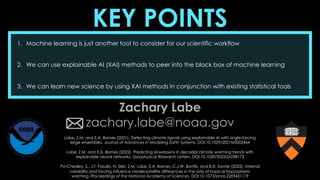

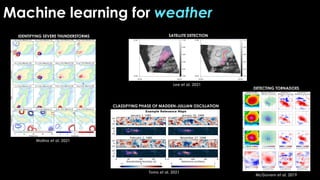
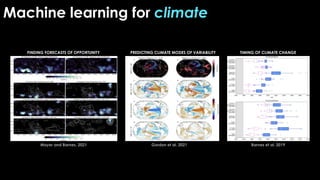
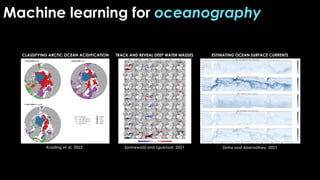
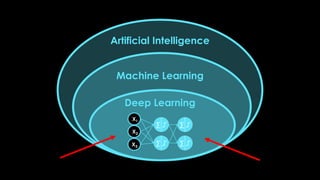
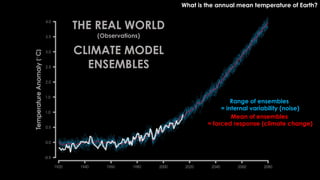
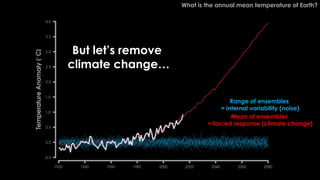
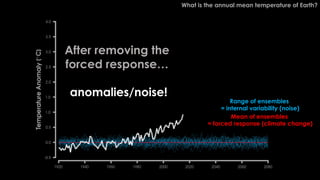
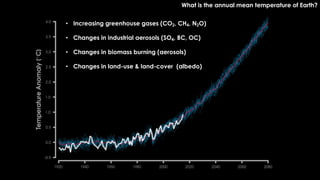
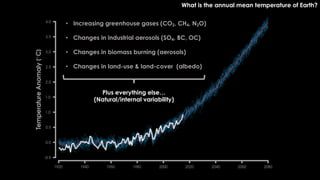
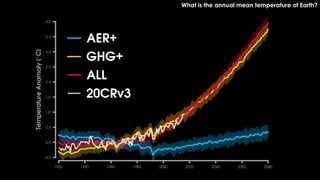
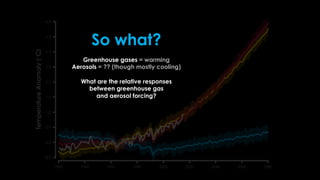
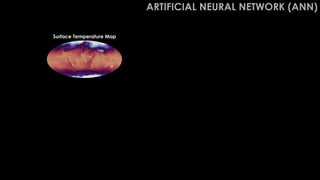
The document discusses the application of machine learning in climate science, particularly focusing on its ability to detect and analyze climate changes. It highlights the potential of explainable artificial intelligence (AI) techniques, such as artificial neural networks, to reveal deep insights into climate patterns and variability. Furthermore, it emphasizes the importance of using machine learning to enhance the accuracy and efficiency of climate models while addressing uncertainties in climate predictions.