Download to read offline

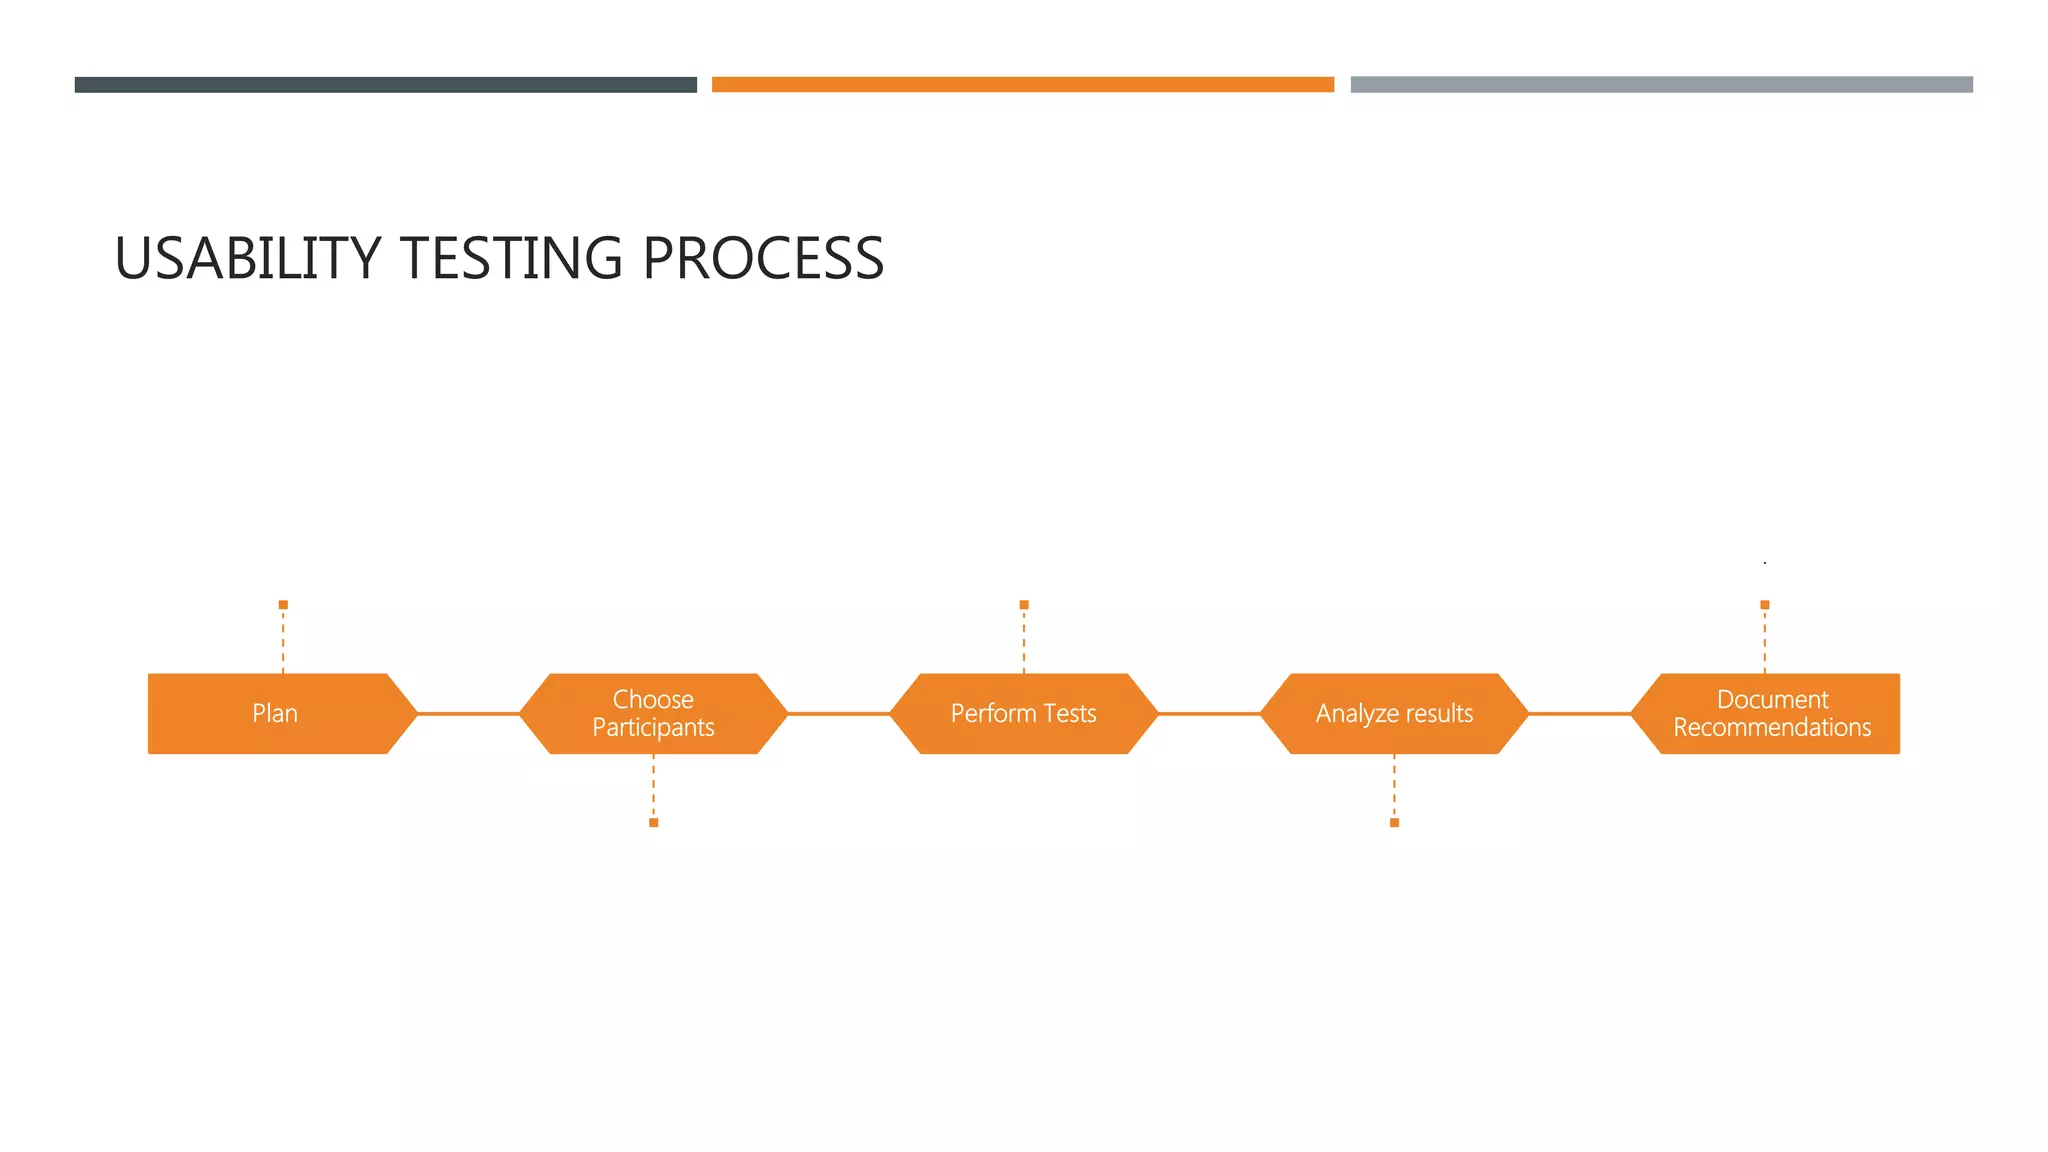
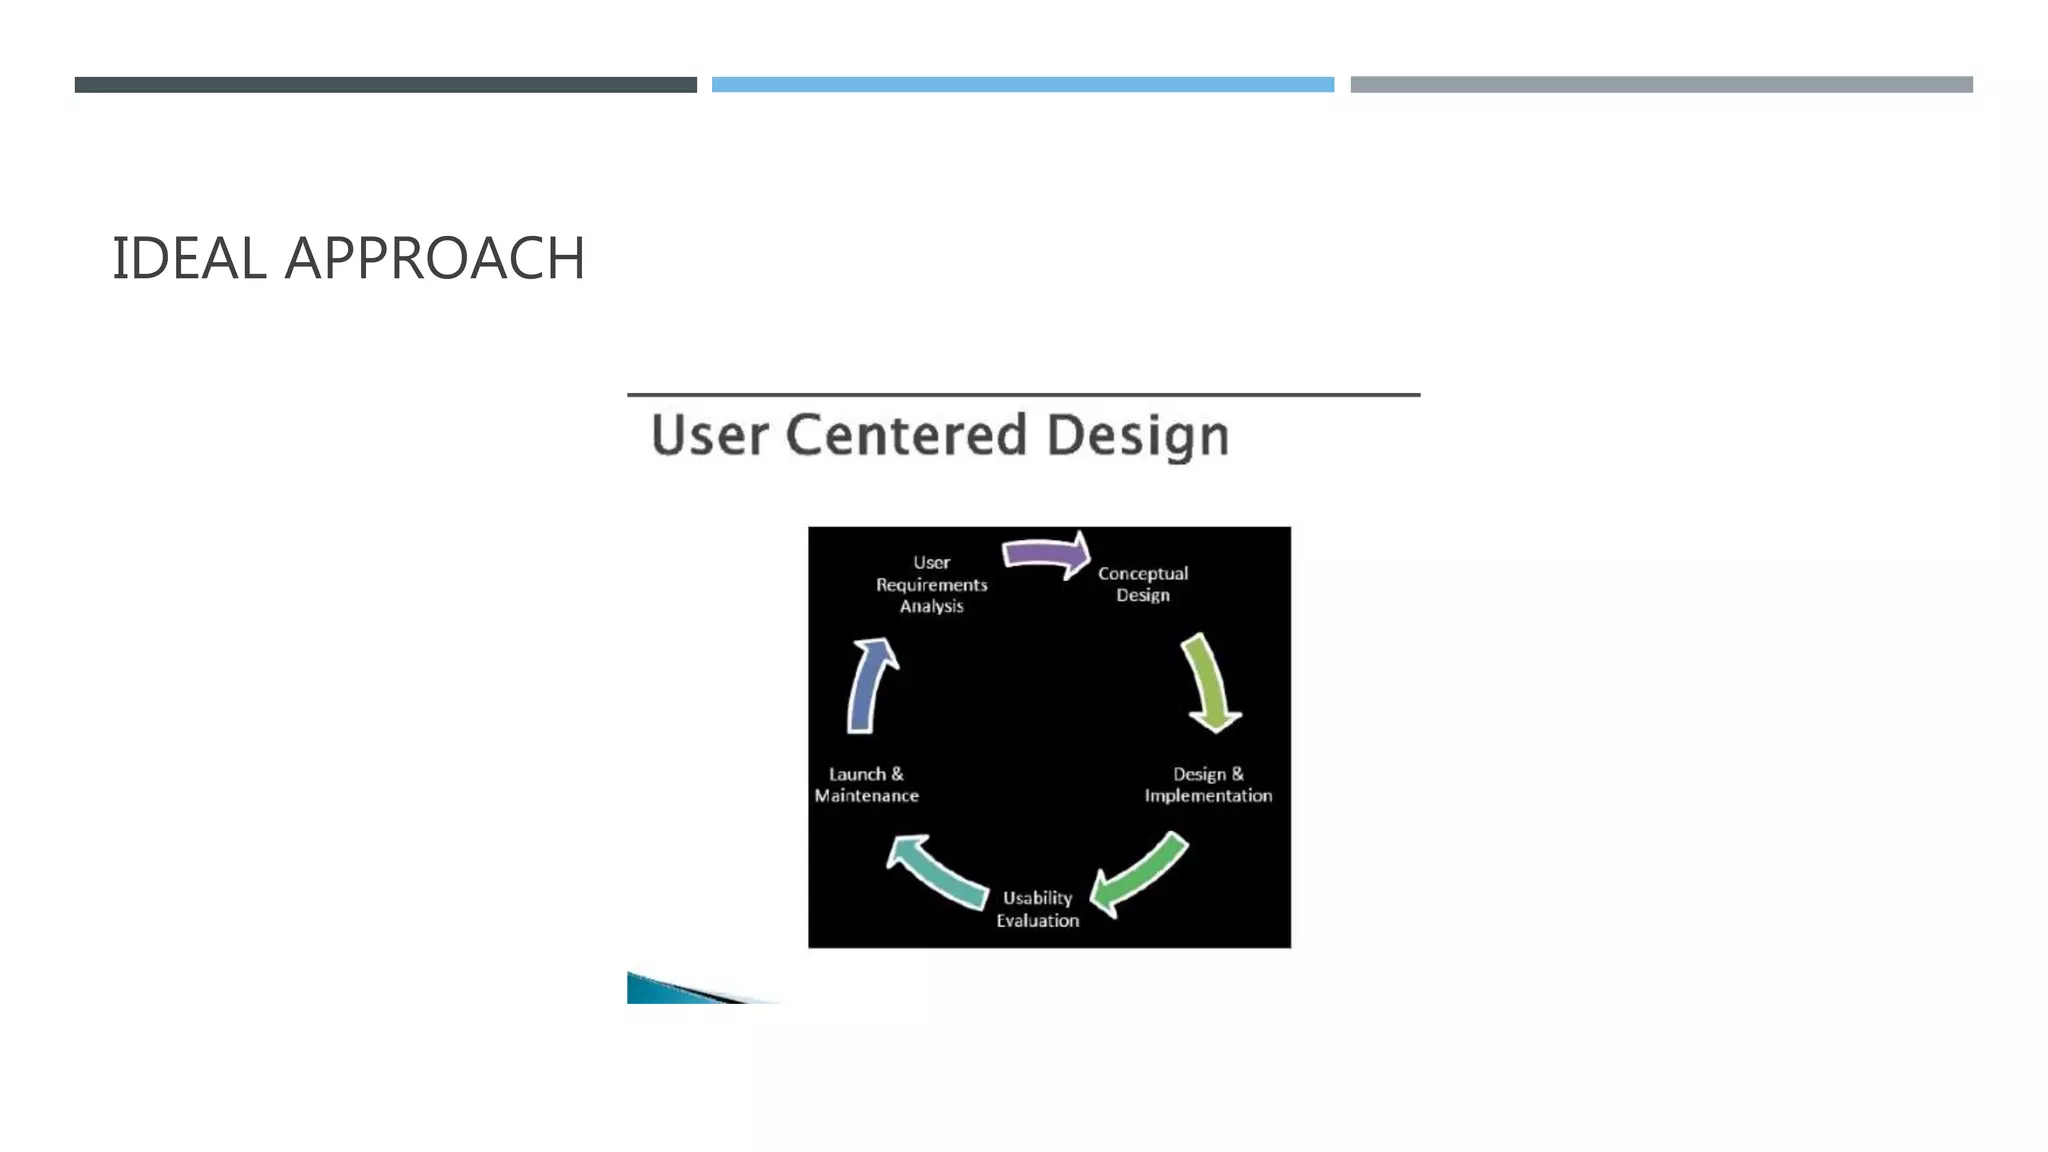
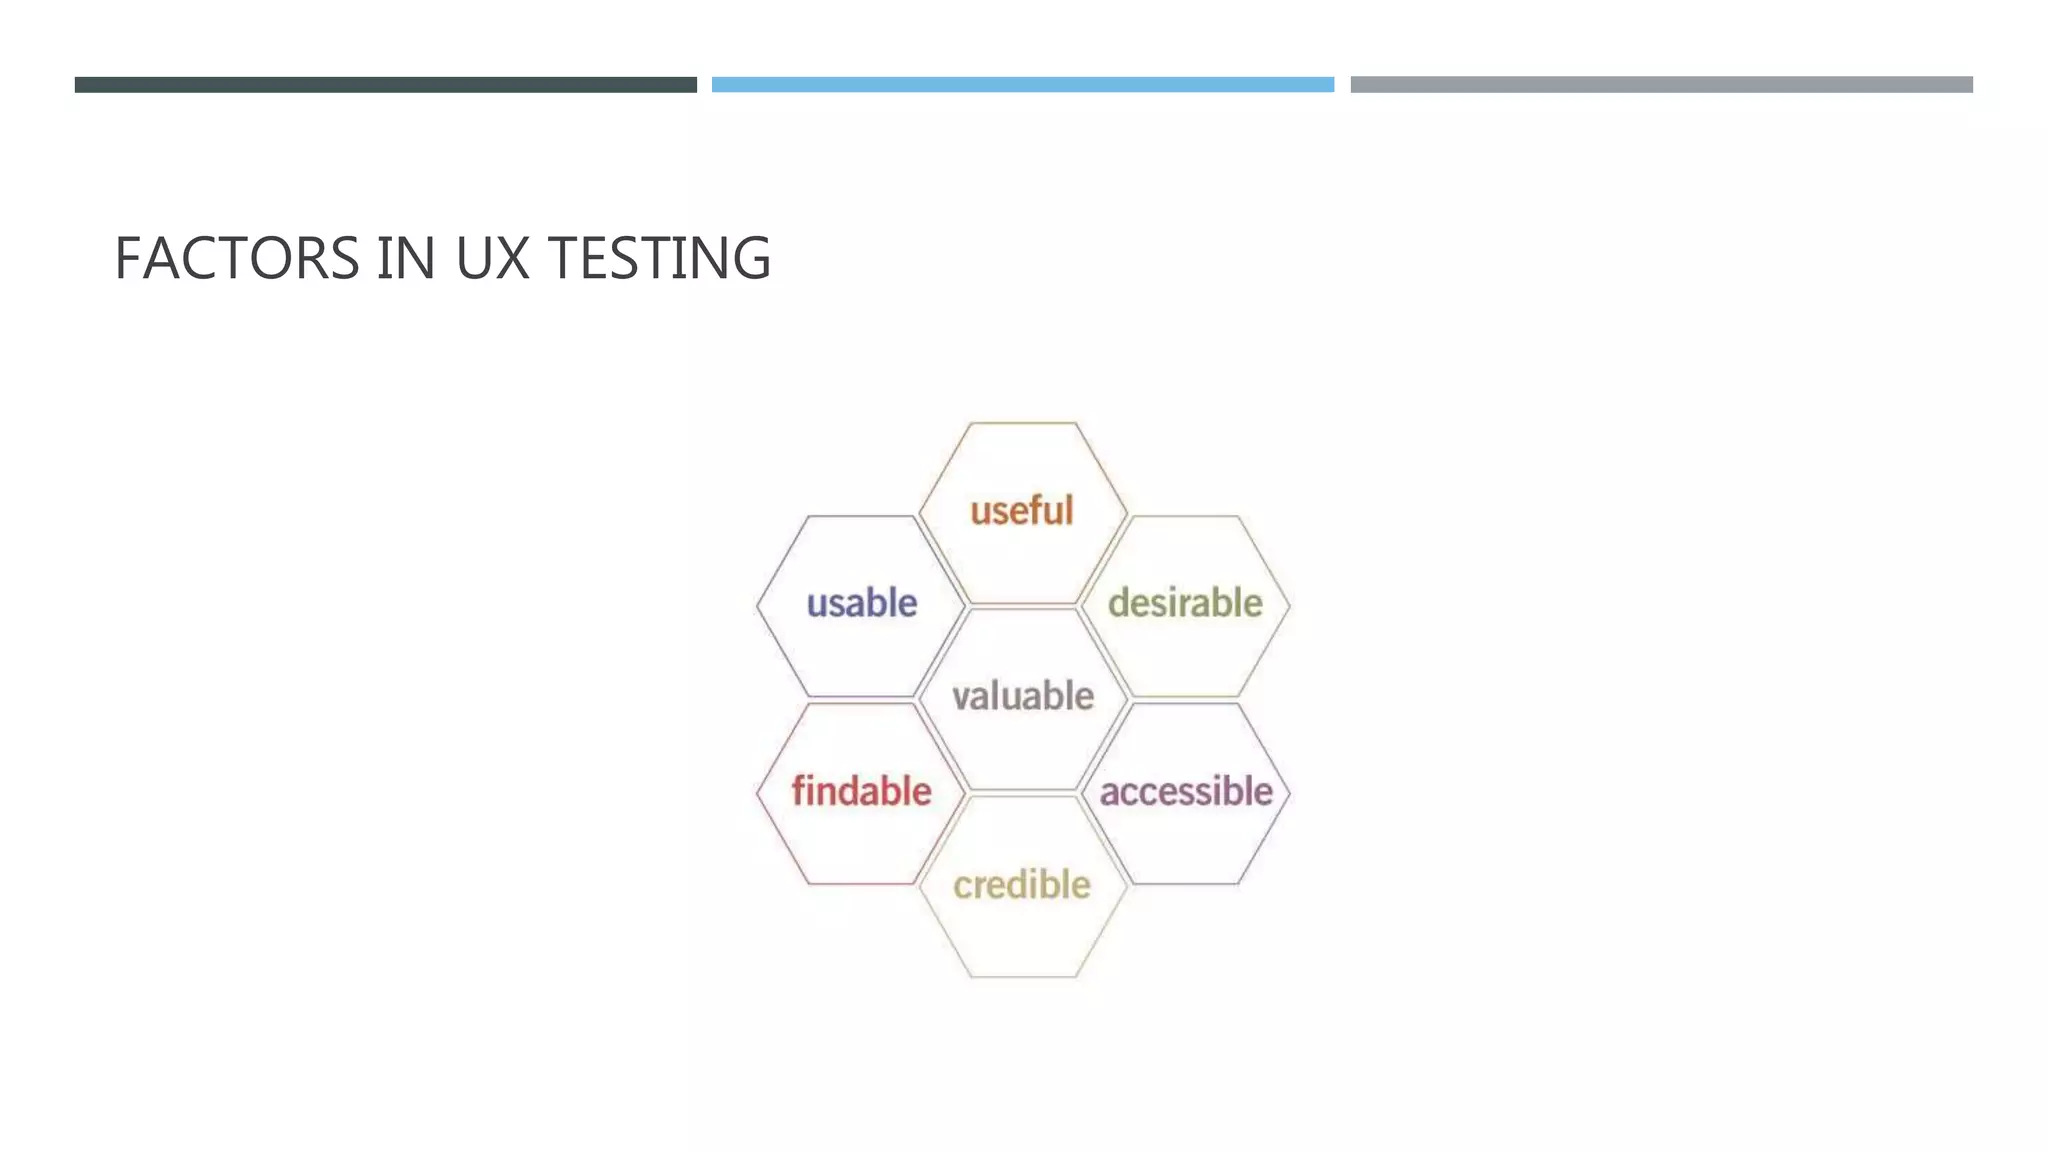

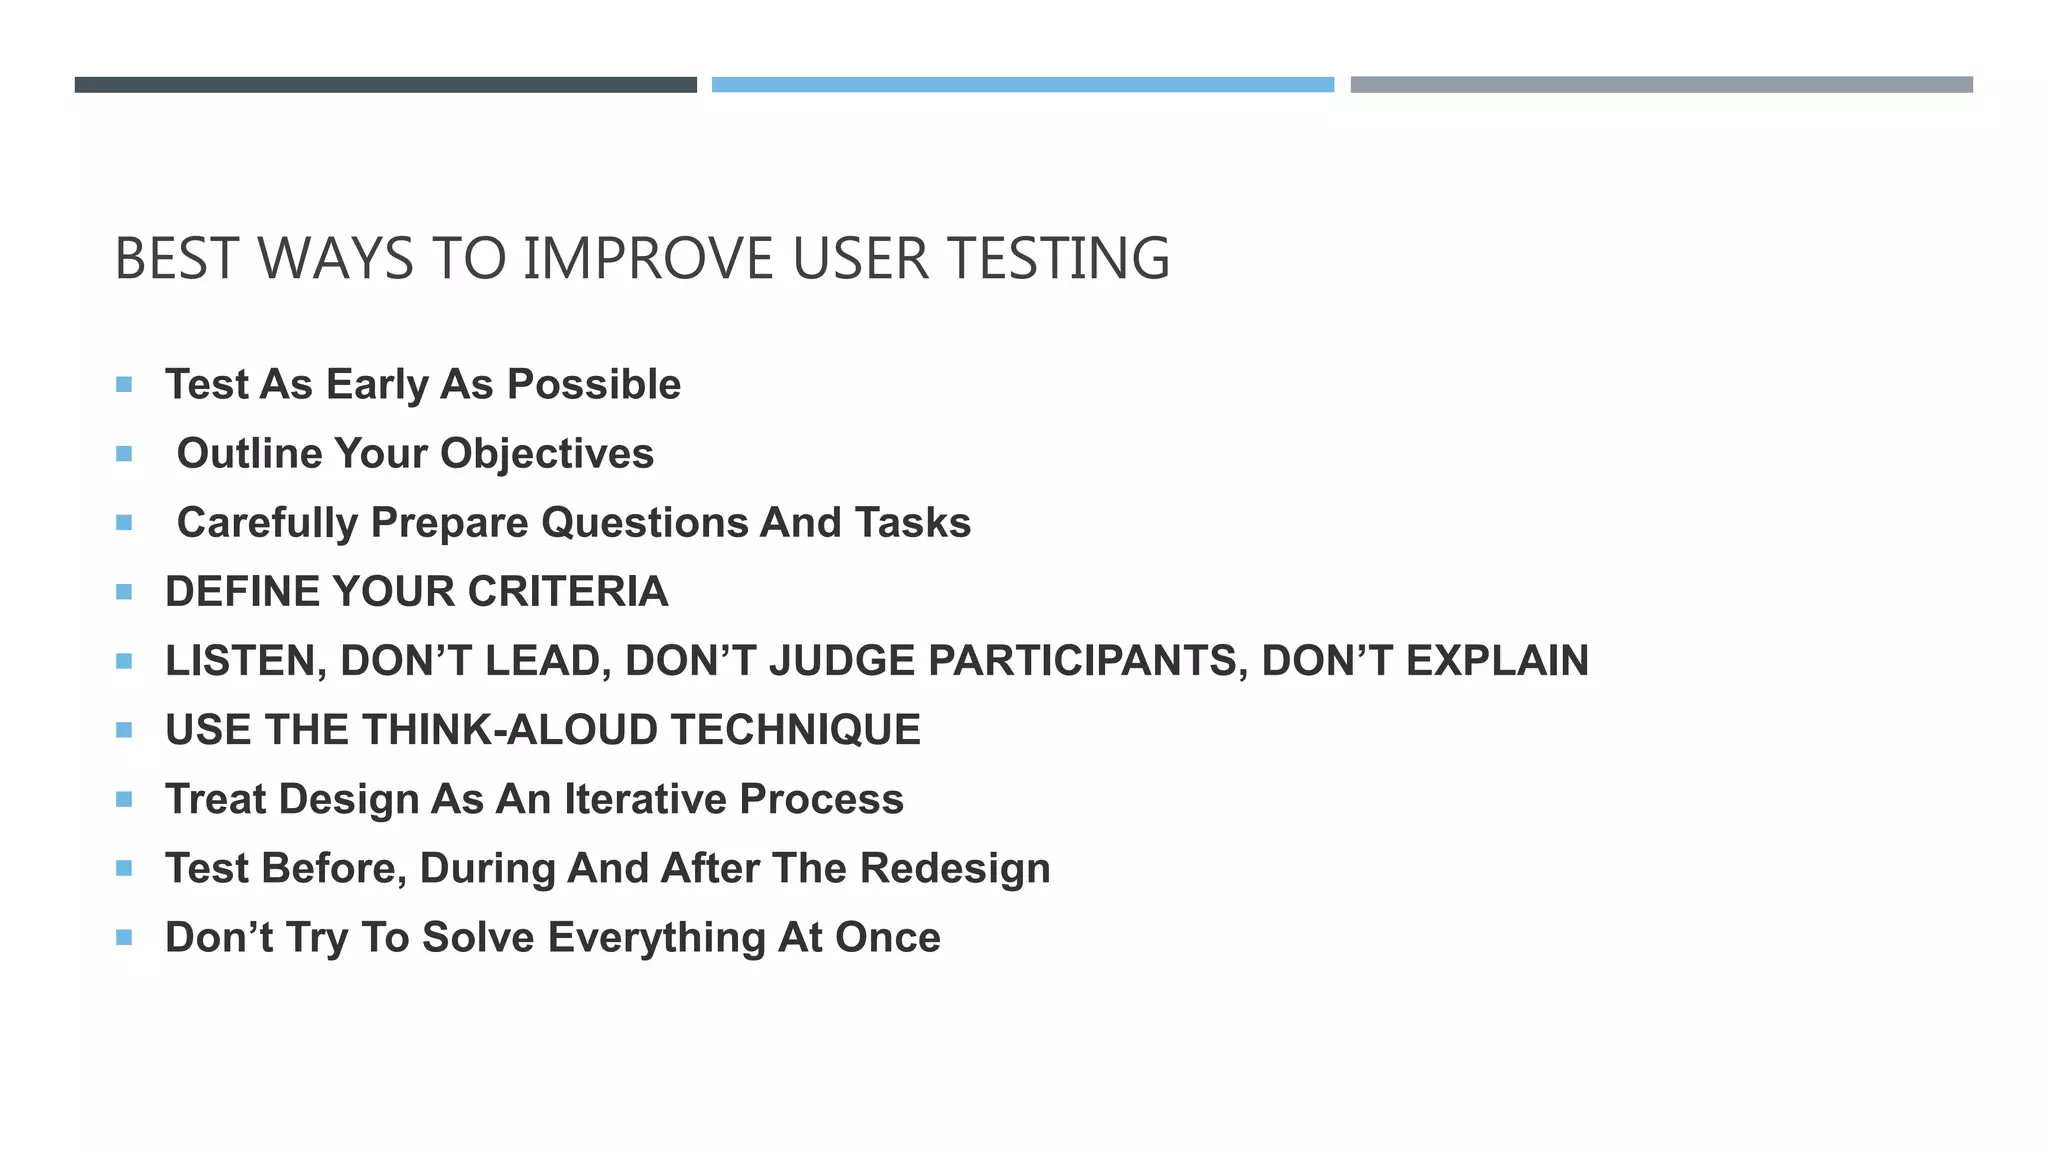

Usability testing is a technique used in user-centered design to evaluate a product by testing it on real users. This provides direct feedback on how users interact with the system. An effective usability testing process involves planning tests, choosing participants, performing tests, analyzing results, and documenting recommendations. Key factors in usability testing include defining objectives, preparing questions and tasks, listening without judgment, and treating the design process iteratively. Common metrics for measuring usability are effectiveness, efficiency, and satisfaction.