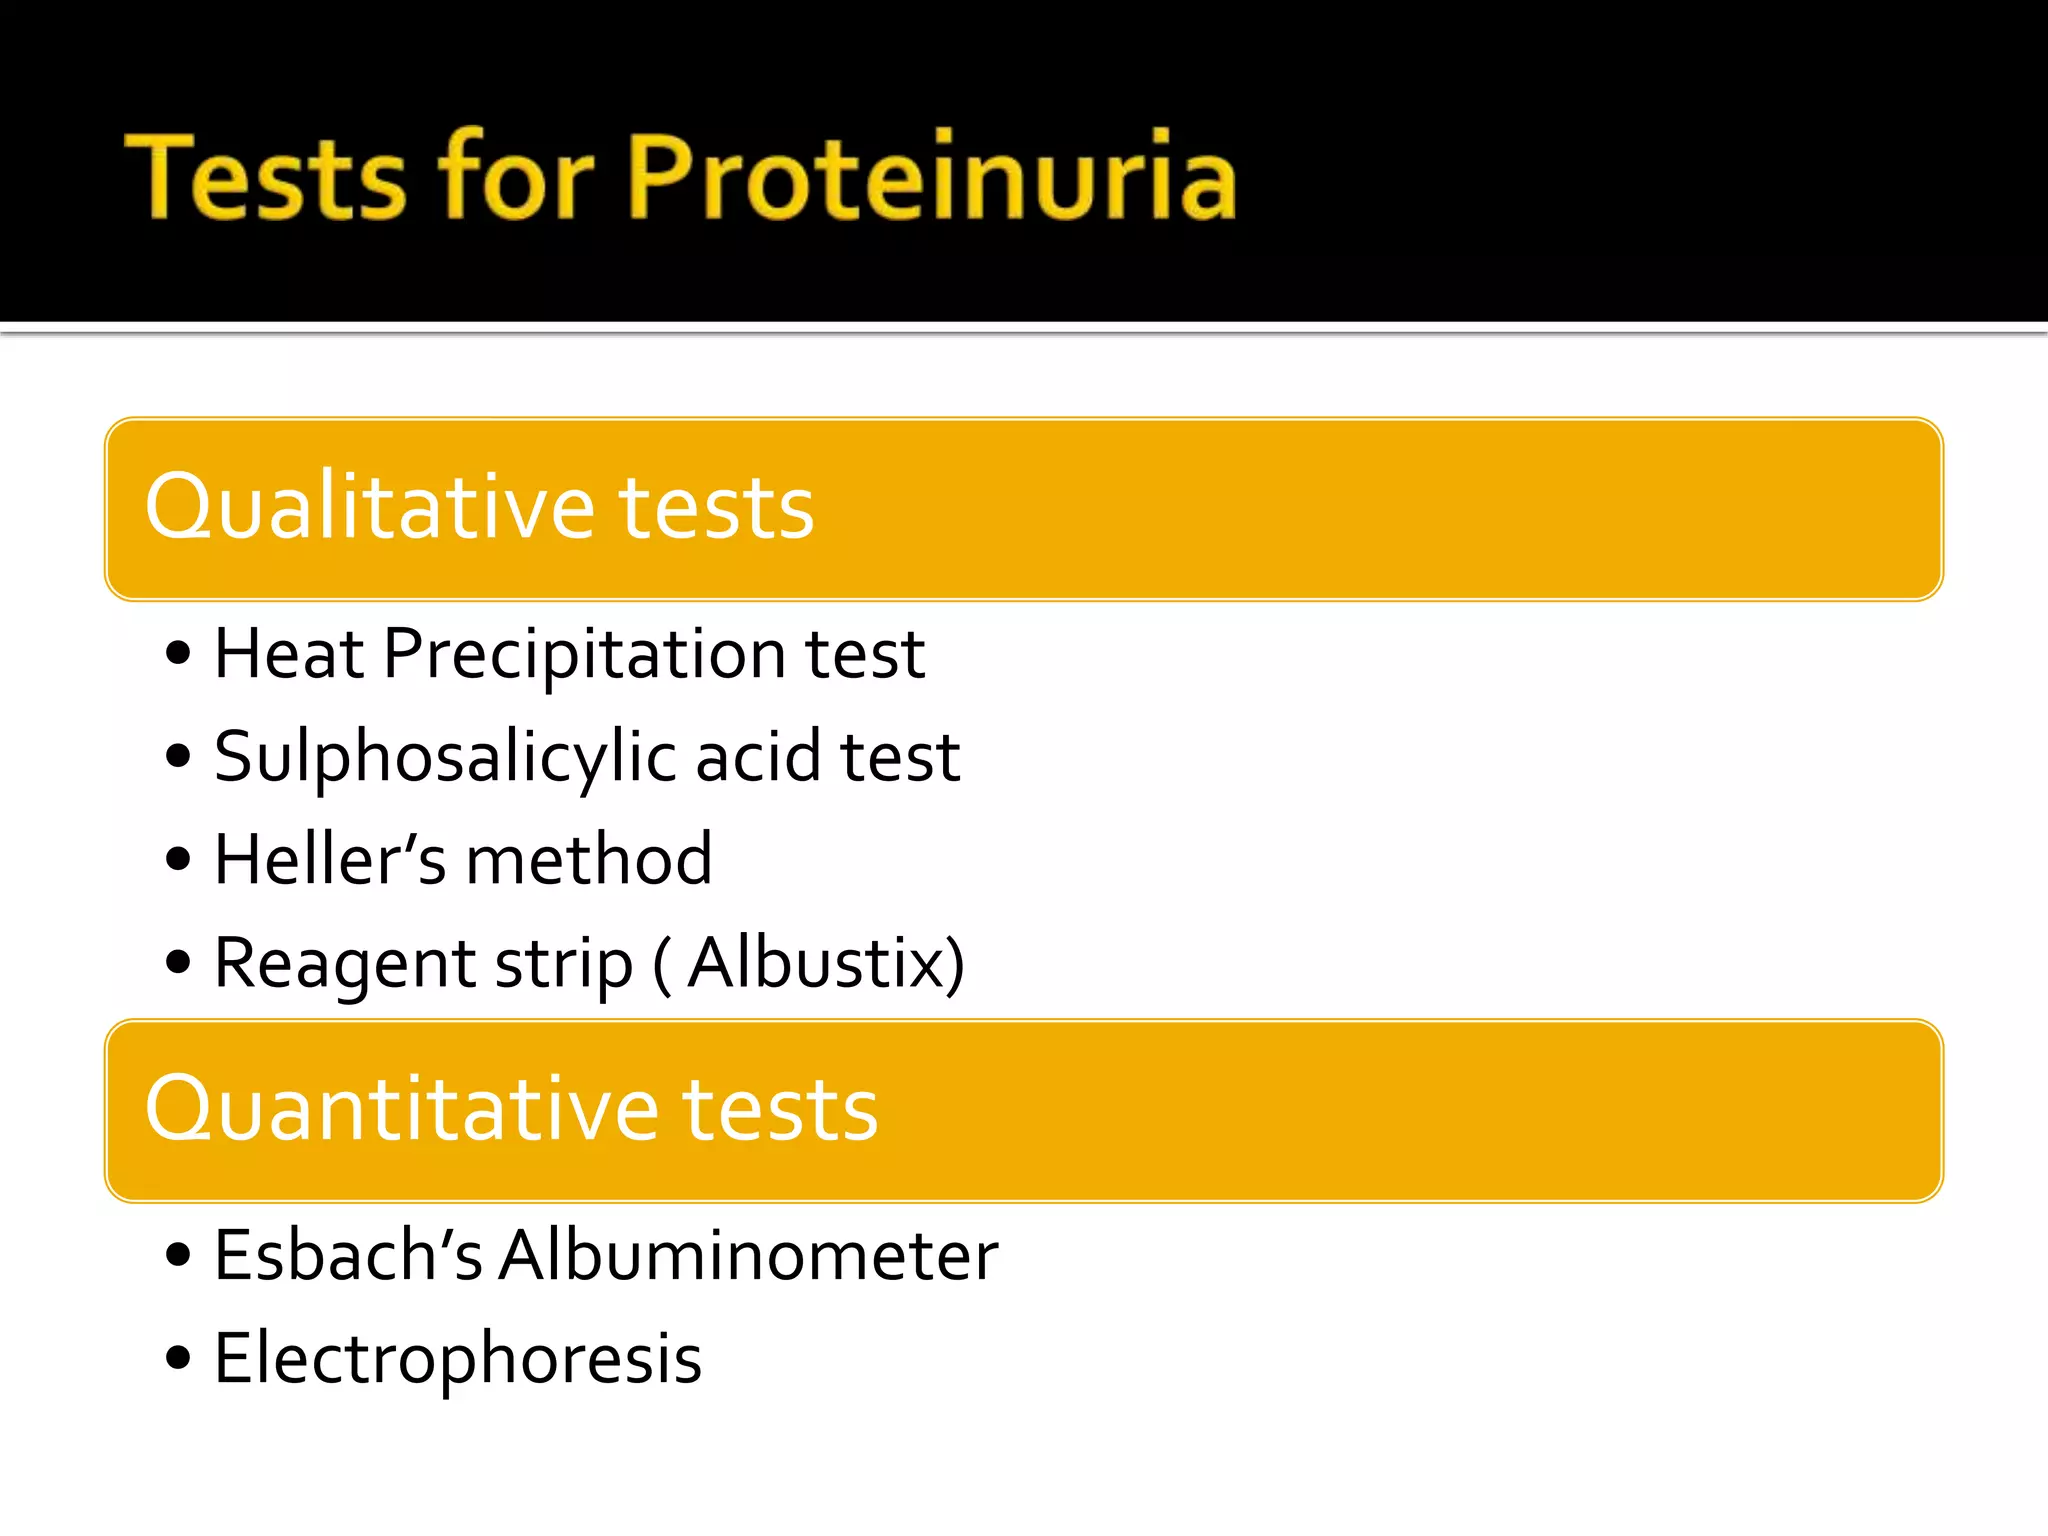
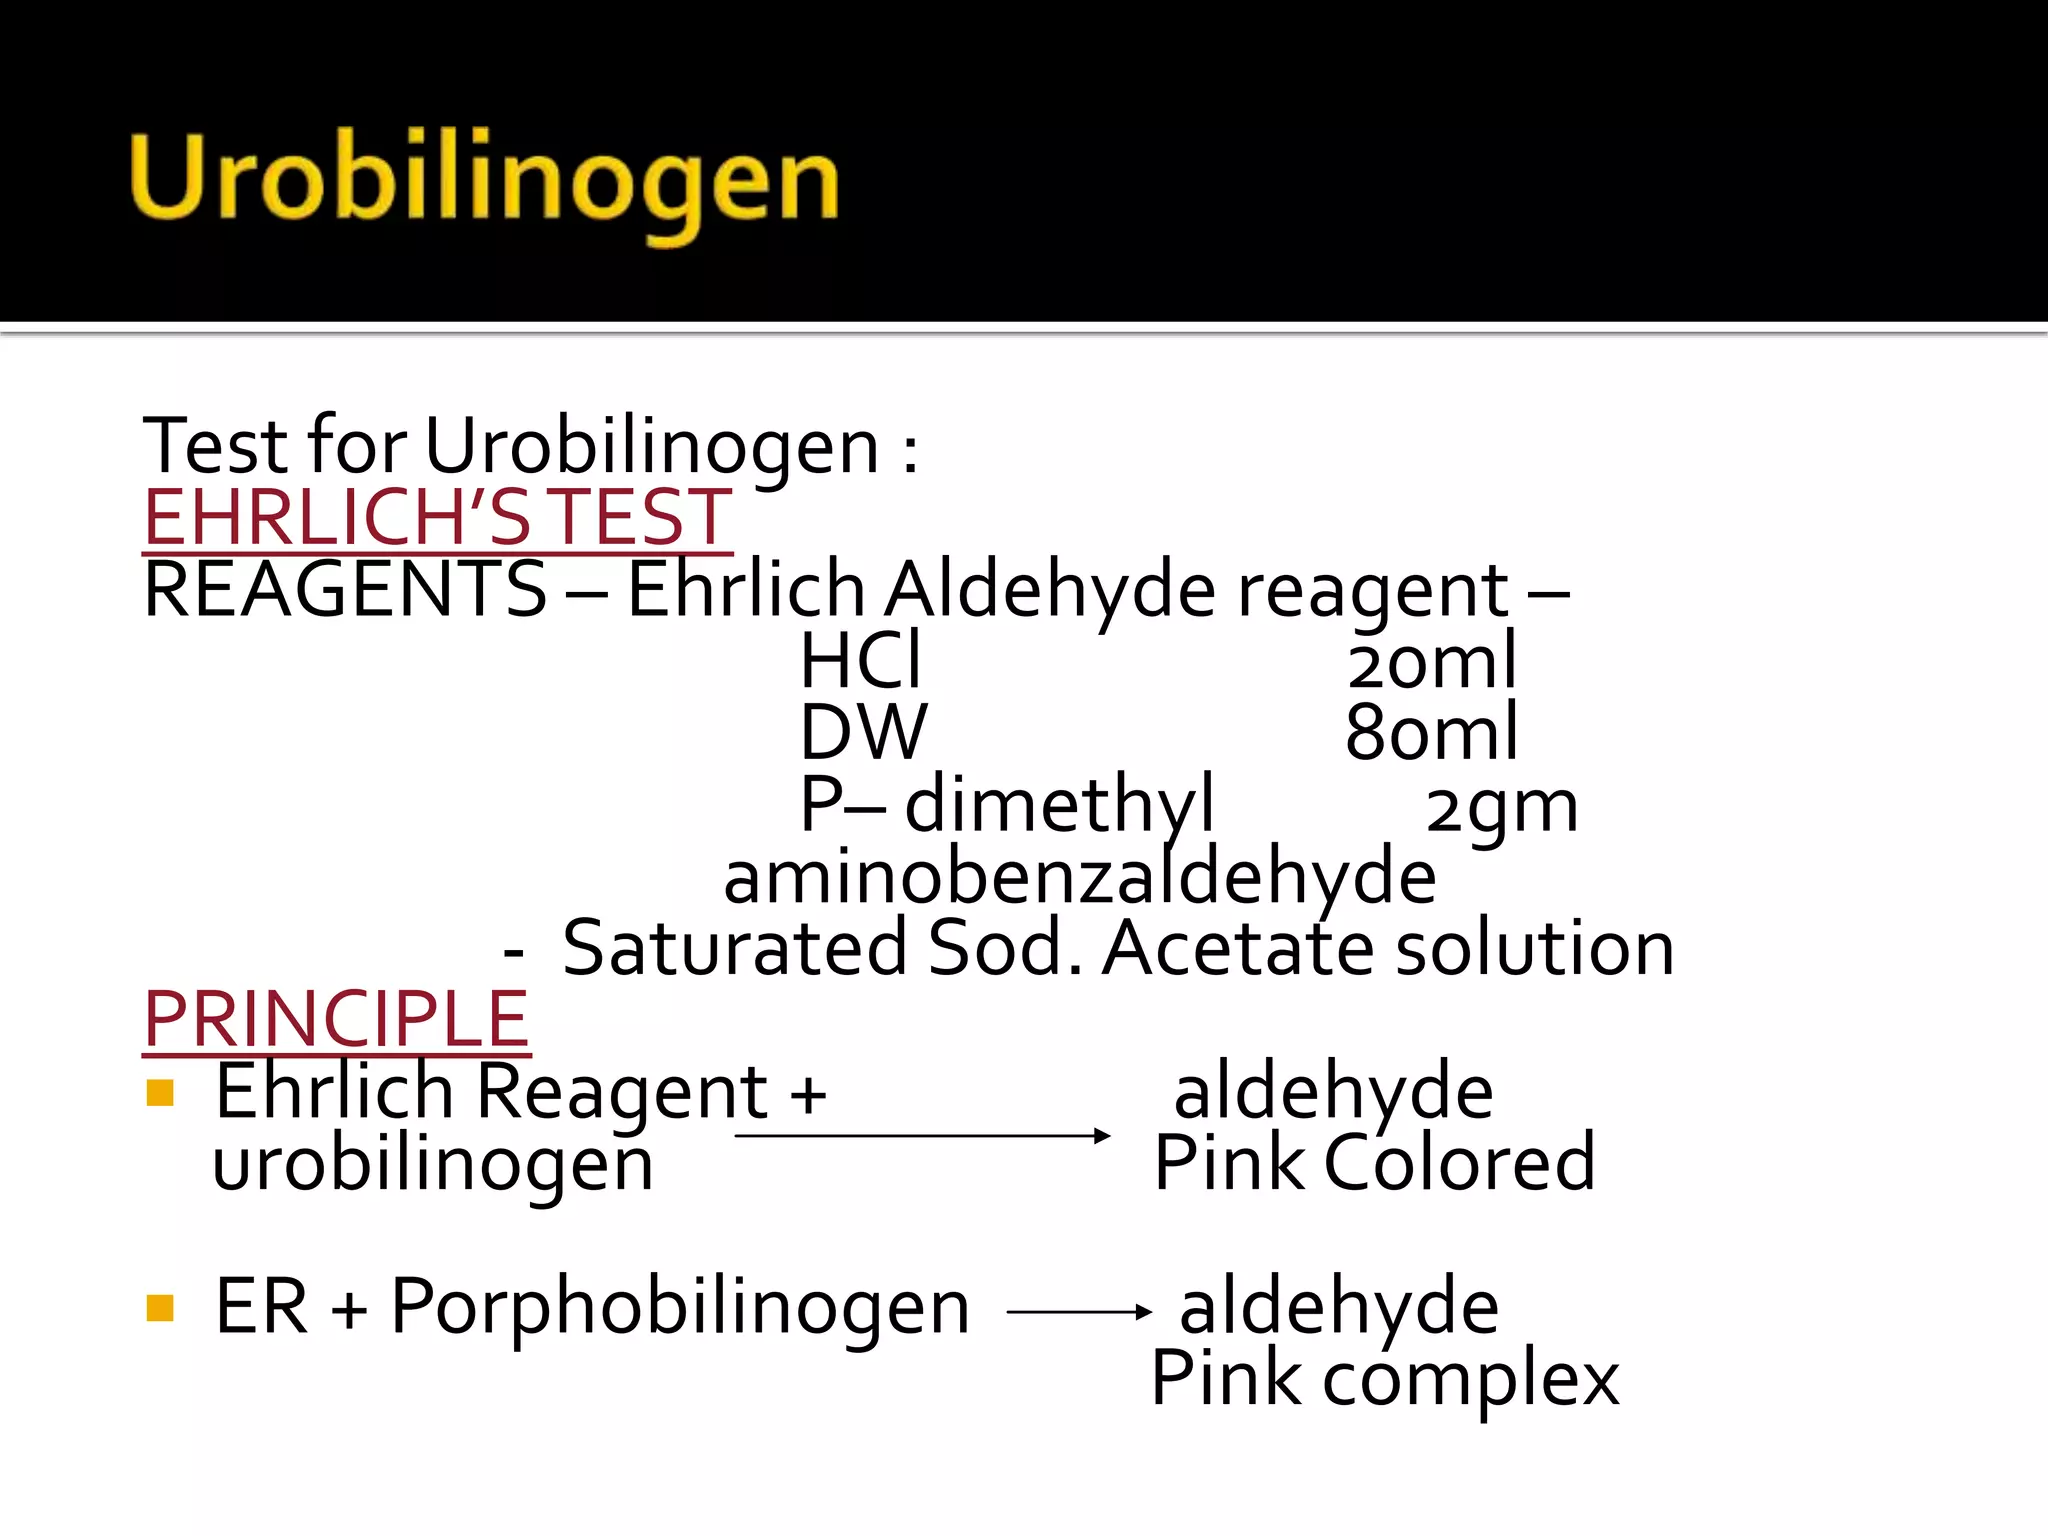
Saikat Mitra
 Urine is the excretory waste product formed by
the kidney
 It reflects the overall metabolic and kidney
functions of the body
 Minimally invasive and cost-effective procedure
helpful in
 Diagnosis of structural and functional disorders of
urinary system
 Monitoring of diseases
 Detection of systemic disease process
Glomerular Filtration Tubular Reabsorption Tubular Secretions
GFR : rate at which plasma is
filtered by kidney glomeruli
• 125 ml of plasma /min or
180 Lit./day
Glucose, Amino Acid,Protein,
vitamin, Na, K, Ca, Mg,
water
Na, K, Cl
Na, Cl, Bicarbonate,
water
Urea, Uric Acid, Creat,
Urea
H+, K+, NH4+
1-2 Lit. Urine
Urine
Solid
Organic
Non-protein
Nitrogen
Organic
Acid
Sugars
Inorganic
Water
Clean catch midstream sample
• Specimen of choice (Routine + bacteriologic tests)
Catheterization of bladder
• in pts with difficult voiding
Suprapubic aspiration
• Infants & small children
Points to remember
• If a single specimen is submitted for multiple
measurements, bacteriologic examination should
be done first, provided that the urine has been
properly collected
• With paediatric patients and persons in acute renal
failure, only a small volume of urine may be available
for processing, and in such cases, a notation should
be made and the measurements most pertinent to
the diagnosis should be performed first
 Random sample sufficient
But
1st morning sample – specimen of choice (more conc.)
 For glycosuria – 2-3 hours after meals
 For urobilinogen – early afternoon sample
 For quantitative analysis – 24 hr sample
 Empty bladder & discard urine at 8 am
 Collect all urine for next 24 hrs including 8am sample
of next day
 Keep specimen in refrigerator during entire collection
period
 Ideal – fresh
 Refrigerate
 At room temperature
urea splitting bacteria
Urea NH3 + H+
NH4
+ pH
decomposition of casts
used by bacteria
Glucose in urine false –ve fo glycosuria
• Formation of crystals
• Loss of Ketone Bodies
• Oxidation of Bilirubin and Urobilinogen
• Disintegration of cellular elements
Preservatives Advantages Disadvantages Additional
Information
Thymol Preserves glucose and
sediments well
Interferes with acid
precipitation tests for
protein
Boric acid Does not interfere with
routine analyses other than
pH
Preserves protein and
formed elements well
May precipitate crystals
when used in large
amounts
Keeps pH at about 6.0.
Is bacteriostatic (not
bactericidal) at 18 g/L;
can use for culture
transport Interferes
with drug and hormone
analyses
Formalin
(formaldehyde)
Excellent sediment
preservative
Acts as a reducing agent,
interfering with chemical
tests for glucose, blood,
leukocyte esterase, and
copper reduction
Rinse specimen
container with formalin
to preserve cells and
casts
Toluene Does not interfere with
routine tests
Floats on surface of
specimens
Volume
Color
Odor
Appearance
Specific
gravity
Normal = 600-2000ml with night urine not in excess of
400 ml.
Polyuria- >3000ml/24 hrs
Oliguria- <400 ml/24 hrs
Anuria-complete cessation of urine
(>2 L/m2 in children)
<1 mL/kg/h in infants
<0.5 mL/kg/h in children
 Normal – pale yellow / straw
colored due to urochrome,
urobilin, uroerythrin
 Low specific gravity – pale
 High specific gravity – dark
 Acid urine darker than
alkaline
COLOR PATH CAUSE NON PATH CAUSE
Pale yellow to dark
amber
Normal
Yellow orange Bilirubin, urobilin Acriflavin, azogantricin, B
complex, pyridium,
nitrofurantoin, sulfa,
quinacrine, carrots
Milky white Pus, chyle Phosphate, carbonate
Pink – red Hb, Myoglobin, RBCs,
porphyrin,
porphobilirubin
Beets, Rifampicin, aminopyrin,
diphenyl hydantoin, M Dopa,
bromosulphthaline,
phenacetin, pyridium
COLOR PATH CAUSES NON PATH CAUSES
Red brown Porphobilinogen, uroporphyrin
Smoky Microscopic hematuria
Brown
black
Bilirubin, homogentisic acid
(alkaptonuria), melanin, indican,
Meth Hb, Myoglobin
Chloroquin, hydroquinone, iron
Rx, resorcinol, M Dopa, L
Dopa, nitrofurantoin,
Blue green Biliverdin, pseudomonas
infection
Acriflavin, amitryptiline, azure A,
methylene blue, B complex
 NORMAL – aromatic – organic acids
Odor Condition
Sweet/ fruity Ketones
Pungent Bacteria (NH3 production)
Maple syrup Maple syrup urine disease
Musty /mousy Phenylketonuria
Sweaty feet Isovaleric acidemia
Rancid butter/ fishy hypermethioninemia
 Turbidity evaluated by
holding the specimen in front
of a line of printed material
 Normal – clear
 Graded as
 clear
 slightly cloudy
 cloudy
 turbid
APPEARANCE CAUSES
Clear Normal
Cloudy Leukocytes, bacteria, epithelial cells,
amorphous phosphate (alkaline urine),
amorphous urates (acidic urine)
White ppt Amorphous phosphate
Amorphous pink ppt Amorphous urate
Hazy Mucus
Smoky Microscopic hematuria
Milky Fat, chyle
Ratio of weight of urine to weight of equal volume of pure
water
Urea (20%), sodium chloride (25%), sulphate, and phosphate
contribute most of the specific gravity of normal urine.
Normal range- 1.003 to 1.035
Measurement Methods
•Urinometer
•Refractometer
•Reagent strip
•Sp gravity beads
•Falling drop method
 Floating instrument calibrated at 200C
 Measures specific gravity at fixed temp (200C)
 Principle of buoyancy
 Urinometer floats higher in urine (denser than
water)
 Fill 15ml urine in cylinder (decant any turbid
material)
Put urinometer in jar by spinning
(do not let it touch side of cylinder)
Read lower meniscus
Correction
Actual = Observed – 0.003 for each
1g/dL protein
Actual = observed – 0.004 for each
1g/dL glucose
+/- 0.001 for every 30C temp rise or fall
respectively
 Measures refractive index of solution
 Scale transforms refractive index into
corresponding specific gravity value
 Refractive index =
velocity of light in air
velocity of light in solution
 Only one drop urine required (V/S
urinometer)
 Strip impregnated with pretreated poly
electrolyte susceptible to pKa changes in
relation to ionic conc which reads into sp gravity
 Ion dissociation
pH change
bromothymol blue indicator
color altered
 Spectrum of colors
Deep blue – green – yellow green
HYPERSTHENURIA
– high specific
gravity (>1.035)
• Dehydration
• Proteinuria
• Glycosuria
• Lipoid nephrosis
• False increase
(dextran,
radiographic dye)
HYPOSTHENURIA –
low sp gravity
(<1.007)
• Collagen diseases
• Pyelonephritis
• Protein
malnutrition
• Polydipsia
• DI
• Diuretics
- Coffee, alcohol
(natural diuretics)
ISOSTHENURIA –
fixed sp gravity of
1.010
• Total loss of
concentrating
power of kidney -
Poor tubular
absorption
pH
Reducing
substances
Protein
Ketone bodiesBlood
Bile salts and
bile pigments
Miscellaneous
 Rough assessment of pt’s acid base status &
ability of kidney to regulate acid base balance
 Normal range – 4.6 to 8.0
 Tested by-
 1.litmus paper
 2. pH paper
 3. Reagent strip method
Reagent Strip test
 Impregnated with methyl red & bromothymol
blue
 pH reflected by color change from orange (acid)
to green to blue (alkaline)
 Covers pH range 5 – 9
Litmus paper
 Blue Acidic Red
 Red Alkaline Blue
Acidic Urine
• Ketosis-diabetes,
starvation, fever
• Systemic acidosis
• UTI by E.coli
• Acidification
therapy
• High protein diet
Alkaline Urine
• Strict vegetarian
• Systemic alkalosis
• UTI by
pseudomonas or
Proteus
• Alkalization therapy
• CRF
 A small amount of protein (50 – 150 mg / 24
hrs) appears daily in the normal urine
 More than 150 mg/day is defined as
Proteinuria.
Protein % ofTotal Daily Maximum
Albumin 40% 60 mg
Tamm-Horsfall 40% 60 mg
Immunoglobulins 12% 24 mg
Secretory IgA 3% 6 mg
Other 5% 10 mg
TOTAL 100% 150 mg
Qualitative tests
• Heat Precipitation test
• Sulphosalicylic acid test
• Heller’s method
• Reagent strip ( Albustix)
Quantitative tests
• Esbach’s Albuminometer
• Electrophoresis
 Principle – heat renders proteins insoluble & causes
them to coagulate.
Proteins are more susceptible to precipitation at pH
near their isoelectric point.
 Procedure – fill 2/3 test tube with urine
Hold bottom of test tube wit holder
Boil upper portion of tube for 2 min
Cloudiness
Protein/phosphate/carbonate
+ 3-5 drops 5-10% acetic acid + boil
Cloudiness disappears Cloudiness persists
phosphate / carbonates or increases - protein
 Detects albumin, globulin, mucoprotein, bence jones
protein
 Doesn’t detect Hb, myoglobin
 False +ve – tolbutamide, penicillin, radiographic dyes
 False –ve –highly alkaline urine of low sp gravity
 Interpretation
- No cloudiness
+/- Cloudiness barely present (~5 mg/dl)
+ Definite cloudiness but no granularity, no
flocculation (10-30 mg/dl)
++ Granular white ppt (40-100 mg/dl)
+++ Floccular ppt (200-500 mg/dl)
++++ Thick opaque ppt( >500 mg/dl)
Sulphosalicylic acid method
• Procedure
• Take 2 ml of clear urine in a
test tube.
• Add an equal volume of 30
% sulphosalicylic acid.
• Mix thoroughly, allow it to
stand for 10 minutes and
estimate the amount of
turbidity.
Nitric acid method
• Procedure
• Take 2 – 3 ml of
concentrated nitric acid in a
test tube.
• Carefully pour 5ml of clear
urine down the inner side
of the inclined test tube so
that the urine forms a layer
over the nitric acid.
• A ring of white precipitated
protein will form at the
interface. Estimates the
amount of precipitate.
 Principle – protein error of indicators i.e. point
of color change of some pH indicators is
different in presence of protein as compared to
their absence
 Indicator – tetrabromophenol blue
tetra chlorophenol tetra bromo
sulfophthalein
 Color change - Yellow green / blue
 Intensity of color ~ amount of protein
 False +ve – alkaline urine, phenazopyridine
 False –ve – dilute urine
 Very sensitive, detects 20mg% albumin
24 hr sample
 Esbach’s albuminometer
Esbach’s reagent–
Picric acid- 5mg
Citric acid- 10mg
dissolved in 500 ml water
Procedure
urine up to mark “u”
+
esbach’s reagent up to mark “r”
Mix & stand for 24hrs
Read amount of protein ppt
 Definition : urinary excretion of albumin
▪ 20 to 200 ug/minute or
▪ 30 to 300 mg/24 hours
 Methods of detection :
 Albumin-creatinine ratio in random urine sample
 Measurement of albumin in early morning sample.
 Measurement of urine in 24 hr sample
 Reagent tablets or dipsticks
 Specific assays
▪ RIA
▪ ELISA
▪ Nephelometry
 Light chains in plasma cell dyscrasias
(multiple myeloma)
 Either kappa or lambda
 Tests done are:-
a) Heat precipitation test
b) Toluene sulfonic acid test
c) Electrophoresis – best
d) Bradshaw’s test
•Multiple myeloma
•Macroglobulinemia
•Lymphomas
•Amyloidosis
Heat 5ml of urine with a thermometer inside or in water
bath at 450 C
BJ proteins start precipitating at 600c
It dissolves if heated beyond & reappears when cooled
to 600 c
Albumin and glucose if +nt, ppt at 800c
filter
BJ come out in filtrate and reappear on cooling to 600 c
Method of Urine Concentration
•Dialysis against powdered sucrose
•MiliporeTechnique
Cu2+ Cu+
Sugars
• Glucose
• Fructose
• pentose
• galactose
Non sugars
• Ascorbic acid
• Uric acid, urates
• Glucuronides
• Salicylates
• Streptomycin
• Phenol, PAS
Various tests done are:-
 Benedict’s copper reduction test
 Fehling’s test
 Reagent strip ( Glucose – oxidase test )
Semi quantitative test
Detects the presence of reducing substance in
urine
Non specific test for reducing substances
Principle
cupric hydroxide
reducing subs
cuprous oxide (colored ppt)
Solution 1: Na citrate – 173 gms
Anhydrous Na Carbonate 100gms
Solution 2 Cu sulphate - 17.3 gms
Mix both solutions to make 1 litre in DW
 Procedure
5 ml of Benedict’s reagent in test tube
Boil
8 drops of urine
Boil for 5 minutes
note color of precipitate
FALSE POSITIVETEST
• Other sugars except sucrose
• Nonsugar subs - Creatine, Uric acid,
urates, Ascorbic Acid & Glucuronides
• Drugs- Salicylates, Cephalosporins,
Streptomycin
Fructose - Seliwanoff’s test
( Fructosuria- intake of grapes and citrus fruits)
Pentose - Bial’s test
Lactose - Methylamine test
( Lactosuria- late pregnancy, lactating women)
Glucose - Glucose oxidase test(Enzymatic method)
 DIASTIX / MULTISTIX / DIPSTIX contains
 Glucose oxidase
 Peroxidase
 Chromogen - O toluidine
potassium iodide
 Specific for glucose
 Strip dipped in urine for 10-30 seconds
 Color obtained is matched with a color chart
provided on the bottle
 Sensitivity - 0.1 mg%
False + Contamination with peroxide or
hypochlorite
False - Vitamin C if present inhibits enzymatic
reaction
- High Ketone levels
 Products of incomplete fat metabolism
 three discrete but metabolically related chemicals:
▪ acetoacetic acid (20%)
▪ β-hydroxybutyric acid (78%)
▪ Acetone (2%)
Tests done are:-
 Rothera’s test
 Gerhardt’s test
 Harts test
 Reagent strip / Ketostix / Ames test
Principle :
Acetoacetic acid/acetone + Sodium
nitroprusside (Na nitroferricyanide)
alkaline pH
ferropentocyanide (Purple color)
Rothera’s reagent
7.5 gm sodium nitroprusside
200 gm ammonium sulphate
Procedure :
4 ml of urine + few crystals of Na nitroprusside
Saturate with ammonium sulphate
+ few drops liquor NH3 along wall of tube
Wait for 2 min
Purple ring
 Interpretation-
no ring negative
Faint pink- purple ring traces (+)
Narrow dark purple ring (++)
Wide dark purple ring (+++)
 Specific forAcetoacetic acid
 10% ferric chloride
 5ml urine + 10% ferric chloride drop by drop
Port wine color
 Indirect test for β-Hydroxy butyric acid
20 ml urine + 20 ml DW +
few drops Acetic acid (removes acetone & AAA)
reduce vol to 10 ml
add 20 ml of DW
divide into 2 parts
+ 1ml H2O2 no H2O2 added
(converts βHBA into
acetone & AAA)
+ve Rothera’s reaction -ve Rothera’s reaction
 Based on Rothera’s test
Acetone /AAA+ Sod Nitroprusside
Alkali
Purple colored complex
a) Chemstrip: upto 10mg/dl AAA & 70 mg/dl
acetone
uses glycine
Beige Violet (60sec)
b) Multistix :up to 5-10 mg/dl AAA
Uses alkaline buffer
Pink Maroon (15 sec)
 Hematuria
 Hemoglobinuria
 Myoglobinuria
 Hemosiderinuria
 Benzidine reagent
1) Equal volume of saturated solution of
benzidine in glacial acetic acid
2) 3-6% H2O2
Mix 1ml of the two solutions
 Principle
H2O2 + peroxidase (in Hb) H2O+ O
Benzidine + O Blue Green color
(chromogen)
Glacial AA - lyse RBCs to release Hb
 Procedure
2ml urine + 2ml benzidine reagent
mix
Blue color
(blood/Hb)
 Interpretation
Faint green Traces
Green +
Greenish blue ++
Blue +++
Deep blue ++++
False + results
 Oxidising reagents like bleach & hypochlorite
 Microbial infection associated with UTI
False – results
 High specific gravity
 Protein & ascorbic acid
 Nitrite & formalin
Dipstick test / Heme tablet
Very small amount of Hb/RBCs detected
Principle
Org peroxide + peroxidase H20 + O
(reagent) (from Hb)
O + chromogen oxidised chromogen
(O-toluidine) (color)
 Na and K glycocholates and taurocholates
 Normally not present in urine
 Present in obstructive jaundice &
hepatocellular jaundice
 Decrease surface tension of urine – surfactant
action
 Test – Hay’s Sulphur test
20 ml of urine in a beaker
sprinkle sulphur powder
watch for 5 min
If it sinks to the bottom—Bile salts are present
 Normal excretion 2-4 mg/24 hrs (colorless)
 Causes of increased urobilinogen
 Hemolytic anemias
 Pre-icteric phase of infective hepatitis
 Causes of decreased or absent urobilinogen
 Obstructive Jaundice
Test for Urobilinogen :
EHRLICH’STEST
REAGENTS – Ehrlich Aldehyde reagent –
HCl 20ml
DW 80ml
P– dimethyl 2gm
aminobenzaldehyde
- Saturated Sod. Acetate solution
PRINCIPLE
 Ehrlich Reagent + aldehyde
urobilinogen Pink Colored
 ER + Porphobilinogen aldehyde
Pink complex
 confirmatory & D/D PBN
5 ml urine+5ml Ehrlich’s reagent+10ml sat Na acetate
sol
+ 5ml Chloroform, shake and mix
2 layers develop
upper clear aqueous upper colored aqueous &
& lower colored lower clear chloroform layer
chloroform layer
UBN +nt
+ 5ml butanol + shake
Pink lower pink upper butanol layer
Aqueous layer
PBN UBN
 Breakdown product of Hb.
 Causes - Obstructive Jaundice
Hepatocellular Jaundice
 Tests
 Fouchet’s test / Harrison spot test
 Foam test
 Icto test
 Strip test
 Smith iodine test
 Gmelin’s test
 Very sensitive (0.05 – 0.1 mg/dl )
 Fresh Sample
 Reagents
 10% Barium Chloride
 Fouchet’s reagent
▪ Trichloracetic acid 25 g
▪ DW 50ml
▪ 10% Ferric chloride 10ml
 Dilute H2SO4 or (NH4 )2 SO4 Solution
Principle
 BaCl2 + SO4 (in urine) BaSO4 ppt
 Bilirubin in urine adheres to ppt
 Bilirubin in ppt (yellow)
+FeCl3
+Trichloroacetic acid
Biliverdin (green)
 Bilicyanin - blue color
 Procedure
10ml urine + 3ml BaCl2 sol
mix & filter
ppt (bilirubin + Ba salt)
+ Fouchet’s reagent (few drops)
Green color
 Result
 No change in color – Negative
 Pale blue green color – Trace /+
 Darker blue green color – 2+ to 4+
ICTOTEST/TABLETTEST:
 Highly Sensitive (0.05 – 0.1mg/dl)
 Tablet containing diazo reagent, sulfosalicylic
acid, sodium bicarbonate & boric acid
Principle
 Bilirubin + Diazonium salts  Azobilirubin
(in Acidic Medium) (Blue / Purple)
REAGENTTEST STRIPS
Bilirubin + 2-4 dichloroaniline Cream buff to tan
 NITRITES
 E coli, klebsiella, proteus
 Nitrite + p-arsanilic acid (acid pH)
diazonium salt + benzoquinoline (PINK COLOR)
culture
 LEUKOCYTE ESTERASE
 Reagent-strip test for pyuria (leukocytes in urine)
 The intracellular esterases (bacterial) catalyze hydrolysis of
esters, releasing a product that reacts with a diazonium salt
to produce a colored product.
• Analyzes the intensity and color of light reflected
from the reagent areas of a urinalysis test strip.
• LEDs and (CMOS)
• Reads the color change in the urine strips after a
sample is applie
Wavelength Photometry
Refractive Index – for Sp. Gravity
•Semiautomated analyser
•Clinitek 200/200+/500
•Chemstrip Urine Analyzer
•Urisys 1800 System
•Fully automated analyser
•Clinitek Atlas
•Iris iChemVelocity
 A well mixed sample of urine (10 ml) is
centrifuged in machine for 5 min at 1500 rpm.
 The top liquid part (the supernatant) is
discarded.
 A drop of urine left at the bottom of the test
tube (the urine sediment) is placed on glass slide
and covered with cover slip. It is examined under
high power
 Contents of normal urine m/s
 Contains few epithelial cells, occasional RBC’s, few
crystals
 Types of materials that may be found include:
 Red blood cells
 White blood cells
 Epithelial cells
 Casts
 Crystals
 Others
 TYPE
 Erythrocytes
 Leucocytes
▪ Neutrophils
▪ Eosinophils
▪ Lymphocytes
 Epithelial Cells
▪ Tubular cells
▪ Uroepithelial cells
▪ Squamous cells
MATRIX
• Hyaline
• Waxy
INCLUSIONS
• Granules-
proteins, cell
debris
• Fat globules-
triglycerides,
cholestrol
esters
• Hemosiderin
granules
• Melanin
granules- rare
PIGMENTS
• Haemoglobin
• Myoglobin
• Bilirubin
• Drugs
CELLS
• Erythocyte
casts
• Leucocytes :
neutrophils,
lymphocytes,
monocytes
• Renal tubular
epithelial cells
• Mixed cells :
erythrocytes,
neutrophils
and renal
tubular cells.
• Bacteria.
• Amorphous Urate
• Crystalline Urate
• Calcium Oxalate
Crystals found in normal acid urine
• Amorphous Phosphate
• Crystalline Phosphate
• Calcium Carbonate
• Ammonium Bi-urate
Crystals found in normal alkaline urine
 Tumor Cells
 Viral Inclusions
 Bacteria
 Fungi
 Parasites
Flow cytometry
• Sysmex UF-50, 100
Auto Particle Recognition (APR)
• Iris Q200
• A known volume of urine passes in front of a microscope objective.
•A camera takes 500 fields per sample.
•The particles are classified using a model of a neural network used by
the software: Auto-Particle Recognition (APR™).
•For samples with very abnormal particles, a user can visually confirm
the identification of those particles according to their morphological
details seen on the screen
•Minimum size of the recognized particles is 3 μm

Urine analysis Part1

  • 1.
  • 2.
     Urine isthe excretory waste product formed by the kidney  It reflects the overall metabolic and kidney functions of the body  Minimally invasive and cost-effective procedure helpful in  Diagnosis of structural and functional disorders of urinary system  Monitoring of diseases  Detection of systemic disease process
  • 4.
    Glomerular Filtration TubularReabsorption Tubular Secretions GFR : rate at which plasma is filtered by kidney glomeruli • 125 ml of plasma /min or 180 Lit./day Glucose, Amino Acid,Protein, vitamin, Na, K, Ca, Mg, water Na, K, Cl Na, Cl, Bicarbonate, water Urea, Uric Acid, Creat, Urea H+, K+, NH4+ 1-2 Lit. Urine
  • 5.
  • 7.
    Clean catch midstreamsample • Specimen of choice (Routine + bacteriologic tests) Catheterization of bladder • in pts with difficult voiding Suprapubic aspiration • Infants & small children
  • 8.
    Points to remember •If a single specimen is submitted for multiple measurements, bacteriologic examination should be done first, provided that the urine has been properly collected • With paediatric patients and persons in acute renal failure, only a small volume of urine may be available for processing, and in such cases, a notation should be made and the measurements most pertinent to the diagnosis should be performed first
  • 9.
     Random samplesufficient But 1st morning sample – specimen of choice (more conc.)  For glycosuria – 2-3 hours after meals  For urobilinogen – early afternoon sample  For quantitative analysis – 24 hr sample  Empty bladder & discard urine at 8 am  Collect all urine for next 24 hrs including 8am sample of next day  Keep specimen in refrigerator during entire collection period
  • 10.
     Ideal –fresh  Refrigerate  At room temperature urea splitting bacteria Urea NH3 + H+ NH4 + pH decomposition of casts used by bacteria Glucose in urine false –ve fo glycosuria • Formation of crystals • Loss of Ketone Bodies • Oxidation of Bilirubin and Urobilinogen • Disintegration of cellular elements
  • 11.
    Preservatives Advantages DisadvantagesAdditional Information Thymol Preserves glucose and sediments well Interferes with acid precipitation tests for protein Boric acid Does not interfere with routine analyses other than pH Preserves protein and formed elements well May precipitate crystals when used in large amounts Keeps pH at about 6.0. Is bacteriostatic (not bactericidal) at 18 g/L; can use for culture transport Interferes with drug and hormone analyses Formalin (formaldehyde) Excellent sediment preservative Acts as a reducing agent, interfering with chemical tests for glucose, blood, leukocyte esterase, and copper reduction Rinse specimen container with formalin to preserve cells and casts Toluene Does not interfere with routine tests Floats on surface of specimens
  • 13.
  • 14.
    Normal = 600-2000mlwith night urine not in excess of 400 ml. Polyuria- >3000ml/24 hrs Oliguria- <400 ml/24 hrs Anuria-complete cessation of urine (>2 L/m2 in children) <1 mL/kg/h in infants <0.5 mL/kg/h in children
  • 15.
     Normal –pale yellow / straw colored due to urochrome, urobilin, uroerythrin  Low specific gravity – pale  High specific gravity – dark  Acid urine darker than alkaline
  • 16.
    COLOR PATH CAUSENON PATH CAUSE Pale yellow to dark amber Normal Yellow orange Bilirubin, urobilin Acriflavin, azogantricin, B complex, pyridium, nitrofurantoin, sulfa, quinacrine, carrots Milky white Pus, chyle Phosphate, carbonate Pink – red Hb, Myoglobin, RBCs, porphyrin, porphobilirubin Beets, Rifampicin, aminopyrin, diphenyl hydantoin, M Dopa, bromosulphthaline, phenacetin, pyridium
  • 17.
    COLOR PATH CAUSESNON PATH CAUSES Red brown Porphobilinogen, uroporphyrin Smoky Microscopic hematuria Brown black Bilirubin, homogentisic acid (alkaptonuria), melanin, indican, Meth Hb, Myoglobin Chloroquin, hydroquinone, iron Rx, resorcinol, M Dopa, L Dopa, nitrofurantoin, Blue green Biliverdin, pseudomonas infection Acriflavin, amitryptiline, azure A, methylene blue, B complex
  • 18.
     NORMAL –aromatic – organic acids Odor Condition Sweet/ fruity Ketones Pungent Bacteria (NH3 production) Maple syrup Maple syrup urine disease Musty /mousy Phenylketonuria Sweaty feet Isovaleric acidemia Rancid butter/ fishy hypermethioninemia
  • 19.
     Turbidity evaluatedby holding the specimen in front of a line of printed material  Normal – clear  Graded as  clear  slightly cloudy  cloudy  turbid
  • 20.
    APPEARANCE CAUSES Clear Normal CloudyLeukocytes, bacteria, epithelial cells, amorphous phosphate (alkaline urine), amorphous urates (acidic urine) White ppt Amorphous phosphate Amorphous pink ppt Amorphous urate Hazy Mucus Smoky Microscopic hematuria Milky Fat, chyle
  • 21.
    Ratio of weightof urine to weight of equal volume of pure water Urea (20%), sodium chloride (25%), sulphate, and phosphate contribute most of the specific gravity of normal urine. Normal range- 1.003 to 1.035
  • 22.
  • 23.
     Floating instrumentcalibrated at 200C  Measures specific gravity at fixed temp (200C)  Principle of buoyancy  Urinometer floats higher in urine (denser than water)  Fill 15ml urine in cylinder (decant any turbid material) Put urinometer in jar by spinning (do not let it touch side of cylinder) Read lower meniscus Correction Actual = Observed – 0.003 for each 1g/dL protein Actual = observed – 0.004 for each 1g/dL glucose +/- 0.001 for every 30C temp rise or fall respectively
  • 24.
     Measures refractiveindex of solution  Scale transforms refractive index into corresponding specific gravity value  Refractive index = velocity of light in air velocity of light in solution  Only one drop urine required (V/S urinometer)
  • 25.
     Strip impregnatedwith pretreated poly electrolyte susceptible to pKa changes in relation to ionic conc which reads into sp gravity  Ion dissociation pH change bromothymol blue indicator color altered  Spectrum of colors Deep blue – green – yellow green
  • 26.
    HYPERSTHENURIA – high specific gravity(>1.035) • Dehydration • Proteinuria • Glycosuria • Lipoid nephrosis • False increase (dextran, radiographic dye) HYPOSTHENURIA – low sp gravity (<1.007) • Collagen diseases • Pyelonephritis • Protein malnutrition • Polydipsia • DI • Diuretics - Coffee, alcohol (natural diuretics) ISOSTHENURIA – fixed sp gravity of 1.010 • Total loss of concentrating power of kidney - Poor tubular absorption
  • 28.
  • 29.
     Rough assessmentof pt’s acid base status & ability of kidney to regulate acid base balance  Normal range – 4.6 to 8.0  Tested by-  1.litmus paper  2. pH paper  3. Reagent strip method
  • 30.
    Reagent Strip test Impregnated with methyl red & bromothymol blue  pH reflected by color change from orange (acid) to green to blue (alkaline)  Covers pH range 5 – 9 Litmus paper  Blue Acidic Red  Red Alkaline Blue
  • 31.
    Acidic Urine • Ketosis-diabetes, starvation,fever • Systemic acidosis • UTI by E.coli • Acidification therapy • High protein diet Alkaline Urine • Strict vegetarian • Systemic alkalosis • UTI by pseudomonas or Proteus • Alkalization therapy • CRF
  • 32.
     A smallamount of protein (50 – 150 mg / 24 hrs) appears daily in the normal urine  More than 150 mg/day is defined as Proteinuria.
  • 33.
    Protein % ofTotalDaily Maximum Albumin 40% 60 mg Tamm-Horsfall 40% 60 mg Immunoglobulins 12% 24 mg Secretory IgA 3% 6 mg Other 5% 10 mg TOTAL 100% 150 mg
  • 34.
    Qualitative tests • HeatPrecipitation test • Sulphosalicylic acid test • Heller’s method • Reagent strip ( Albustix) Quantitative tests • Esbach’s Albuminometer • Electrophoresis
  • 35.
     Principle –heat renders proteins insoluble & causes them to coagulate. Proteins are more susceptible to precipitation at pH near their isoelectric point.  Procedure – fill 2/3 test tube with urine Hold bottom of test tube wit holder Boil upper portion of tube for 2 min Cloudiness Protein/phosphate/carbonate + 3-5 drops 5-10% acetic acid + boil Cloudiness disappears Cloudiness persists phosphate / carbonates or increases - protein
  • 36.
     Detects albumin,globulin, mucoprotein, bence jones protein  Doesn’t detect Hb, myoglobin  False +ve – tolbutamide, penicillin, radiographic dyes  False –ve –highly alkaline urine of low sp gravity  Interpretation - No cloudiness +/- Cloudiness barely present (~5 mg/dl) + Definite cloudiness but no granularity, no flocculation (10-30 mg/dl) ++ Granular white ppt (40-100 mg/dl) +++ Floccular ppt (200-500 mg/dl) ++++ Thick opaque ppt( >500 mg/dl)
  • 37.
    Sulphosalicylic acid method •Procedure • Take 2 ml of clear urine in a test tube. • Add an equal volume of 30 % sulphosalicylic acid. • Mix thoroughly, allow it to stand for 10 minutes and estimate the amount of turbidity. Nitric acid method • Procedure • Take 2 – 3 ml of concentrated nitric acid in a test tube. • Carefully pour 5ml of clear urine down the inner side of the inclined test tube so that the urine forms a layer over the nitric acid. • A ring of white precipitated protein will form at the interface. Estimates the amount of precipitate.
  • 38.
     Principle –protein error of indicators i.e. point of color change of some pH indicators is different in presence of protein as compared to their absence  Indicator – tetrabromophenol blue tetra chlorophenol tetra bromo sulfophthalein  Color change - Yellow green / blue  Intensity of color ~ amount of protein  False +ve – alkaline urine, phenazopyridine  False –ve – dilute urine  Very sensitive, detects 20mg% albumin
  • 39.
    24 hr sample Esbach’s albuminometer Esbach’s reagent– Picric acid- 5mg Citric acid- 10mg dissolved in 500 ml water Procedure urine up to mark “u” + esbach’s reagent up to mark “r” Mix & stand for 24hrs Read amount of protein ppt
  • 40.
     Definition :urinary excretion of albumin ▪ 20 to 200 ug/minute or ▪ 30 to 300 mg/24 hours  Methods of detection :  Albumin-creatinine ratio in random urine sample  Measurement of albumin in early morning sample.  Measurement of urine in 24 hr sample  Reagent tablets or dipsticks  Specific assays ▪ RIA ▪ ELISA ▪ Nephelometry
  • 41.
     Light chainsin plasma cell dyscrasias (multiple myeloma)  Either kappa or lambda  Tests done are:- a) Heat precipitation test b) Toluene sulfonic acid test c) Electrophoresis – best d) Bradshaw’s test •Multiple myeloma •Macroglobulinemia •Lymphomas •Amyloidosis
  • 42.
    Heat 5ml ofurine with a thermometer inside or in water bath at 450 C BJ proteins start precipitating at 600c It dissolves if heated beyond & reappears when cooled to 600 c Albumin and glucose if +nt, ppt at 800c filter BJ come out in filtrate and reappear on cooling to 600 c
  • 43.
    Method of UrineConcentration •Dialysis against powdered sucrose •MiliporeTechnique
  • 44.
    Cu2+ Cu+ Sugars • Glucose •Fructose • pentose • galactose Non sugars • Ascorbic acid • Uric acid, urates • Glucuronides • Salicylates • Streptomycin • Phenol, PAS
  • 45.
    Various tests doneare:-  Benedict’s copper reduction test  Fehling’s test  Reagent strip ( Glucose – oxidase test )
  • 46.
    Semi quantitative test Detectsthe presence of reducing substance in urine Non specific test for reducing substances Principle cupric hydroxide reducing subs cuprous oxide (colored ppt)
  • 47.
    Solution 1: Nacitrate – 173 gms Anhydrous Na Carbonate 100gms Solution 2 Cu sulphate - 17.3 gms Mix both solutions to make 1 litre in DW
  • 48.
     Procedure 5 mlof Benedict’s reagent in test tube Boil 8 drops of urine Boil for 5 minutes note color of precipitate FALSE POSITIVETEST • Other sugars except sucrose • Nonsugar subs - Creatine, Uric acid, urates, Ascorbic Acid & Glucuronides • Drugs- Salicylates, Cephalosporins, Streptomycin
  • 49.
    Fructose - Seliwanoff’stest ( Fructosuria- intake of grapes and citrus fruits) Pentose - Bial’s test Lactose - Methylamine test ( Lactosuria- late pregnancy, lactating women) Glucose - Glucose oxidase test(Enzymatic method)
  • 50.
     DIASTIX /MULTISTIX / DIPSTIX contains  Glucose oxidase  Peroxidase  Chromogen - O toluidine potassium iodide  Specific for glucose  Strip dipped in urine for 10-30 seconds  Color obtained is matched with a color chart provided on the bottle  Sensitivity - 0.1 mg% False + Contamination with peroxide or hypochlorite False - Vitamin C if present inhibits enzymatic reaction - High Ketone levels
  • 51.
     Products ofincomplete fat metabolism  three discrete but metabolically related chemicals: ▪ acetoacetic acid (20%) ▪ β-hydroxybutyric acid (78%) ▪ Acetone (2%)
  • 52.
    Tests done are:- Rothera’s test  Gerhardt’s test  Harts test  Reagent strip / Ketostix / Ames test
  • 53.
    Principle : Acetoacetic acid/acetone+ Sodium nitroprusside (Na nitroferricyanide) alkaline pH ferropentocyanide (Purple color) Rothera’s reagent 7.5 gm sodium nitroprusside 200 gm ammonium sulphate
  • 54.
    Procedure : 4 mlof urine + few crystals of Na nitroprusside Saturate with ammonium sulphate + few drops liquor NH3 along wall of tube Wait for 2 min Purple ring  Interpretation- no ring negative Faint pink- purple ring traces (+) Narrow dark purple ring (++) Wide dark purple ring (+++)
  • 55.
     Specific forAcetoaceticacid  10% ferric chloride  5ml urine + 10% ferric chloride drop by drop Port wine color
  • 56.
     Indirect testfor β-Hydroxy butyric acid 20 ml urine + 20 ml DW + few drops Acetic acid (removes acetone & AAA) reduce vol to 10 ml add 20 ml of DW divide into 2 parts + 1ml H2O2 no H2O2 added (converts βHBA into acetone & AAA) +ve Rothera’s reaction -ve Rothera’s reaction
  • 57.
     Based onRothera’s test Acetone /AAA+ Sod Nitroprusside Alkali Purple colored complex a) Chemstrip: upto 10mg/dl AAA & 70 mg/dl acetone uses glycine Beige Violet (60sec) b) Multistix :up to 5-10 mg/dl AAA Uses alkaline buffer Pink Maroon (15 sec)
  • 58.
     Hematuria  Hemoglobinuria Myoglobinuria  Hemosiderinuria
  • 59.
     Benzidine reagent 1)Equal volume of saturated solution of benzidine in glacial acetic acid 2) 3-6% H2O2 Mix 1ml of the two solutions  Principle H2O2 + peroxidase (in Hb) H2O+ O Benzidine + O Blue Green color (chromogen) Glacial AA - lyse RBCs to release Hb
  • 60.
     Procedure 2ml urine+ 2ml benzidine reagent mix Blue color (blood/Hb)  Interpretation Faint green Traces Green + Greenish blue ++ Blue +++ Deep blue ++++
  • 61.
    False + results Oxidising reagents like bleach & hypochlorite  Microbial infection associated with UTI False – results  High specific gravity  Protein & ascorbic acid  Nitrite & formalin
  • 62.
    Dipstick test /Heme tablet Very small amount of Hb/RBCs detected Principle Org peroxide + peroxidase H20 + O (reagent) (from Hb) O + chromogen oxidised chromogen (O-toluidine) (color)
  • 64.
     Na andK glycocholates and taurocholates  Normally not present in urine  Present in obstructive jaundice & hepatocellular jaundice  Decrease surface tension of urine – surfactant action  Test – Hay’s Sulphur test 20 ml of urine in a beaker sprinkle sulphur powder watch for 5 min If it sinks to the bottom—Bile salts are present
  • 65.
     Normal excretion2-4 mg/24 hrs (colorless)  Causes of increased urobilinogen  Hemolytic anemias  Pre-icteric phase of infective hepatitis  Causes of decreased or absent urobilinogen  Obstructive Jaundice
  • 66.
    Test for Urobilinogen: EHRLICH’STEST REAGENTS – Ehrlich Aldehyde reagent – HCl 20ml DW 80ml P– dimethyl 2gm aminobenzaldehyde - Saturated Sod. Acetate solution PRINCIPLE  Ehrlich Reagent + aldehyde urobilinogen Pink Colored  ER + Porphobilinogen aldehyde Pink complex
  • 68.
     confirmatory &D/D PBN 5 ml urine+5ml Ehrlich’s reagent+10ml sat Na acetate sol + 5ml Chloroform, shake and mix 2 layers develop upper clear aqueous upper colored aqueous & & lower colored lower clear chloroform layer chloroform layer UBN +nt + 5ml butanol + shake Pink lower pink upper butanol layer Aqueous layer PBN UBN
  • 69.
     Breakdown productof Hb.  Causes - Obstructive Jaundice Hepatocellular Jaundice  Tests  Fouchet’s test / Harrison spot test  Foam test  Icto test  Strip test  Smith iodine test  Gmelin’s test
  • 70.
     Very sensitive(0.05 – 0.1 mg/dl )  Fresh Sample  Reagents  10% Barium Chloride  Fouchet’s reagent ▪ Trichloracetic acid 25 g ▪ DW 50ml ▪ 10% Ferric chloride 10ml  Dilute H2SO4 or (NH4 )2 SO4 Solution
  • 71.
    Principle  BaCl2 +SO4 (in urine) BaSO4 ppt  Bilirubin in urine adheres to ppt  Bilirubin in ppt (yellow) +FeCl3 +Trichloroacetic acid Biliverdin (green)  Bilicyanin - blue color
  • 72.
     Procedure 10ml urine+ 3ml BaCl2 sol mix & filter ppt (bilirubin + Ba salt) + Fouchet’s reagent (few drops) Green color  Result  No change in color – Negative  Pale blue green color – Trace /+  Darker blue green color – 2+ to 4+
  • 73.
    ICTOTEST/TABLETTEST:  Highly Sensitive(0.05 – 0.1mg/dl)  Tablet containing diazo reagent, sulfosalicylic acid, sodium bicarbonate & boric acid Principle  Bilirubin + Diazonium salts  Azobilirubin (in Acidic Medium) (Blue / Purple) REAGENTTEST STRIPS Bilirubin + 2-4 dichloroaniline Cream buff to tan
  • 74.
     NITRITES  Ecoli, klebsiella, proteus  Nitrite + p-arsanilic acid (acid pH) diazonium salt + benzoquinoline (PINK COLOR) culture  LEUKOCYTE ESTERASE  Reagent-strip test for pyuria (leukocytes in urine)  The intracellular esterases (bacterial) catalyze hydrolysis of esters, releasing a product that reacts with a diazonium salt to produce a colored product.
  • 75.
    • Analyzes theintensity and color of light reflected from the reagent areas of a urinalysis test strip. • LEDs and (CMOS) • Reads the color change in the urine strips after a sample is applie Wavelength Photometry Refractive Index – for Sp. Gravity •Semiautomated analyser •Clinitek 200/200+/500 •Chemstrip Urine Analyzer •Urisys 1800 System •Fully automated analyser •Clinitek Atlas •Iris iChemVelocity
  • 77.
     A wellmixed sample of urine (10 ml) is centrifuged in machine for 5 min at 1500 rpm.  The top liquid part (the supernatant) is discarded.  A drop of urine left at the bottom of the test tube (the urine sediment) is placed on glass slide and covered with cover slip. It is examined under high power  Contents of normal urine m/s  Contains few epithelial cells, occasional RBC’s, few crystals
  • 78.
     Types ofmaterials that may be found include:  Red blood cells  White blood cells  Epithelial cells  Casts  Crystals  Others
  • 79.
     TYPE  Erythrocytes Leucocytes ▪ Neutrophils ▪ Eosinophils ▪ Lymphocytes  Epithelial Cells ▪ Tubular cells ▪ Uroepithelial cells ▪ Squamous cells
  • 80.
    MATRIX • Hyaline • Waxy INCLUSIONS •Granules- proteins, cell debris • Fat globules- triglycerides, cholestrol esters • Hemosiderin granules • Melanin granules- rare PIGMENTS • Haemoglobin • Myoglobin • Bilirubin • Drugs CELLS • Erythocyte casts • Leucocytes : neutrophils, lymphocytes, monocytes • Renal tubular epithelial cells • Mixed cells : erythrocytes, neutrophils and renal tubular cells. • Bacteria.
  • 81.
    • Amorphous Urate •Crystalline Urate • Calcium Oxalate Crystals found in normal acid urine • Amorphous Phosphate • Crystalline Phosphate • Calcium Carbonate • Ammonium Bi-urate Crystals found in normal alkaline urine
  • 82.
     Tumor Cells Viral Inclusions  Bacteria  Fungi  Parasites
  • 83.
    Flow cytometry • SysmexUF-50, 100 Auto Particle Recognition (APR) • Iris Q200 • A known volume of urine passes in front of a microscope objective. •A camera takes 500 fields per sample. •The particles are classified using a model of a neural network used by the software: Auto-Particle Recognition (APR™). •For samples with very abnormal particles, a user can visually confirm the identification of those particles according to their morphological details seen on the screen •Minimum size of the recognized particles is 3 μm