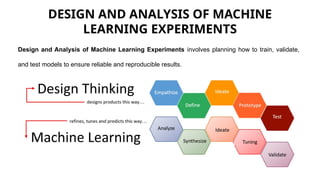
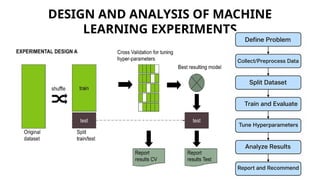
UNIT V DESIGN AND ANALYSIS OF MACHINE LEARNING EXPERIMENTS
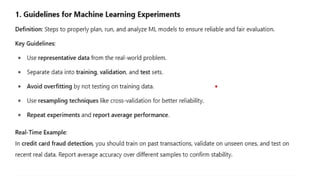
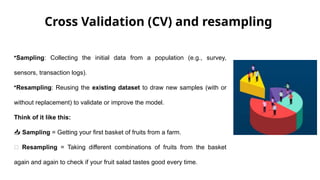
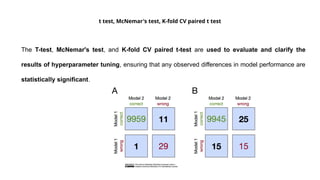
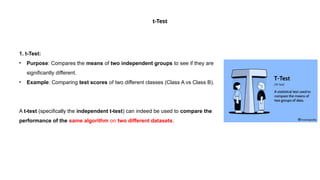
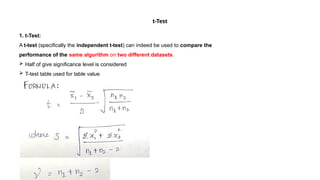
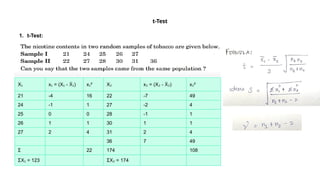
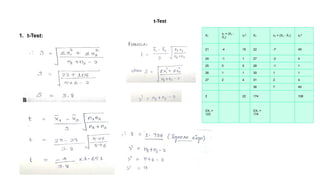
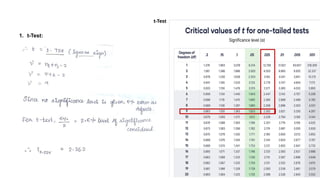
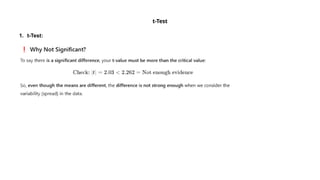
Guidelines for machine learning experiments, Cross Validation (CV) and resampling - K-fold CV, bootstrapping, measuring classifier performance, assessing a single classification algorithm and comparing two classification algorithms - t test, McNemar's test, K-fold CV paired t test