


![References
49
• John, Arlene & Panicker, Rajesh & Cardiff, Barry & Lian, Yong &
John, Deepu. (2020). Binary Classifiers for Data Integrity Detection
in Wearable IoT Edge Devices. IEEE Open Journal of Circuits and
Systems. 1. 88-99. 10.1109/OJCAS.2020.3009520.
• Exploring the clinical features of narcolepsy type 1 versus
narcolepsy type 2 from European Narcolepsy Network database
with machine learning - Scientific Figure on ResearchGate. Available
from: https://www.researchgate.net/figure/A-simple-example-of-
visualizing-gradient-boosting_fig5_326379229 [accessed 3 May,
2022]](https://image.slidesharecdn.com/slideshareactu-real11may2022-220513131117-8edc5660/85/Data-Integrity-in-Decentralized-Clinical-Trials-DCTs-49-320.jpg)


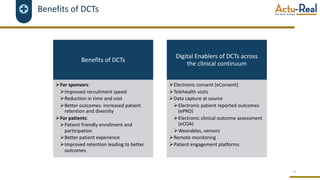
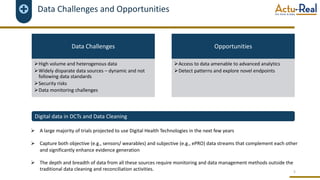
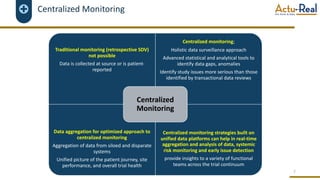
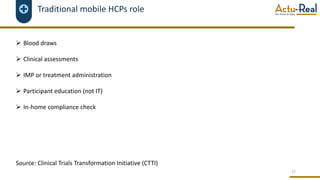
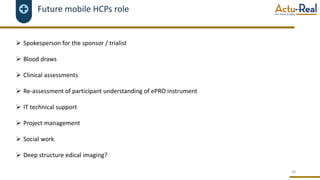
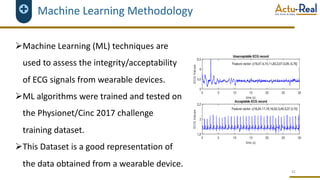
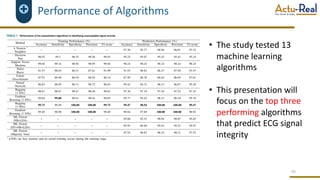
The document discusses the benefits and challenges of decentralized clinical trials (DCTs), emphasizing improved patient recruitment, retention, and experience, as well as the need for advanced data management and monitoring strategies due to the high volume of diverse data sources. It highlights the role of centralized monitoring and advanced statistical methods in ensuring data integrity, identifying issues in real-time, and detecting anomalies in clinical trial data. Furthermore, it outlines future trends in integrating artificial intelligence and machine learning for enhanced data analysis and monitoring processes.


![谷歌留痕技术 [ 𝙩𝙤𝙥 𝟮𝟯𝟯. 𝙘 𝙤𝙢 ]](https://cdn.slidesharecdn.com/ss_thumbnails/top233-260130174328-3833018c-thumbnail.jpg?width=640&height=640&fit=bounds)


