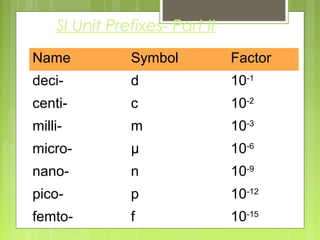
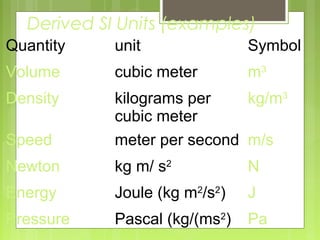
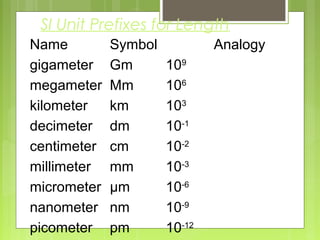
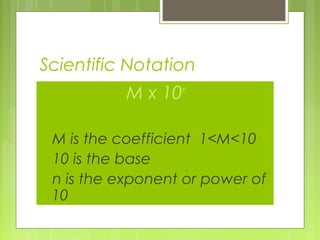
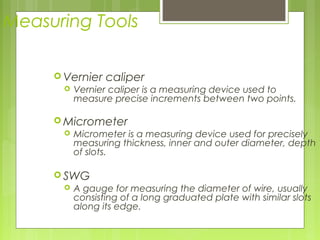
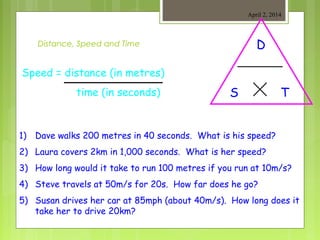
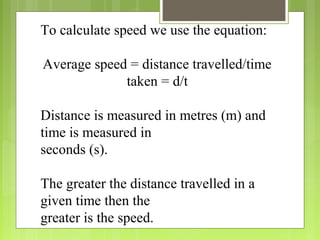
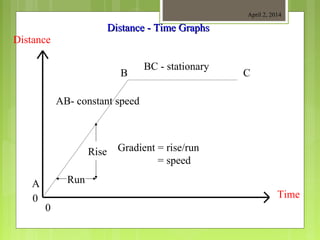
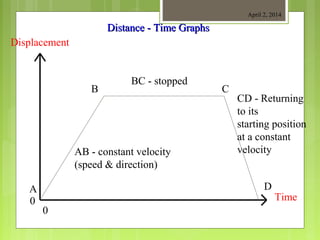
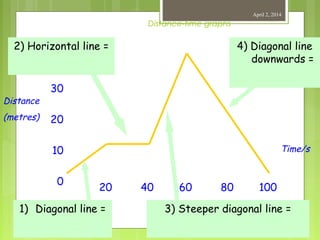
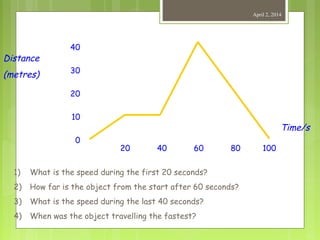
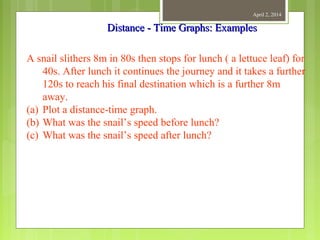
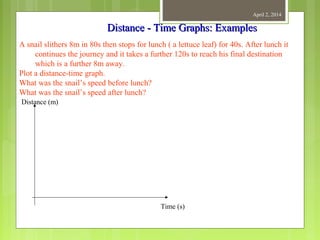
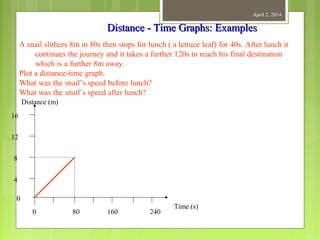
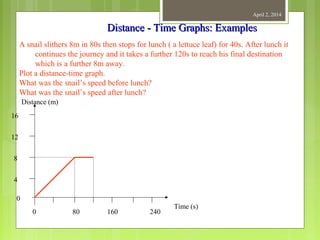
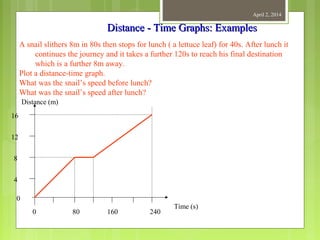
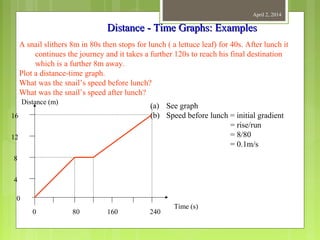
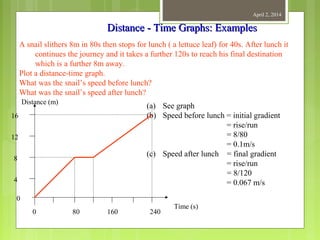
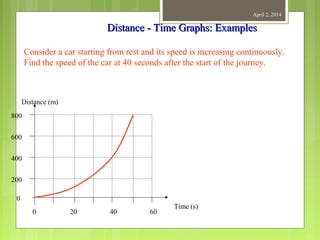
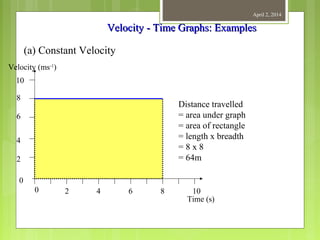
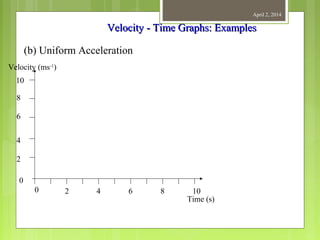
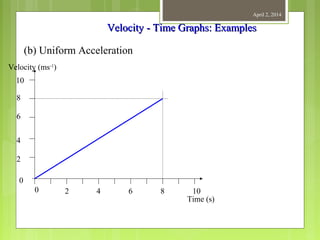
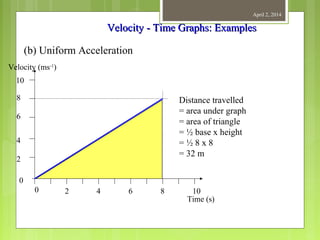
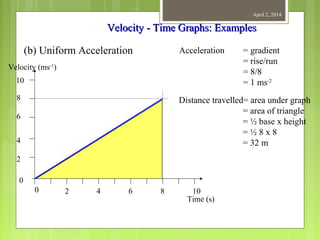
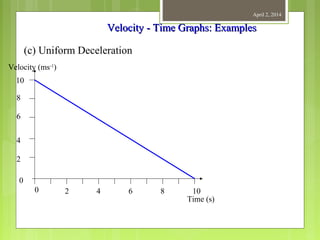
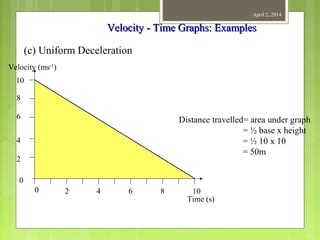
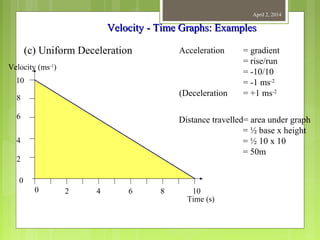
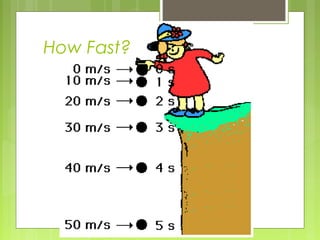
Chapter 1
Measurements
Units of Measurement
Measurement
You are making a measurement when you
♦Check you weight
♦Read your watch
♦Take your temperature
♦Weigh a cantaloupe
What kinds of measurements did you
make today?
Standards of Measurement
When we measure, we use a measuring tool to
compare some dimension of an object to a
standard.
Some Tools for Measurement
Units of Measurements
MKS: meters (m), Kilogram (kg), second (s)
kilometer (km), hour (h)
CGS: centimeter (cm), gram (g), second (s)
FPS: foot (ft.), pound (lb.), second (s)
miles (mi.), hour (h)
Learning Check
From the previous slide, state the tool (s)
you would use to measure
A. temperature ____________________
B. volume ____________________
____________________
C. time ____________________
D. weight ____________________
Solution
From the previous slide, state the tool (s) you would
use to measure
A. temperature thermometer
B. volume measuring cup,
graduated cylinder
C. time watch
D. weight scale
Learning Check
What are some U.S. units that are used to
measure each of the following?
A. length
B. volume
C. weight
D. temperature
Solution
Some possible answers are
A. length inch, foot, yard, mile
B. volume cup, teaspoon, gallon, pint, quart
C. weight ounce, pound (lb), ton
D. temperature °F
Metric System (SI)
 Is a decimal system based on
10
 Used in most of the world
 Used by scientists and
hospitals
Units in the Metric System
 length meter m
 volume liter L
 mass gram g
 temperature Celsius °C
Stating a Measurement
In every measurement there is a
♦Number
followed by a
♦ Unit from measuring device
Learning Check
What is the unit of measurement in each of
the following examples?
A. The patient’s temperature is 102°F.
B. The sack holds 5 lbs of potatoes.
C. It is 8 miles from your house to school.
D. The bottle holds 2 L of orange soda.
Solution
A. °F (degrees Fahrenheit)
B. lbs (pounds)
C. miles
D. L (liters)
Learning Check
Identify the measurement in metric units.
A. John’s height is
1) 1.5 yards 2) 6 feet 3) 2
meters
B. The volume of saline in the IV bottle is
1) 1 liters 2) 1 quart 3) 2 pints
C. The mass of a lemon is
1) 12 ounces 2) 145 grams 3) 0.6 pounds
The Seven Base SI Units
Quantity Unit Symbol
Length meter m
Mass kilogram kg
Temperature kelvin K
Time second s
Amount of
Substance
mole mol
Luminous Intensity candela cd
Electric Current ampere a
SI Unit Prefixes - Part I
Name Symbol Factor
tera- T 1012
giga- G 109
mega- M 106
kilo- k 103
hecto- h 102
deka- da 101
SI Unit Prefixes- Part II
Name Symbol Factor
deci- d 10-1
centi- c 10-2
milli- m 10-3
micro- μ 10-6
nano- n 10-9
pico- p 10-12
femto- f 10-15
Derived SI Units (examples)
Quantity unit Symbol
Volume cubic meter m3
Density kilograms per
cubic meter
kg/m3
Speed meter per second m/s
Newton kg m/ s2
N
Energy Joule (kg m2
/s2
) J
Pressure Pascal (kg/(ms2
) Pa
SI Unit Prefixes for Length
Name Symbol Analogy
gigameter Gm 109
megameter Mm 106
kilometer km 103
decimeter dm 10-1
centimeter cm 10-2
millimeter mm 10-3
micrometer μm 10-6
nanometer nm 10-9
picometer pm 10-12
Scientific Notation
M x 10n
M is the coefficient 1<M<10
10 is the base
n is the exponent or power of
10
Factor-Label Method of Unit
Conversion: Example
Example: Convert 789m to km:
789m x 1km =0.789km= 7.89x10-
1
km
1000m
Limits of Measurement
Accuracy and Precision
Accuracy - a measure of
how close a measurement is
to the true value of the
quantity being measured.
Example: Accuracy
Who is more accurate when
measuring a book that has a
true length of 17.0cm?
Susan:
17.0cm, 16.0cm, 18.0cm, 15.0cm
Amy:
15.5cm, 15.0cm, 15.2cm, 15.3cm
Precision – a measure of how
close a series of measurements
are to one another. A measure
of how exact a measurement
is.
Example: Precision
Who is more precise when
measuring the same 17.0cm
book?
Susan:
17.0cm, 16.0cm, 18.0cm, 15.0cm
Amy:
15.5cm, 15.0cm, 15.2cm, 15.3cm
Significant Figures
The significant figures in
a measurement include
all of the digits that are
known, plus one last digit
that is estimated.
Finding the Number of Sig Figs:
 When the decimal is present, start counting from the
left.
 When the decimal is absent, start counting from the
right.
 Zeroes encountered before a non zero digit do not
count.
Measuring Tools
 Vernier caliper
 Vernier caliper is a measuring device used to
measure precise increments between two points.
 Micrometer
 Micrometer is a measuring device used for precisely
measuring thickness, inner and outer diameter, depth
of slots.
 SWG
 A gauge for measuring the diameter of wire, usually
consisting of a long graduated plate with similar slots
along its edge.
Vernier caliper
 Function
 To measure smaller distances
 Can measure up to .001 inch or .01mm.
 Features
 Larger, lower jaws are designed to measure outer
points e.g. diameter of a rod.
 Top jaws are designed to measure inside points
e.g. size of a hole.
 A rod extends from the rear of the caliper and can
be used to measure the depth.
Structure of Vernier caliper
Structure of the Vernier caliper
 Main Scale
 Main scale is graduated in cm and mm.
 Vernier Scale
 It slides on the main scale.
 On Vernier scale 0.9cm is divided into 10 equal
parts.
 Jaws
 Two inside jaws (Upper)
 Two outside jaws (Lower)
Least Count
 Least count (L.C) is the smallest reading we
can measure with the instrument.
 L.C = one main scale division – one
vernier scale division
L.C = 1mm – 0.09mm
L.C = 0.1mm = 0.01cm
 Least Count = Value of the smallest division
on MS/ Total number of division on VS
L.C = 1mm / 10 = 0.1 cm / 10 = 0.01cm
Reading of the Instrument
 Reading of the instrument = MS div +
(coinciding VS div x L.C)
 = 3.2 + (3 x 0.01)
 = 3.2 + 0.03
 = 3.23 cm
Micrometer
 Function
 Micrometer allows the measurement of the size of
the body i.e. thickness, depth, inner/outer
diameter.
 Features
 Two jaws (one fixed, one movable)
 Spring loaded twisting handle
 Easy to use and more précised
 Can measure up to .001cm
Structure of the Micrometer
Structure of Micrometer
 Jaws
 2 jaws (one fixed, one movable)
 Circular Scale
 Movable jaw is attached to a screw, scale on this
screw is called Circular scale.
 Either 50 or 100 divisions
 Linear Scale
 Horizontal Scale
Structure of Micrometer
 Frame
 The C-shaped body that holds the anvil and sleeve in constant
relation to each other.
 Anvil
 The jaw which remains stationary.
 Spindle
 The jaw which moves towards the anvil.
 Lock Nut
 A lever, one can tighten to hold the spindle stationary.
 Sleeve
 The stationary round part with the linear scale on it. (Main Scale)
 Thimble
 Thimble rotates around the sleeve.
 Ratchet Stop
 Device on end of handle that limits applied pressure by slipping at
a calibrated torque.
Pitch of Micrometer
 When the head of the micrometer rotate
through one rotation, called pitch of the
micrometer.
 The screw moves forward or backward 1mm on
the linear scale.
 Pitch of Micrometer = distance on linear
scale / one rotation
Pitch of Micrometer = 1/1 = 1mm
Reading of the Instrument
 Reading of the instrument = MS div +
(coinciding CS div x L.C)
 = 8+ (12 x 0.01)
 = 8 + 0.120mm
 = 8.120 mm = 8120 µm
Scalars A scalar quantity is a quantity that has magnitude
only and has no direction in space
Examples of Scalar Quantities:
 Length
 Area
 Volume
 Time
 Mass
Vectors A vector quantity is a quantity that has both
magnitude and a direction in space
Examples of Vector Quantities:
 Displacement
 Velocity
 Acceleration
 Force
Vector Diagrams Vector diagrams are
shown using an arrow
 The length of the arrow
represents its
magnitude
 The direction of the
arrow shows its direction
April 2, 2014
Speed is defined as the distance travelled per unit time and
has the units of m/s or ms-1.
Distance, Speed and Time
April 2, 2014
Speed = distance (in metres)
time (in seconds)
D
TS
1) Dave walks 200 metres in 40 seconds. What is his speed?
2) Laura covers 2km in 1,000 seconds. What is her speed?
3) How long would it take to run 100 metres if you run at 10m/s?
4) Steve travels at 50m/s for 20s. How far does he go?
5) Susan drives her car at 85mph (about 40m/s). How long does it
take her to drive 20km?
April 2, 2014
Speed is defined as the distance travelled per unit time and
has the units of m/s or ms-1.
Velocity is speed in a given direction and has the same units
as speed.
Speed vs. Velocity
April 2, 2014
Speed is simply how fast you are travelling…
Velocity is “speed in a given direction”…
This car is travelling at a
speed of 20m/s
This car is travelling at a
velocity of 20m/s east
April 2, 2014
Speed is defined as the distance travelled per
unit time and has the units of m/s or ms-1.
Velocity is speed in a given direction and has
the same units as speed.
To calculate speed we use the equation:
Average speed = distance travelled/time
taken = d/t
Distance is measured in metres (m) and
time is measured in
seconds (s).
The greater the distance travelled in a
given time then the
greater is the speed.
April 2, 2014
A useful way to illustrate how the distance
throughout a journey varies with time is to plot a
DISTANCE AGAINST TIME graph.
This gives us a visual representation of how the
journey progressed
and allows us to see quickly how long each stage
of the journey took
compared with the other stages.
The steepness (gradient) will also give us the
speed.
The following graphs show how the shape of
distance-time graphs
may vary and how to interpret them
April 2, 2014
Distance
Time0
0
A
B C
AB- constant speed
BC - stationary
Gradient = rise/run
= speed
Rise
Run
Distance - Time GraphsDistance - Time Graphs
April 2, 2014
DISTANCE is a SCALAR quantity and has size only but
DISPLACEMENT is a VECTOR quantity and has size (or
magnitude) and DIRECTION.
10 metres is a distance (size only) but 10 metres due south
(size and direction) is a vector quantity.
If we use DISPLACEMENT instead of distance then the
graph will also give an indication of the direction taken with
respect to its starting point.
April 2, 2014
Displacement
Time0
0
AB - constant velocity
(speed & direction)
BC - stopped
CD - Returning
to its
starting position
at a constant
velocity
A
B C
D
Distance - Time GraphsDistance - Time Graphs
Distance-time graphs
April 2, 2014
40
30
20
10
0
20 40 60 80 100
4) Diagonal line
downwards =
3) Steeper diagonal line =1) Diagonal line =
2) Horizontal line =
Distance
(metres)
Time/s
April 2, 2014
40
30
20
10
0
20 40 60 80 100
1) What is the speed during the first 20 seconds?
2) How far is the object from the start after 60 seconds?
3) What is the speed during the last 40 seconds?
4) When was the object travelling the fastest?
Distance
(metres)
Time/s
April 2, 2014
Distance - Time Graphs: ExamplesDistance - Time Graphs: Examples
A snail slithers 8m in 80s then stops for lunch ( a lettuce leaf) for
40s. After lunch it continues the journey and it takes a further
120s to reach his final destination which is a further 8m
away.
(a) Plot a distance-time graph.
(b) What was the snail’s speed before lunch?
(c) What was the snail’s speed after lunch?
April 2, 2014
Distance - Time Graphs: ExamplesDistance - Time Graphs: Examples
A snail slithers 8m in 80s then stops for lunch ( a lettuce leaf) for 40s. After lunch it
continues the journey and it takes a further 120s to reach his final destination
which is a further 8m away.
Plot a distance-time graph.
What was the snail’s speed before lunch?
What was the snail’s speed after lunch?
Distance (m)
Time (s)
0
4
8
12
16
800 160 240
April 2, 2014
Distance - Time Graphs: ExamplesDistance - Time Graphs: Examples
A snail slithers 8m in 80s then stops for lunch ( a lettuce leaf) for 40s. After lunch it
continues the journey and it takes a further 120s to reach his final destination
which is a further 8m away.
Plot a distance-time graph.
What was the snail’s speed before lunch?
What was the snail’s speed after lunch?
Distance (m)
Time (s)
0
4
8
12
16
0 80 160 240
April 2, 2014
Distance - Time Graphs: ExamplesDistance - Time Graphs: Examples
A snail slithers 8m in 80s then stops for lunch ( a lettuce leaf) for 40s. After lunch it
continues the journey and it takes a further 120s to reach his final destination
which is a further 8m away.
Plot a distance-time graph.
What was the snail’s speed before lunch?
What was the snail’s speed after lunch?
Distance (m)
Time (s)
0
0
4
8
12
16
80 160 240
April 2, 2014
Distance - Time Graphs: ExamplesDistance - Time Graphs: Examples
A snail slithers 8m in 80s then stops for lunch ( a lettuce leaf) for 40s. After lunch it
continues the journey and it takes a further 120s to reach his final destination
which is a further 8m away.
Plot a distance-time graph.
What was the snail’s speed before lunch?
What was the snail’s speed after lunch?
Distance (m)
Time (s)
0
0
(a) See graph
(b) Speed before lunch = initial gradient
= rise/run
= 8/80
= 0.1m/s
4
8
12
16
80 160 240
April 2, 2014
Distance - Time Graphs: ExamplesDistance - Time Graphs: Examples
A snail slithers 8m in 80s then stops for lunch ( a lettuce leaf) for 40s. After lunch it
continues the journey and it takes a further 120s to reach his final destination
which is a further 8m away.
Plot a distance-time graph.
What was the snail’s speed before lunch?
What was the snail’s speed after lunch?
Distance (m)
Time (s)
0
4
8
12
16
0 80 160 240
April 2, 2014
Distance - Time Graphs: ExamplesDistance - Time Graphs: Examples
A snail slithers 8m in 80s then stops for lunch ( a lettuce leaf) for 40s. After lunch it
continues the journey and it takes a further 120s to reach his final destination
which is a further 8m away.
Plot a distance-time graph.
What was the snail’s speed before lunch?
What was the snail’s speed after lunch?
Distance (m)
Time (s)
0
0
4
8
12
16
80 160 240
April 2, 2014
Distance - Time Graphs: ExamplesDistance - Time Graphs: Examples
A snail slithers 8m in 80s then stops for lunch ( a lettuce leaf) for 40s. After lunch it
continues the journey and it takes a further 120s to reach his final destination
which is a further 8m away.
Plot a distance-time graph.
What was the snail’s speed before lunch?
What was the snail’s speed after lunch?
Distance (m)
Time (s)
0
0
4
8
12
16
80 160 240
April 2, 2014
Distance - Time Graphs: ExamplesDistance - Time Graphs: Examples
A snail slithers 8m in 80s then stops for lunch ( a lettuce leaf) for 40s. After lunch it
continues the journey and it takes a further 120s to reach his final destination
which is a further 8m away.
Plot a distance-time graph.
What was the snail’s speed before lunch?
What was the snail’s speed after lunch?
Distance (m)
Time (s)
0
0
(a) See graph
(b) Speed before lunch = initial gradient
= rise/run
= 8/80
= 0.1m/s
4
8
12
16
80 160 240
April 2, 2014
Distance - Time Graphs: ExamplesDistance - Time Graphs: Examples
A snail slithers 8m in 80s then stops for lunch ( a lettuce leaf) for 40s. After lunch it
continues the journey and it takes a further 120s to reach his final destination
which is a further 8m away.
Plot a distance-time graph.
What was the snail’s speed before lunch?
What was the snail’s speed after lunch?
Distance (m)
Time (s)
0
0
(a) See graph
(b) Speed before lunch = initial gradient
= rise/run
= 8/80
= 0.1m/s
(c) Speed after lunch = final gradient
= rise/run
= 8/120
= 0.067 m/s4
8
12
16
80 160 240
April 2, 2014
Distance - Time Graphs: ExamplesDistance - Time Graphs: Examples
Consider a car starting from rest and its speed is increasing continuously.
Distance (m)
Time (s)
0
200
400
600
800
200 40 60
April 2, 2014
Distance - Time Graphs: ExamplesDistance - Time Graphs: Examples
Consider a car starting from rest and its speed is increasing continuously.
Find the speed of the car at 40 seconds after the start of the journey.
Distance (m)
Time (s)
0
200
400
600
800
200 40 60
April 2, 2014
Acceleration is defined as the change in velocity in
unit time and has the units m/s/s or m/s2
or ms-2
Acceleration is a vector quantity and so has size and
direction.
Velocity - Time GraphsVelocity - Time Graphs
To calculate acceleration we use the equation:
Average acceleration = change in
velocity/time taken
= (final velocity – initial
velocity)/time taken
= (v – u)/t
Velocity is measured in metres per second (m/s)
and time is measured in seconds (s).
The greater the change in velocity in a given time
then the greater is the acceleration.
Acceleration
April 2, 2014
V-U
TA
Acceleration = change in velocity (in m/s)
(in m/s2
) time taken (in s)
1) A cyclist accelerates from 0 to 10m/s in 5 seconds. What is her
acceleration?
2) A ball is dropped and accelerates downwards at a rate of 10m/s2
for 12
seconds. How much will the ball’s velocity increase by?
3) A car accelerates from 10 to 20m/s with an acceleration of 2m/s2
. How
long did this take?
4) A rocket accelerates from 1,000m/s to 5,000m/s in 2 seconds. What is
its acceleration?
April 2, 2014
A useful way to illustrate how the velocity throughout a
journey varies with time is to plot a VELOCITY
AGAINST TIME graph.
This gives us a visual representation of how the journey
progressed
and allows us to see quickly how long each stage of the
journey took
compared with the other stages.
.
Velocity - Time GraphsVelocity - Time Graphs
The steepness (gradient) will also give us the
ACCELERATION.
The area under a velocity-time graph gives us the
distance travelled.
The following graphs show how the shape of velocity-
time graphs
may vary and how to interpret them
April 2, 2014
Velocity
Time0
0
A
B C
AB- constant acceleration
BC - constant velocity
Gradient = rise/run
= acceleration (m/s2
)
Rise
Run
Velocity - Time GraphsVelocity - Time Graphs
April 2, 2014
Velocity
Time0
0
A
B
C
D E
Constant Acceleration
Constant Velocity
At B,C & D there is
instantaneous change in acceleration
Area Under Graph = Total Distance Travelled
Velocity - Time GraphsVelocity - Time Graphs
April 2, 2014
Velocity - Time Graphs: ExamplesVelocity - Time Graphs: Examples
(a) Constant Velocity
Velocity (ms-1
)
Time (s)
10
8
6
4
2
0
0 2 4 6 8 10
April 2, 2014
Velocity - Time Graphs: ExamplesVelocity - Time Graphs: Examples
(a) Constant Velocity
Velocity (ms-1
)
Time (s)
10
8
6
4
2
0
0 2 4 6 8 10
Distance travelled
= area under graph
= area of rectangle
= length x breadth
= 8 x 8
= 64m
April 2, 2014
Velocity - Time Graphs: ExamplesVelocity - Time Graphs: Examples
(b) Uniform Acceleration
Velocity (ms-1
)
Time (s)
10
8
6
4
2
0
0 2 4 6 8 10
April 2, 2014
Velocity - Time Graphs: ExamplesVelocity - Time Graphs: Examples
(b) Uniform Acceleration
Velocity (ms-1
)
Time (s)
10
8
6
4
2
0
0 2 4 6 8 10
April 2, 2014
Velocity - Time Graphs: ExamplesVelocity - Time Graphs: Examples
(b) Uniform Acceleration
Velocity (ms-1
)
Time (s)
10
8
6
4
2
0
0 2 4 6 8 10
Distance travelled
= area under graph
= area of triangle
= ½ base x height
= ½ 8 x 8
= 32 m
April 2, 2014
Velocity - Time Graphs: ExamplesVelocity - Time Graphs: Examples
(b) Uniform Acceleration
Velocity (ms-1
)
Time (s)
10
8
6
4
2
0
0 2 4 6 8 10
Distance travelled= area under graph
= area of triangle
= ½ base x height
= ½ 8 x 8
= 32 m
Acceleration = gradient
= rise/run
= 8/8
= 1 ms-2
April 2, 2014
Velocity - Time Graphs: ExamplesVelocity - Time Graphs: Examples
(c) Uniform Deceleration
Velocity (ms-1
)
Time (s)
10
8
6
4
2
0
0 2 4 6 8 10
April 2, 2014
Velocity - Time Graphs: ExamplesVelocity - Time Graphs: Examples
(c) Uniform Deceleration
Velocity (ms-1
)
Time (s)
10
8
6
4
2
0
0 2 4 6 8 10
Distance travelled= area under graph
= ½ base x height
= ½ 10 x 10
= 50m
April 2, 2014
Velocity - Time Graphs: ExamplesVelocity - Time Graphs: Examples
(c) Uniform Deceleration
Velocity (ms-1
)
Time (s)
10
8
6
4
2
0
0 2 4 6 8 10
Distance travelled= area under graph
= ½ base x height
= ½ 10 x 10
= 50m
Acceleration = gradient
= rise/run
= -10/10
= -1 ms-2
(Deceleration = +1 ms-2
April 2, 2014
A car starts from rest and accelerates uniformly to 20m/s in 10
seconds.
It travels at this velocity for a further 30 seconds before decelerating
uniformly to rest in 5 seconds.
(a) draw a velocity - time graph of the car’s journey
(b) calculate the car’s initial acceleration
(c) calculate the car’s final deceleration
(d) calculate the total distance travelled by the car
(e) calculate the distance travelled by the car in the final 25
seconds
Velocity - Time Graphs: ExampleVelocity - Time Graphs: Example
April 2, 2014
Velocity
Time0
0
20
(m/s)
(s)
10 40 45
Initial acceleration
= initial gradient
= rise/run
= 20/10
= 2m/s2
Velocity - Time GraphsVelocity - Time Graphs
April 2, 2014
Velocity
Time0
0
20
(m/s)
(s)
10 40 45
final acceleration
= final gradient
= rise/run
= -20/5
= -4m/s2
Velocity - Time GraphsVelocity - Time Graphs
April 2, 2014
Velocity
Time0
0
20
(m/s)
(s)
10 40 45
A B C
Total distance travelled = total area under graph
= area A + B + C = ½ x 10 x 20 + 30 x 20 + ½ x 5 x 20
= 100 + 600 + 50 = 750m
Velocity - Time GraphsVelocity - Time Graphs
April 2, 2014
Velocity
Time0
0
20
(m/s)
(s)
10 40 45
C
Distance travelled in final 25s = part area under graph
= area D + C = 20 x 20 + ½ x 5 x 20
= 400 + 50 = 450m
D
20
Velocity - Time GraphsVelocity - Time Graphs
April 2, 2014
Velocity - Time Graphs: ExamplesVelocity - Time Graphs: Examples
(b) Uniform Acceleration
Velocity (ms-1
)
Time (s)
10
8
6
4
2
0
0 2 4 6 8 10
Distance travelled= area under graph
= area of triangle
= ½ base x height
= ½ 8 x 8
= 32 m
Acceleration = gradient
= rise/run
= 8/8
= 1 ms-2
Velocity-time graphs
April 2, 2014
80
60
40
20
0
10 20 30 40 50
Velocity
m/s
T/s
1) Upwards line =
2) Horizontal line = 3) Steeper line =
4) Downward line =
April 2, 2014
80
60
40
20
0
1) How fast was the object going after 10 seconds?
2) What is the acceleration from 20 to 30 seconds?
3) What was the deceleration from 30 to 50s?
4) How far did the object travel altogether?
10 20 30 40 50
Velocity
m/s
T/s
THE
ACCELERATION
OF FREE FALL
Questions:
 Do heavier objects fall faster than lighter ones when
starting from the same position?
 Does air resistance matter?
 If the free fall motion has a constant acceleration,
what is this acceleration and how was it found?
 How do we solve problems involving free fall?
Galileo (1564 –
1642) and the
leaning tower
of Pisa.
Air Resistance
 The force of friction or drag acting on an
object in a direction opposing its motion
as it moves through air.
Hammer & Feather in the
presence of air
Hammer & Feather in the
absence of air
 If the free fall motion has a constant
acceleration, what is this acceleration
and how was it found?
If there were no air resistance both
objects would fall with the same
downward acceleration ;9.8 m/s2.this is
called the acceleration of free fall
 The acceleration of free fall if represented
by the symbol ‘g’.
 Its value varies from one place on earth to
another
 Moving away from the earth and out into
space ,g decreases
 The value of g near the earth surafce is
close to 10 m/s
How Fast?

Unit 1

  • 1.
  • 2.
    Measurement You are makinga measurement when you ♦Check you weight ♦Read your watch ♦Take your temperature ♦Weigh a cantaloupe What kinds of measurements did you make today?
  • 3.
    Standards of Measurement Whenwe measure, we use a measuring tool to compare some dimension of an object to a standard.
  • 4.
    Some Tools forMeasurement
  • 5.
    Units of Measurements MKS:meters (m), Kilogram (kg), second (s) kilometer (km), hour (h) CGS: centimeter (cm), gram (g), second (s) FPS: foot (ft.), pound (lb.), second (s) miles (mi.), hour (h)
  • 6.
    Learning Check From theprevious slide, state the tool (s) you would use to measure A. temperature ____________________ B. volume ____________________ ____________________ C. time ____________________ D. weight ____________________
  • 7.
    Solution From the previousslide, state the tool (s) you would use to measure A. temperature thermometer B. volume measuring cup, graduated cylinder C. time watch D. weight scale
  • 8.
    Learning Check What aresome U.S. units that are used to measure each of the following? A. length B. volume C. weight D. temperature
  • 9.
    Solution Some possible answersare A. length inch, foot, yard, mile B. volume cup, teaspoon, gallon, pint, quart C. weight ounce, pound (lb), ton D. temperature °F
  • 10.
    Metric System (SI) Is a decimal system based on 10  Used in most of the world  Used by scientists and hospitals
  • 11.
    Units in theMetric System  length meter m  volume liter L  mass gram g  temperature Celsius °C
  • 12.
    Stating a Measurement Inevery measurement there is a ♦Number followed by a ♦ Unit from measuring device
  • 13.
    Learning Check What isthe unit of measurement in each of the following examples? A. The patient’s temperature is 102°F. B. The sack holds 5 lbs of potatoes. C. It is 8 miles from your house to school. D. The bottle holds 2 L of orange soda.
  • 14.
    Solution A. °F (degreesFahrenheit) B. lbs (pounds) C. miles D. L (liters)
  • 15.
    Learning Check Identify themeasurement in metric units. A. John’s height is 1) 1.5 yards 2) 6 feet 3) 2 meters B. The volume of saline in the IV bottle is 1) 1 liters 2) 1 quart 3) 2 pints C. The mass of a lemon is 1) 12 ounces 2) 145 grams 3) 0.6 pounds
  • 16.
    The Seven BaseSI Units Quantity Unit Symbol Length meter m Mass kilogram kg Temperature kelvin K Time second s Amount of Substance mole mol Luminous Intensity candela cd Electric Current ampere a
  • 17.
    SI Unit Prefixes- Part I Name Symbol Factor tera- T 1012 giga- G 109 mega- M 106 kilo- k 103 hecto- h 102 deka- da 101
  • 18.
    SI Unit Prefixes-Part II Name Symbol Factor deci- d 10-1 centi- c 10-2 milli- m 10-3 micro- μ 10-6 nano- n 10-9 pico- p 10-12 femto- f 10-15
  • 19.
    Derived SI Units(examples) Quantity unit Symbol Volume cubic meter m3 Density kilograms per cubic meter kg/m3 Speed meter per second m/s Newton kg m/ s2 N Energy Joule (kg m2 /s2 ) J Pressure Pascal (kg/(ms2 ) Pa
  • 20.
    SI Unit Prefixesfor Length Name Symbol Analogy gigameter Gm 109 megameter Mm 106 kilometer km 103 decimeter dm 10-1 centimeter cm 10-2 millimeter mm 10-3 micrometer μm 10-6 nanometer nm 10-9 picometer pm 10-12
  • 21.
    Scientific Notation M x10n M is the coefficient 1<M<10 10 is the base n is the exponent or power of 10
  • 22.
    Factor-Label Method ofUnit Conversion: Example Example: Convert 789m to km: 789m x 1km =0.789km= 7.89x10- 1 km 1000m
  • 23.
  • 24.
    Accuracy - ameasure of how close a measurement is to the true value of the quantity being measured.
  • 25.
    Example: Accuracy Who ismore accurate when measuring a book that has a true length of 17.0cm? Susan: 17.0cm, 16.0cm, 18.0cm, 15.0cm Amy: 15.5cm, 15.0cm, 15.2cm, 15.3cm
  • 26.
    Precision – ameasure of how close a series of measurements are to one another. A measure of how exact a measurement is.
  • 27.
    Example: Precision Who ismore precise when measuring the same 17.0cm book? Susan: 17.0cm, 16.0cm, 18.0cm, 15.0cm Amy: 15.5cm, 15.0cm, 15.2cm, 15.3cm
  • 28.
    Significant Figures The significantfigures in a measurement include all of the digits that are known, plus one last digit that is estimated.
  • 29.
    Finding the Numberof Sig Figs:  When the decimal is present, start counting from the left.  When the decimal is absent, start counting from the right.  Zeroes encountered before a non zero digit do not count.
  • 30.
    Measuring Tools  Verniercaliper  Vernier caliper is a measuring device used to measure precise increments between two points.  Micrometer  Micrometer is a measuring device used for precisely measuring thickness, inner and outer diameter, depth of slots.  SWG  A gauge for measuring the diameter of wire, usually consisting of a long graduated plate with similar slots along its edge.
  • 31.
    Vernier caliper  Function To measure smaller distances  Can measure up to .001 inch or .01mm.  Features  Larger, lower jaws are designed to measure outer points e.g. diameter of a rod.  Top jaws are designed to measure inside points e.g. size of a hole.  A rod extends from the rear of the caliper and can be used to measure the depth.
  • 32.
  • 33.
    Structure of theVernier caliper  Main Scale  Main scale is graduated in cm and mm.  Vernier Scale  It slides on the main scale.  On Vernier scale 0.9cm is divided into 10 equal parts.  Jaws  Two inside jaws (Upper)  Two outside jaws (Lower)
  • 34.
    Least Count  Leastcount (L.C) is the smallest reading we can measure with the instrument.  L.C = one main scale division – one vernier scale division L.C = 1mm – 0.09mm L.C = 0.1mm = 0.01cm  Least Count = Value of the smallest division on MS/ Total number of division on VS L.C = 1mm / 10 = 0.1 cm / 10 = 0.01cm
  • 35.
    Reading of theInstrument  Reading of the instrument = MS div + (coinciding VS div x L.C)  = 3.2 + (3 x 0.01)  = 3.2 + 0.03  = 3.23 cm
  • 36.
    Micrometer  Function  Micrometerallows the measurement of the size of the body i.e. thickness, depth, inner/outer diameter.  Features  Two jaws (one fixed, one movable)  Spring loaded twisting handle  Easy to use and more précised  Can measure up to .001cm
  • 37.
    Structure of theMicrometer
  • 38.
    Structure of Micrometer Jaws  2 jaws (one fixed, one movable)  Circular Scale  Movable jaw is attached to a screw, scale on this screw is called Circular scale.  Either 50 or 100 divisions  Linear Scale  Horizontal Scale
  • 39.
    Structure of Micrometer Frame  The C-shaped body that holds the anvil and sleeve in constant relation to each other.  Anvil  The jaw which remains stationary.  Spindle  The jaw which moves towards the anvil.  Lock Nut  A lever, one can tighten to hold the spindle stationary.  Sleeve  The stationary round part with the linear scale on it. (Main Scale)  Thimble  Thimble rotates around the sleeve.  Ratchet Stop  Device on end of handle that limits applied pressure by slipping at a calibrated torque.
  • 40.
    Pitch of Micrometer When the head of the micrometer rotate through one rotation, called pitch of the micrometer.  The screw moves forward or backward 1mm on the linear scale.  Pitch of Micrometer = distance on linear scale / one rotation Pitch of Micrometer = 1/1 = 1mm
  • 41.
    Reading of theInstrument  Reading of the instrument = MS div + (coinciding CS div x L.C)  = 8+ (12 x 0.01)  = 8 + 0.120mm  = 8.120 mm = 8120 µm
  • 42.
    Scalars A scalarquantity is a quantity that has magnitude only and has no direction in space Examples of Scalar Quantities:  Length  Area  Volume  Time  Mass
  • 43.
    Vectors A vectorquantity is a quantity that has both magnitude and a direction in space Examples of Vector Quantities:  Displacement  Velocity  Acceleration  Force
  • 44.
    Vector Diagrams Vectordiagrams are shown using an arrow  The length of the arrow represents its magnitude  The direction of the arrow shows its direction
  • 45.
    April 2, 2014 Speedis defined as the distance travelled per unit time and has the units of m/s or ms-1.
  • 46.
    Distance, Speed andTime April 2, 2014 Speed = distance (in metres) time (in seconds) D TS 1) Dave walks 200 metres in 40 seconds. What is his speed? 2) Laura covers 2km in 1,000 seconds. What is her speed? 3) How long would it take to run 100 metres if you run at 10m/s? 4) Steve travels at 50m/s for 20s. How far does he go? 5) Susan drives her car at 85mph (about 40m/s). How long does it take her to drive 20km?
  • 47.
    April 2, 2014 Speedis defined as the distance travelled per unit time and has the units of m/s or ms-1. Velocity is speed in a given direction and has the same units as speed.
  • 48.
    Speed vs. Velocity April2, 2014 Speed is simply how fast you are travelling… Velocity is “speed in a given direction”… This car is travelling at a speed of 20m/s This car is travelling at a velocity of 20m/s east
  • 49.
    April 2, 2014 Speedis defined as the distance travelled per unit time and has the units of m/s or ms-1. Velocity is speed in a given direction and has the same units as speed.
  • 50.
    To calculate speedwe use the equation: Average speed = distance travelled/time taken = d/t Distance is measured in metres (m) and time is measured in seconds (s). The greater the distance travelled in a given time then the greater is the speed.
  • 51.
    April 2, 2014 Auseful way to illustrate how the distance throughout a journey varies with time is to plot a DISTANCE AGAINST TIME graph. This gives us a visual representation of how the journey progressed and allows us to see quickly how long each stage of the journey took compared with the other stages.
  • 52.
    The steepness (gradient)will also give us the speed. The following graphs show how the shape of distance-time graphs may vary and how to interpret them
  • 53.
    April 2, 2014 Distance Time0 0 A BC AB- constant speed BC - stationary Gradient = rise/run = speed Rise Run Distance - Time GraphsDistance - Time Graphs
  • 54.
    April 2, 2014 DISTANCEis a SCALAR quantity and has size only but DISPLACEMENT is a VECTOR quantity and has size (or magnitude) and DIRECTION. 10 metres is a distance (size only) but 10 metres due south (size and direction) is a vector quantity. If we use DISPLACEMENT instead of distance then the graph will also give an indication of the direction taken with respect to its starting point.
  • 55.
    April 2, 2014 Displacement Time0 0 AB- constant velocity (speed & direction) BC - stopped CD - Returning to its starting position at a constant velocity A B C D Distance - Time GraphsDistance - Time Graphs
  • 56.
    Distance-time graphs April 2,2014 40 30 20 10 0 20 40 60 80 100 4) Diagonal line downwards = 3) Steeper diagonal line =1) Diagonal line = 2) Horizontal line = Distance (metres) Time/s
  • 57.
    April 2, 2014 40 30 20 10 0 2040 60 80 100 1) What is the speed during the first 20 seconds? 2) How far is the object from the start after 60 seconds? 3) What is the speed during the last 40 seconds? 4) When was the object travelling the fastest? Distance (metres) Time/s
  • 58.
    April 2, 2014 Distance- Time Graphs: ExamplesDistance - Time Graphs: Examples A snail slithers 8m in 80s then stops for lunch ( a lettuce leaf) for 40s. After lunch it continues the journey and it takes a further 120s to reach his final destination which is a further 8m away. (a) Plot a distance-time graph. (b) What was the snail’s speed before lunch? (c) What was the snail’s speed after lunch?
  • 59.
    April 2, 2014 Distance- Time Graphs: ExamplesDistance - Time Graphs: Examples A snail slithers 8m in 80s then stops for lunch ( a lettuce leaf) for 40s. After lunch it continues the journey and it takes a further 120s to reach his final destination which is a further 8m away. Plot a distance-time graph. What was the snail’s speed before lunch? What was the snail’s speed after lunch? Distance (m) Time (s)
  • 60.
    April 2, 2014 Distance- Time Graphs: ExamplesDistance - Time Graphs: Examples A snail slithers 8m in 80s then stops for lunch ( a lettuce leaf) for 40s. After lunch it continues the journey and it takes a further 120s to reach his final destination which is a further 8m away. Plot a distance-time graph. What was the snail’s speed before lunch? What was the snail’s speed after lunch? Distance (m) Time (s) 0 4 8 12 16 800 160 240
  • 61.
    April 2, 2014 Distance- Time Graphs: ExamplesDistance - Time Graphs: Examples A snail slithers 8m in 80s then stops for lunch ( a lettuce leaf) for 40s. After lunch it continues the journey and it takes a further 120s to reach his final destination which is a further 8m away. Plot a distance-time graph. What was the snail’s speed before lunch? What was the snail’s speed after lunch? Distance (m) Time (s) 0 4 8 12 16 0 80 160 240
  • 62.
    April 2, 2014 Distance- Time Graphs: ExamplesDistance - Time Graphs: Examples A snail slithers 8m in 80s then stops for lunch ( a lettuce leaf) for 40s. After lunch it continues the journey and it takes a further 120s to reach his final destination which is a further 8m away. Plot a distance-time graph. What was the snail’s speed before lunch? What was the snail’s speed after lunch? Distance (m) Time (s) 0 0 4 8 12 16 80 160 240
  • 63.
    April 2, 2014 Distance- Time Graphs: ExamplesDistance - Time Graphs: Examples A snail slithers 8m in 80s then stops for lunch ( a lettuce leaf) for 40s. After lunch it continues the journey and it takes a further 120s to reach his final destination which is a further 8m away. Plot a distance-time graph. What was the snail’s speed before lunch? What was the snail’s speed after lunch? Distance (m) Time (s) 0 0 4 8 12 16 80 160 240
  • 64.
    April 2, 2014 Distance- Time Graphs: ExamplesDistance - Time Graphs: Examples A snail slithers 8m in 80s then stops for lunch ( a lettuce leaf) for 40s. After lunch it continues the journey and it takes a further 120s to reach his final destination which is a further 8m away. Plot a distance-time graph. What was the snail’s speed before lunch? What was the snail’s speed after lunch? Distance (m) Time (s) 0 0 (a) See graph (b) Speed before lunch = initial gradient = rise/run = 8/80 = 0.1m/s 4 8 12 16 80 160 240
  • 65.
    April 2, 2014 Distance- Time Graphs: ExamplesDistance - Time Graphs: Examples A snail slithers 8m in 80s then stops for lunch ( a lettuce leaf) for 40s. After lunch it continues the journey and it takes a further 120s to reach his final destination which is a further 8m away. Plot a distance-time graph. What was the snail’s speed before lunch? What was the snail’s speed after lunch? Distance (m) Time (s) 0 4 8 12 16 0 80 160 240
  • 66.
    April 2, 2014 Distance- Time Graphs: ExamplesDistance - Time Graphs: Examples A snail slithers 8m in 80s then stops for lunch ( a lettuce leaf) for 40s. After lunch it continues the journey and it takes a further 120s to reach his final destination which is a further 8m away. Plot a distance-time graph. What was the snail’s speed before lunch? What was the snail’s speed after lunch? Distance (m) Time (s) 0 0 4 8 12 16 80 160 240
  • 67.
    April 2, 2014 Distance- Time Graphs: ExamplesDistance - Time Graphs: Examples A snail slithers 8m in 80s then stops for lunch ( a lettuce leaf) for 40s. After lunch it continues the journey and it takes a further 120s to reach his final destination which is a further 8m away. Plot a distance-time graph. What was the snail’s speed before lunch? What was the snail’s speed after lunch? Distance (m) Time (s) 0 0 4 8 12 16 80 160 240
  • 68.
    April 2, 2014 Distance- Time Graphs: ExamplesDistance - Time Graphs: Examples A snail slithers 8m in 80s then stops for lunch ( a lettuce leaf) for 40s. After lunch it continues the journey and it takes a further 120s to reach his final destination which is a further 8m away. Plot a distance-time graph. What was the snail’s speed before lunch? What was the snail’s speed after lunch? Distance (m) Time (s) 0 0 (a) See graph (b) Speed before lunch = initial gradient = rise/run = 8/80 = 0.1m/s 4 8 12 16 80 160 240
  • 69.
    April 2, 2014 Distance- Time Graphs: ExamplesDistance - Time Graphs: Examples A snail slithers 8m in 80s then stops for lunch ( a lettuce leaf) for 40s. After lunch it continues the journey and it takes a further 120s to reach his final destination which is a further 8m away. Plot a distance-time graph. What was the snail’s speed before lunch? What was the snail’s speed after lunch? Distance (m) Time (s) 0 0 (a) See graph (b) Speed before lunch = initial gradient = rise/run = 8/80 = 0.1m/s (c) Speed after lunch = final gradient = rise/run = 8/120 = 0.067 m/s4 8 12 16 80 160 240
  • 70.
    April 2, 2014 Distance- Time Graphs: ExamplesDistance - Time Graphs: Examples Consider a car starting from rest and its speed is increasing continuously. Distance (m) Time (s) 0 200 400 600 800 200 40 60
  • 71.
    April 2, 2014 Distance- Time Graphs: ExamplesDistance - Time Graphs: Examples Consider a car starting from rest and its speed is increasing continuously. Find the speed of the car at 40 seconds after the start of the journey. Distance (m) Time (s) 0 200 400 600 800 200 40 60
  • 72.
    April 2, 2014 Accelerationis defined as the change in velocity in unit time and has the units m/s/s or m/s2 or ms-2 Acceleration is a vector quantity and so has size and direction. Velocity - Time GraphsVelocity - Time Graphs
  • 73.
    To calculate accelerationwe use the equation: Average acceleration = change in velocity/time taken = (final velocity – initial velocity)/time taken = (v – u)/t Velocity is measured in metres per second (m/s) and time is measured in seconds (s). The greater the change in velocity in a given time then the greater is the acceleration.
  • 74.
    Acceleration April 2, 2014 V-U TA Acceleration= change in velocity (in m/s) (in m/s2 ) time taken (in s) 1) A cyclist accelerates from 0 to 10m/s in 5 seconds. What is her acceleration? 2) A ball is dropped and accelerates downwards at a rate of 10m/s2 for 12 seconds. How much will the ball’s velocity increase by? 3) A car accelerates from 10 to 20m/s with an acceleration of 2m/s2 . How long did this take? 4) A rocket accelerates from 1,000m/s to 5,000m/s in 2 seconds. What is its acceleration?
  • 75.
    April 2, 2014 Auseful way to illustrate how the velocity throughout a journey varies with time is to plot a VELOCITY AGAINST TIME graph. This gives us a visual representation of how the journey progressed and allows us to see quickly how long each stage of the journey took compared with the other stages. . Velocity - Time GraphsVelocity - Time Graphs
  • 76.
    The steepness (gradient)will also give us the ACCELERATION. The area under a velocity-time graph gives us the distance travelled. The following graphs show how the shape of velocity- time graphs may vary and how to interpret them
  • 77.
    April 2, 2014 Velocity Time0 0 A BC AB- constant acceleration BC - constant velocity Gradient = rise/run = acceleration (m/s2 ) Rise Run Velocity - Time GraphsVelocity - Time Graphs
  • 78.
    April 2, 2014 Velocity Time0 0 A B C DE Constant Acceleration Constant Velocity At B,C & D there is instantaneous change in acceleration Area Under Graph = Total Distance Travelled Velocity - Time GraphsVelocity - Time Graphs
  • 79.
    April 2, 2014 Velocity- Time Graphs: ExamplesVelocity - Time Graphs: Examples (a) Constant Velocity Velocity (ms-1 ) Time (s) 10 8 6 4 2 0 0 2 4 6 8 10
  • 80.
    April 2, 2014 Velocity- Time Graphs: ExamplesVelocity - Time Graphs: Examples (a) Constant Velocity Velocity (ms-1 ) Time (s) 10 8 6 4 2 0 0 2 4 6 8 10 Distance travelled = area under graph = area of rectangle = length x breadth = 8 x 8 = 64m
  • 81.
    April 2, 2014 Velocity- Time Graphs: ExamplesVelocity - Time Graphs: Examples (b) Uniform Acceleration Velocity (ms-1 ) Time (s) 10 8 6 4 2 0 0 2 4 6 8 10
  • 82.
    April 2, 2014 Velocity- Time Graphs: ExamplesVelocity - Time Graphs: Examples (b) Uniform Acceleration Velocity (ms-1 ) Time (s) 10 8 6 4 2 0 0 2 4 6 8 10
  • 83.
    April 2, 2014 Velocity- Time Graphs: ExamplesVelocity - Time Graphs: Examples (b) Uniform Acceleration Velocity (ms-1 ) Time (s) 10 8 6 4 2 0 0 2 4 6 8 10 Distance travelled = area under graph = area of triangle = ½ base x height = ½ 8 x 8 = 32 m
  • 84.
    April 2, 2014 Velocity- Time Graphs: ExamplesVelocity - Time Graphs: Examples (b) Uniform Acceleration Velocity (ms-1 ) Time (s) 10 8 6 4 2 0 0 2 4 6 8 10 Distance travelled= area under graph = area of triangle = ½ base x height = ½ 8 x 8 = 32 m Acceleration = gradient = rise/run = 8/8 = 1 ms-2
  • 85.
    April 2, 2014 Velocity- Time Graphs: ExamplesVelocity - Time Graphs: Examples (c) Uniform Deceleration Velocity (ms-1 ) Time (s) 10 8 6 4 2 0 0 2 4 6 8 10
  • 86.
    April 2, 2014 Velocity- Time Graphs: ExamplesVelocity - Time Graphs: Examples (c) Uniform Deceleration Velocity (ms-1 ) Time (s) 10 8 6 4 2 0 0 2 4 6 8 10 Distance travelled= area under graph = ½ base x height = ½ 10 x 10 = 50m
  • 87.
    April 2, 2014 Velocity- Time Graphs: ExamplesVelocity - Time Graphs: Examples (c) Uniform Deceleration Velocity (ms-1 ) Time (s) 10 8 6 4 2 0 0 2 4 6 8 10 Distance travelled= area under graph = ½ base x height = ½ 10 x 10 = 50m Acceleration = gradient = rise/run = -10/10 = -1 ms-2 (Deceleration = +1 ms-2
  • 88.
    April 2, 2014 Acar starts from rest and accelerates uniformly to 20m/s in 10 seconds. It travels at this velocity for a further 30 seconds before decelerating uniformly to rest in 5 seconds. (a) draw a velocity - time graph of the car’s journey (b) calculate the car’s initial acceleration (c) calculate the car’s final deceleration (d) calculate the total distance travelled by the car (e) calculate the distance travelled by the car in the final 25 seconds Velocity - Time Graphs: ExampleVelocity - Time Graphs: Example
  • 89.
    April 2, 2014 Velocity Time0 0 20 (m/s) (s) 1040 45 Initial acceleration = initial gradient = rise/run = 20/10 = 2m/s2 Velocity - Time GraphsVelocity - Time Graphs
  • 90.
    April 2, 2014 Velocity Time0 0 20 (m/s) (s) 1040 45 final acceleration = final gradient = rise/run = -20/5 = -4m/s2 Velocity - Time GraphsVelocity - Time Graphs
  • 91.
    April 2, 2014 Velocity Time0 0 20 (m/s) (s) 1040 45 A B C Total distance travelled = total area under graph = area A + B + C = ½ x 10 x 20 + 30 x 20 + ½ x 5 x 20 = 100 + 600 + 50 = 750m Velocity - Time GraphsVelocity - Time Graphs
  • 92.
    April 2, 2014 Velocity Time0 0 20 (m/s) (s) 1040 45 C Distance travelled in final 25s = part area under graph = area D + C = 20 x 20 + ½ x 5 x 20 = 400 + 50 = 450m D 20 Velocity - Time GraphsVelocity - Time Graphs
  • 93.
    April 2, 2014 Velocity- Time Graphs: ExamplesVelocity - Time Graphs: Examples (b) Uniform Acceleration Velocity (ms-1 ) Time (s) 10 8 6 4 2 0 0 2 4 6 8 10 Distance travelled= area under graph = area of triangle = ½ base x height = ½ 8 x 8 = 32 m Acceleration = gradient = rise/run = 8/8 = 1 ms-2
  • 94.
    Velocity-time graphs April 2,2014 80 60 40 20 0 10 20 30 40 50 Velocity m/s T/s 1) Upwards line = 2) Horizontal line = 3) Steeper line = 4) Downward line =
  • 95.
    April 2, 2014 80 60 40 20 0 1)How fast was the object going after 10 seconds? 2) What is the acceleration from 20 to 30 seconds? 3) What was the deceleration from 30 to 50s? 4) How far did the object travel altogether? 10 20 30 40 50 Velocity m/s T/s
  • 96.
  • 97.
    Questions:  Do heavierobjects fall faster than lighter ones when starting from the same position?  Does air resistance matter?  If the free fall motion has a constant acceleration, what is this acceleration and how was it found?  How do we solve problems involving free fall?
  • 98.
    Galileo (1564 – 1642)and the leaning tower of Pisa.
  • 99.
    Air Resistance  Theforce of friction or drag acting on an object in a direction opposing its motion as it moves through air.
  • 100.
    Hammer & Featherin the presence of air
  • 101.
    Hammer & Featherin the absence of air
  • 102.
     If thefree fall motion has a constant acceleration, what is this acceleration and how was it found?
  • 103.
    If there wereno air resistance both objects would fall with the same downward acceleration ;9.8 m/s2.this is called the acceleration of free fall
  • 104.
     The accelerationof free fall if represented by the symbol ‘g’.  Its value varies from one place on earth to another  Moving away from the earth and out into space ,g decreases  The value of g near the earth surafce is close to 10 m/s
  • 105.