1. The document provides an introduction to physics concepts including understanding physics, base and derived quantities, scalar and vector quantities, and measurements.
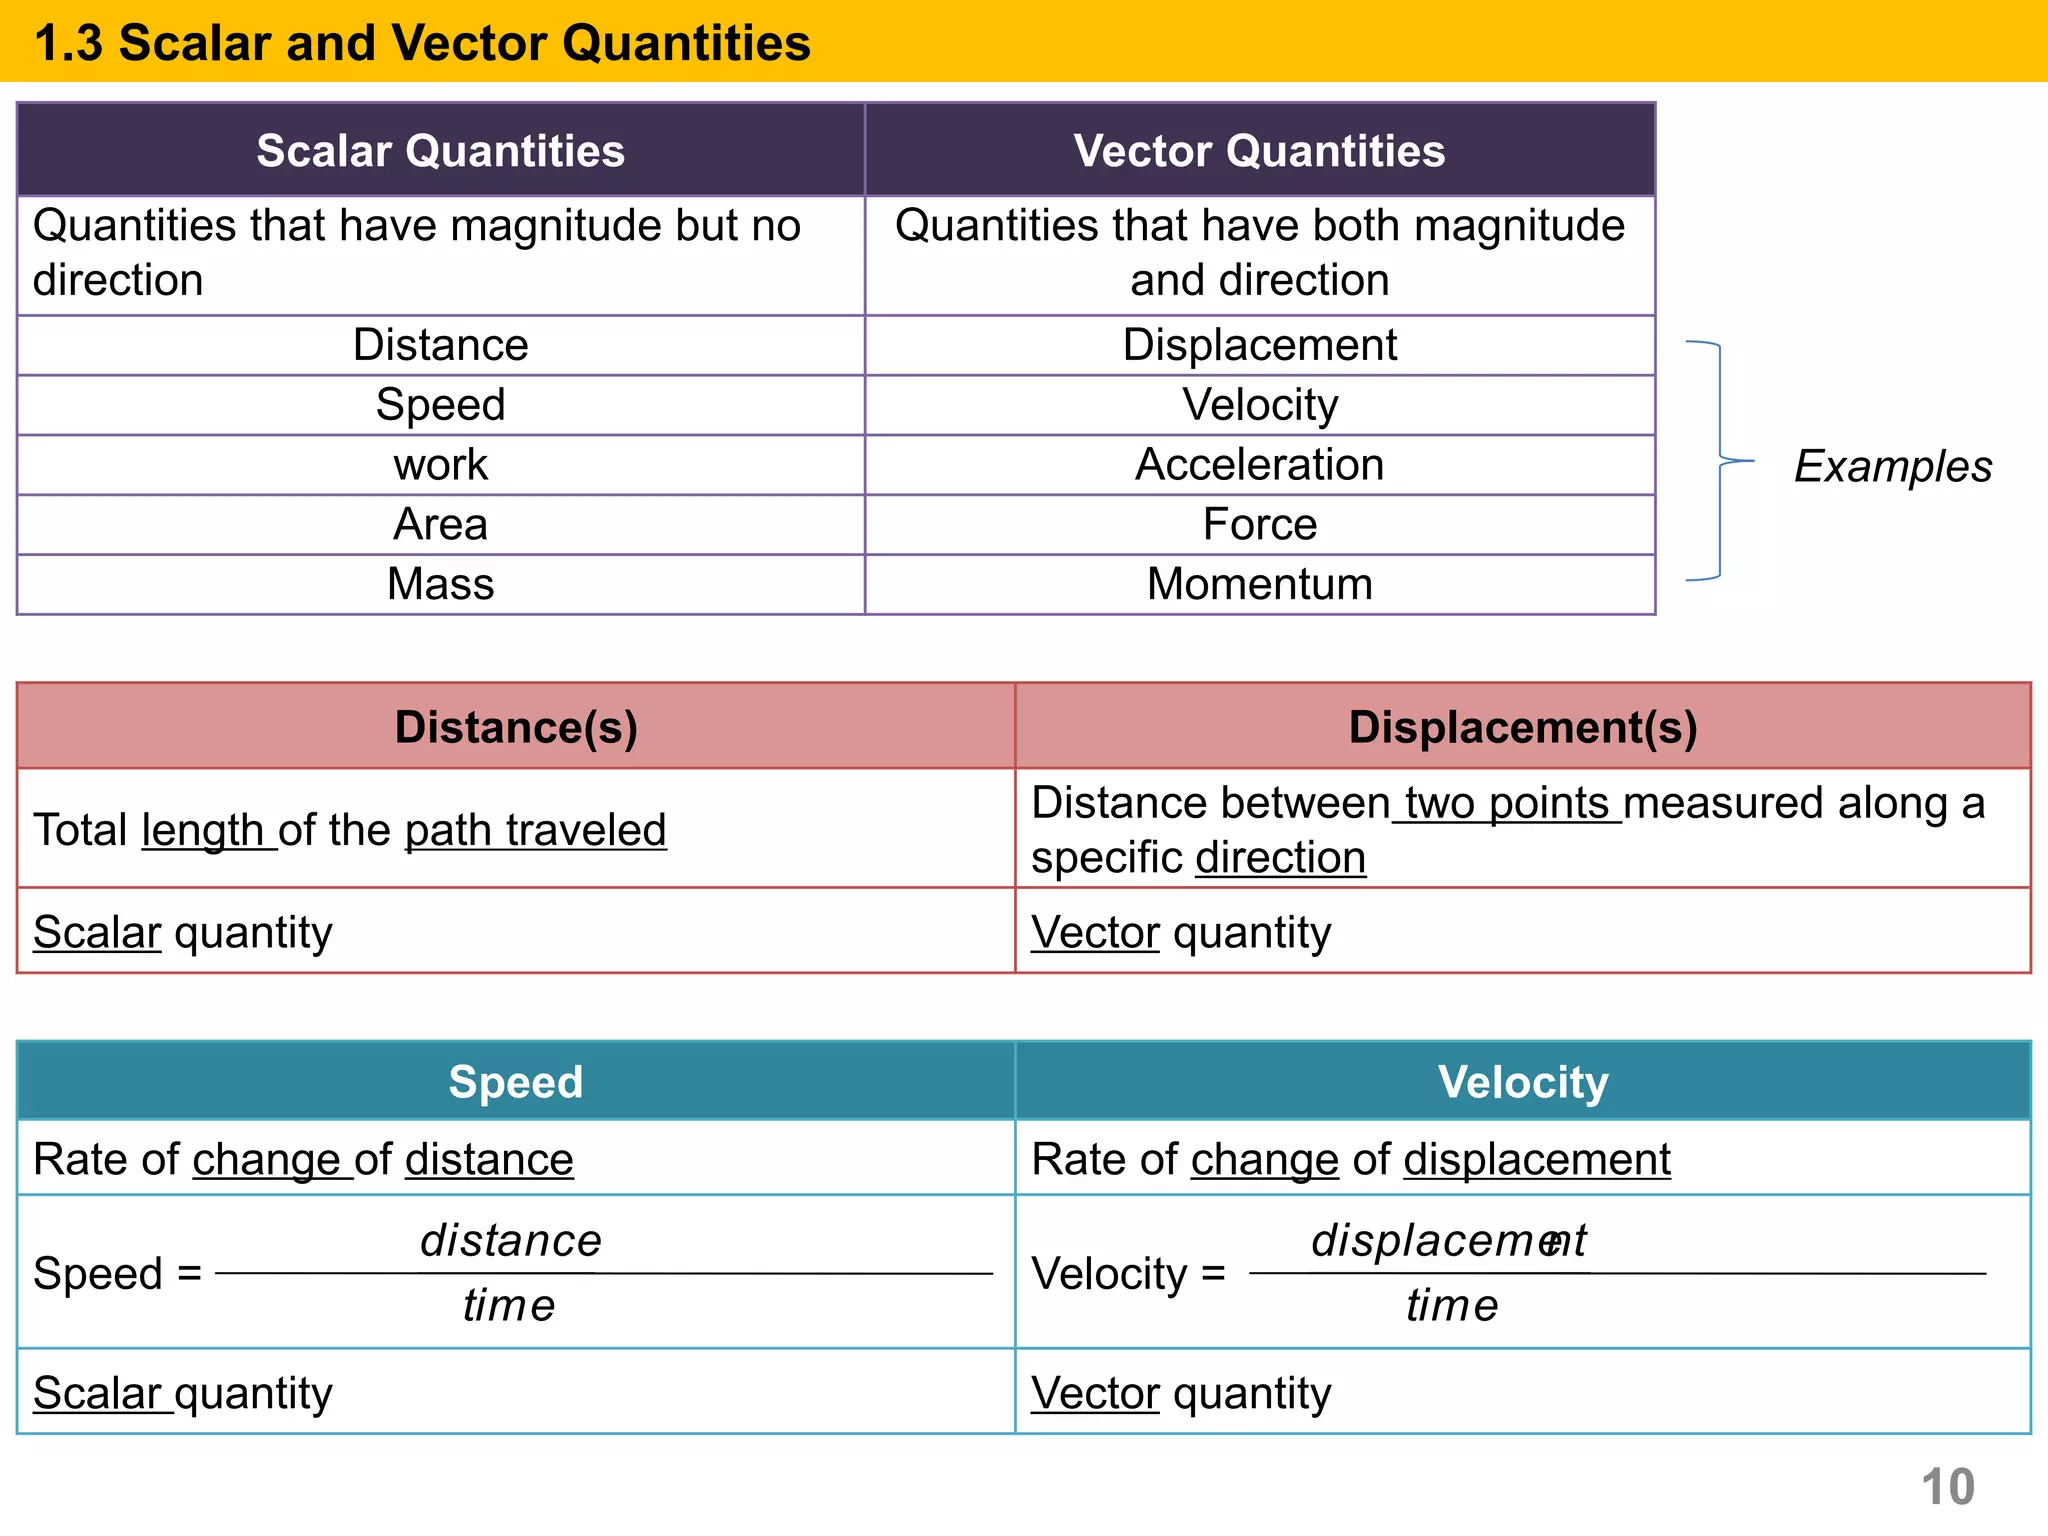
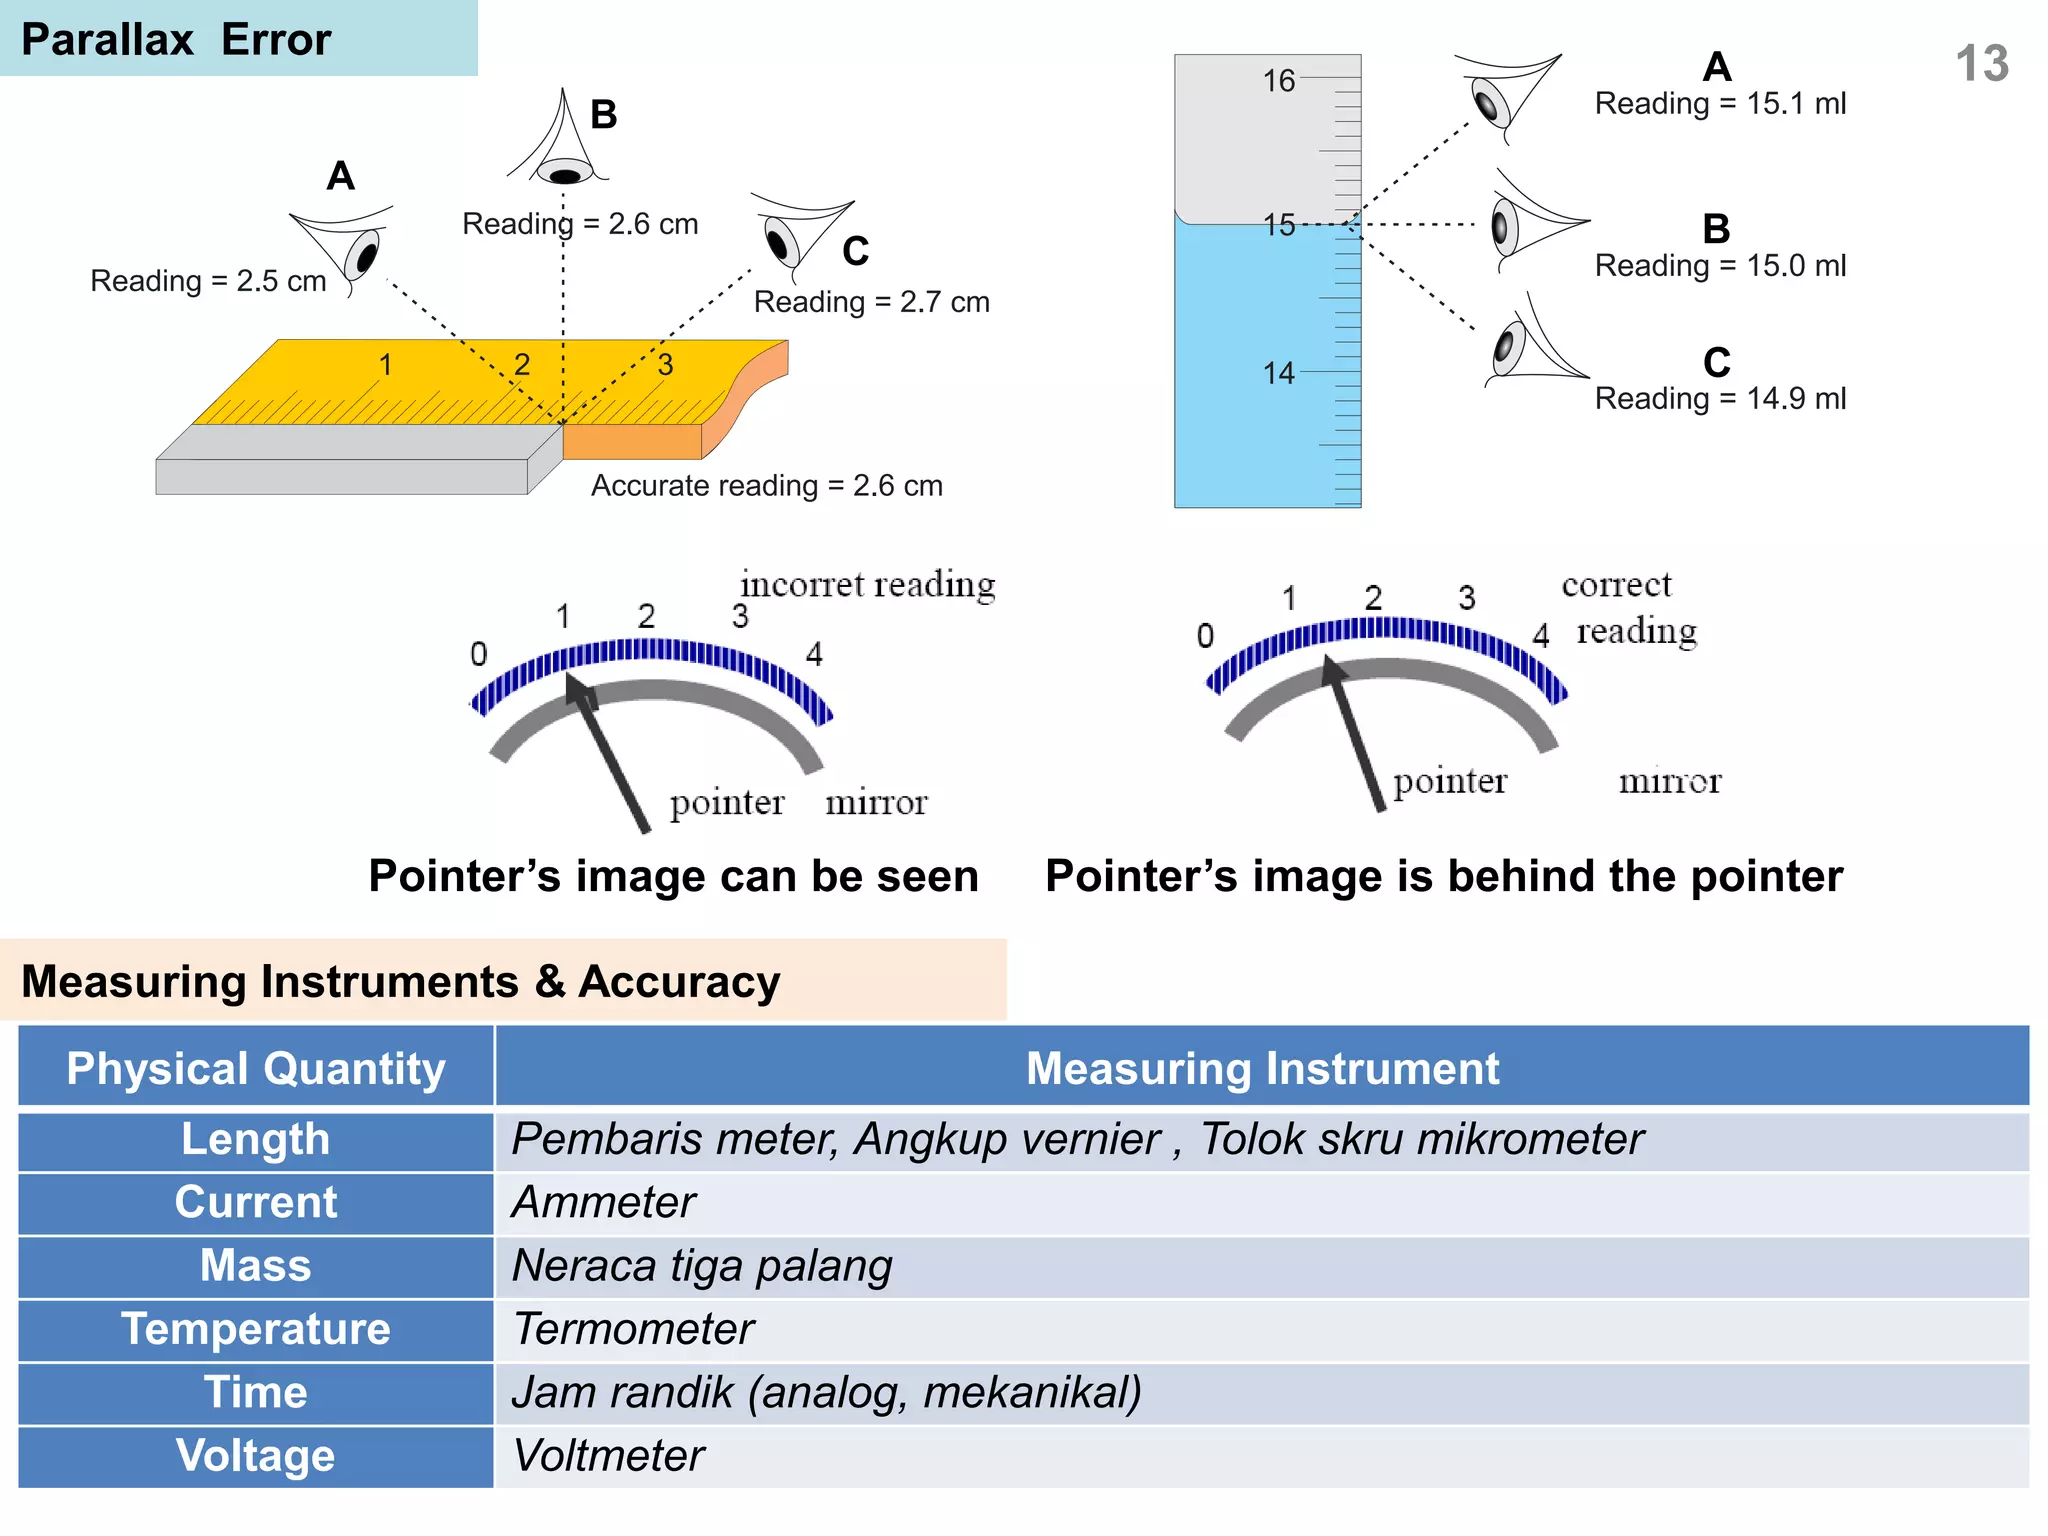
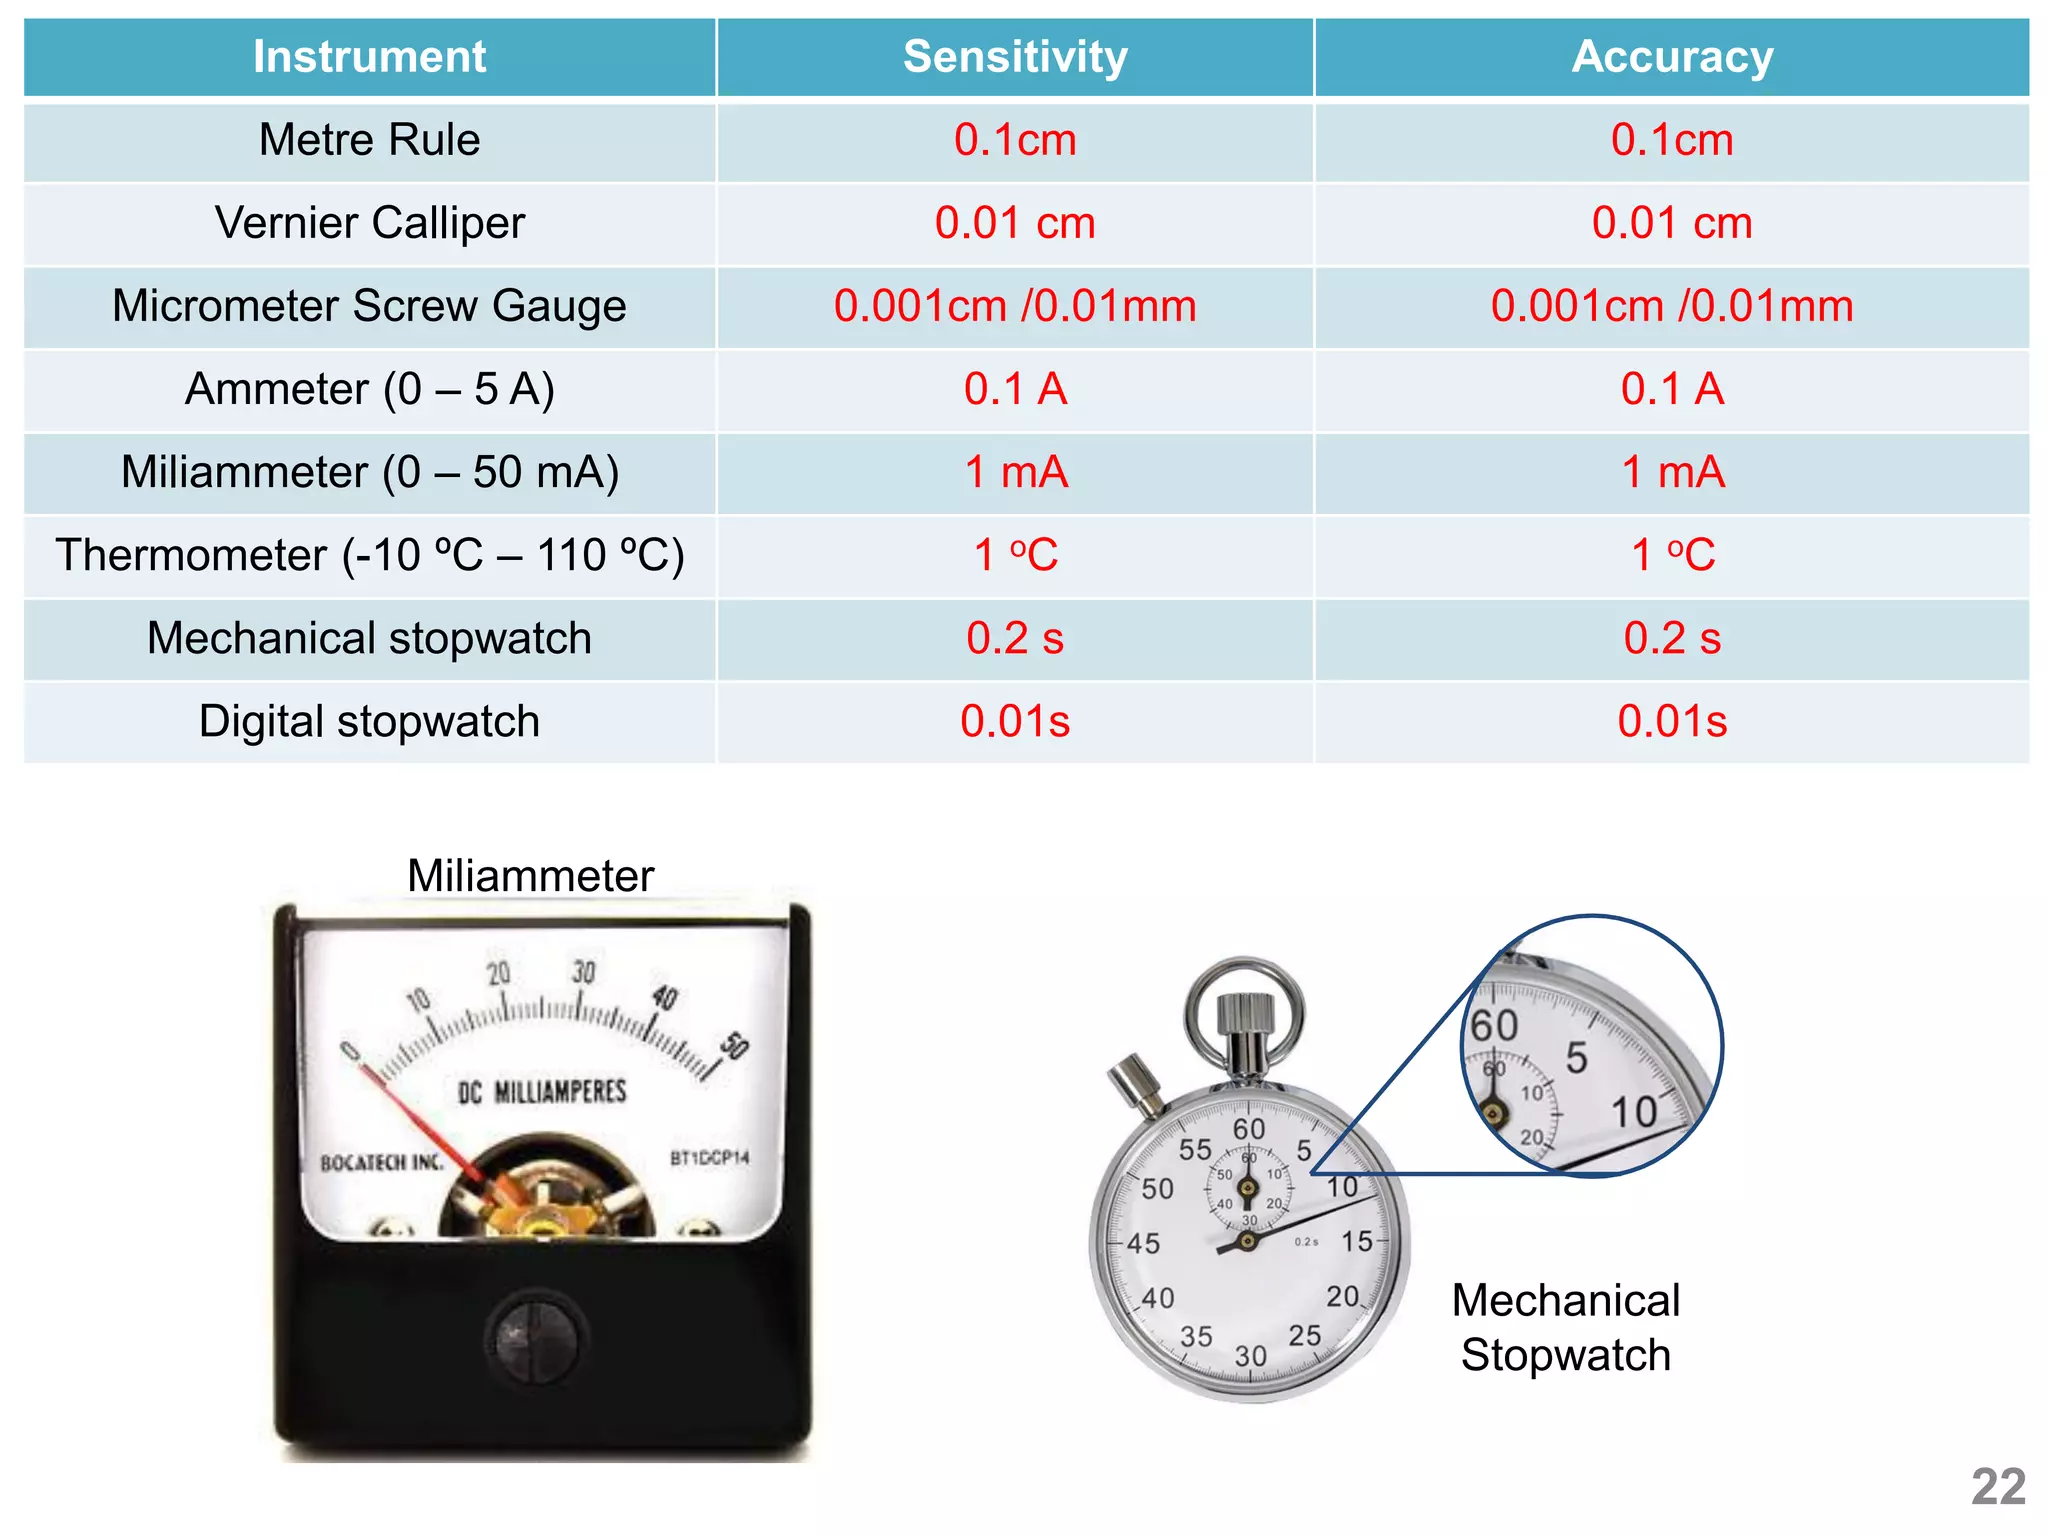
2. Key concepts discussed include the definition of physics, base units, derived units, scalar and vector quantities, and factors that affect the accuracy and sensitivity of measuring instruments.
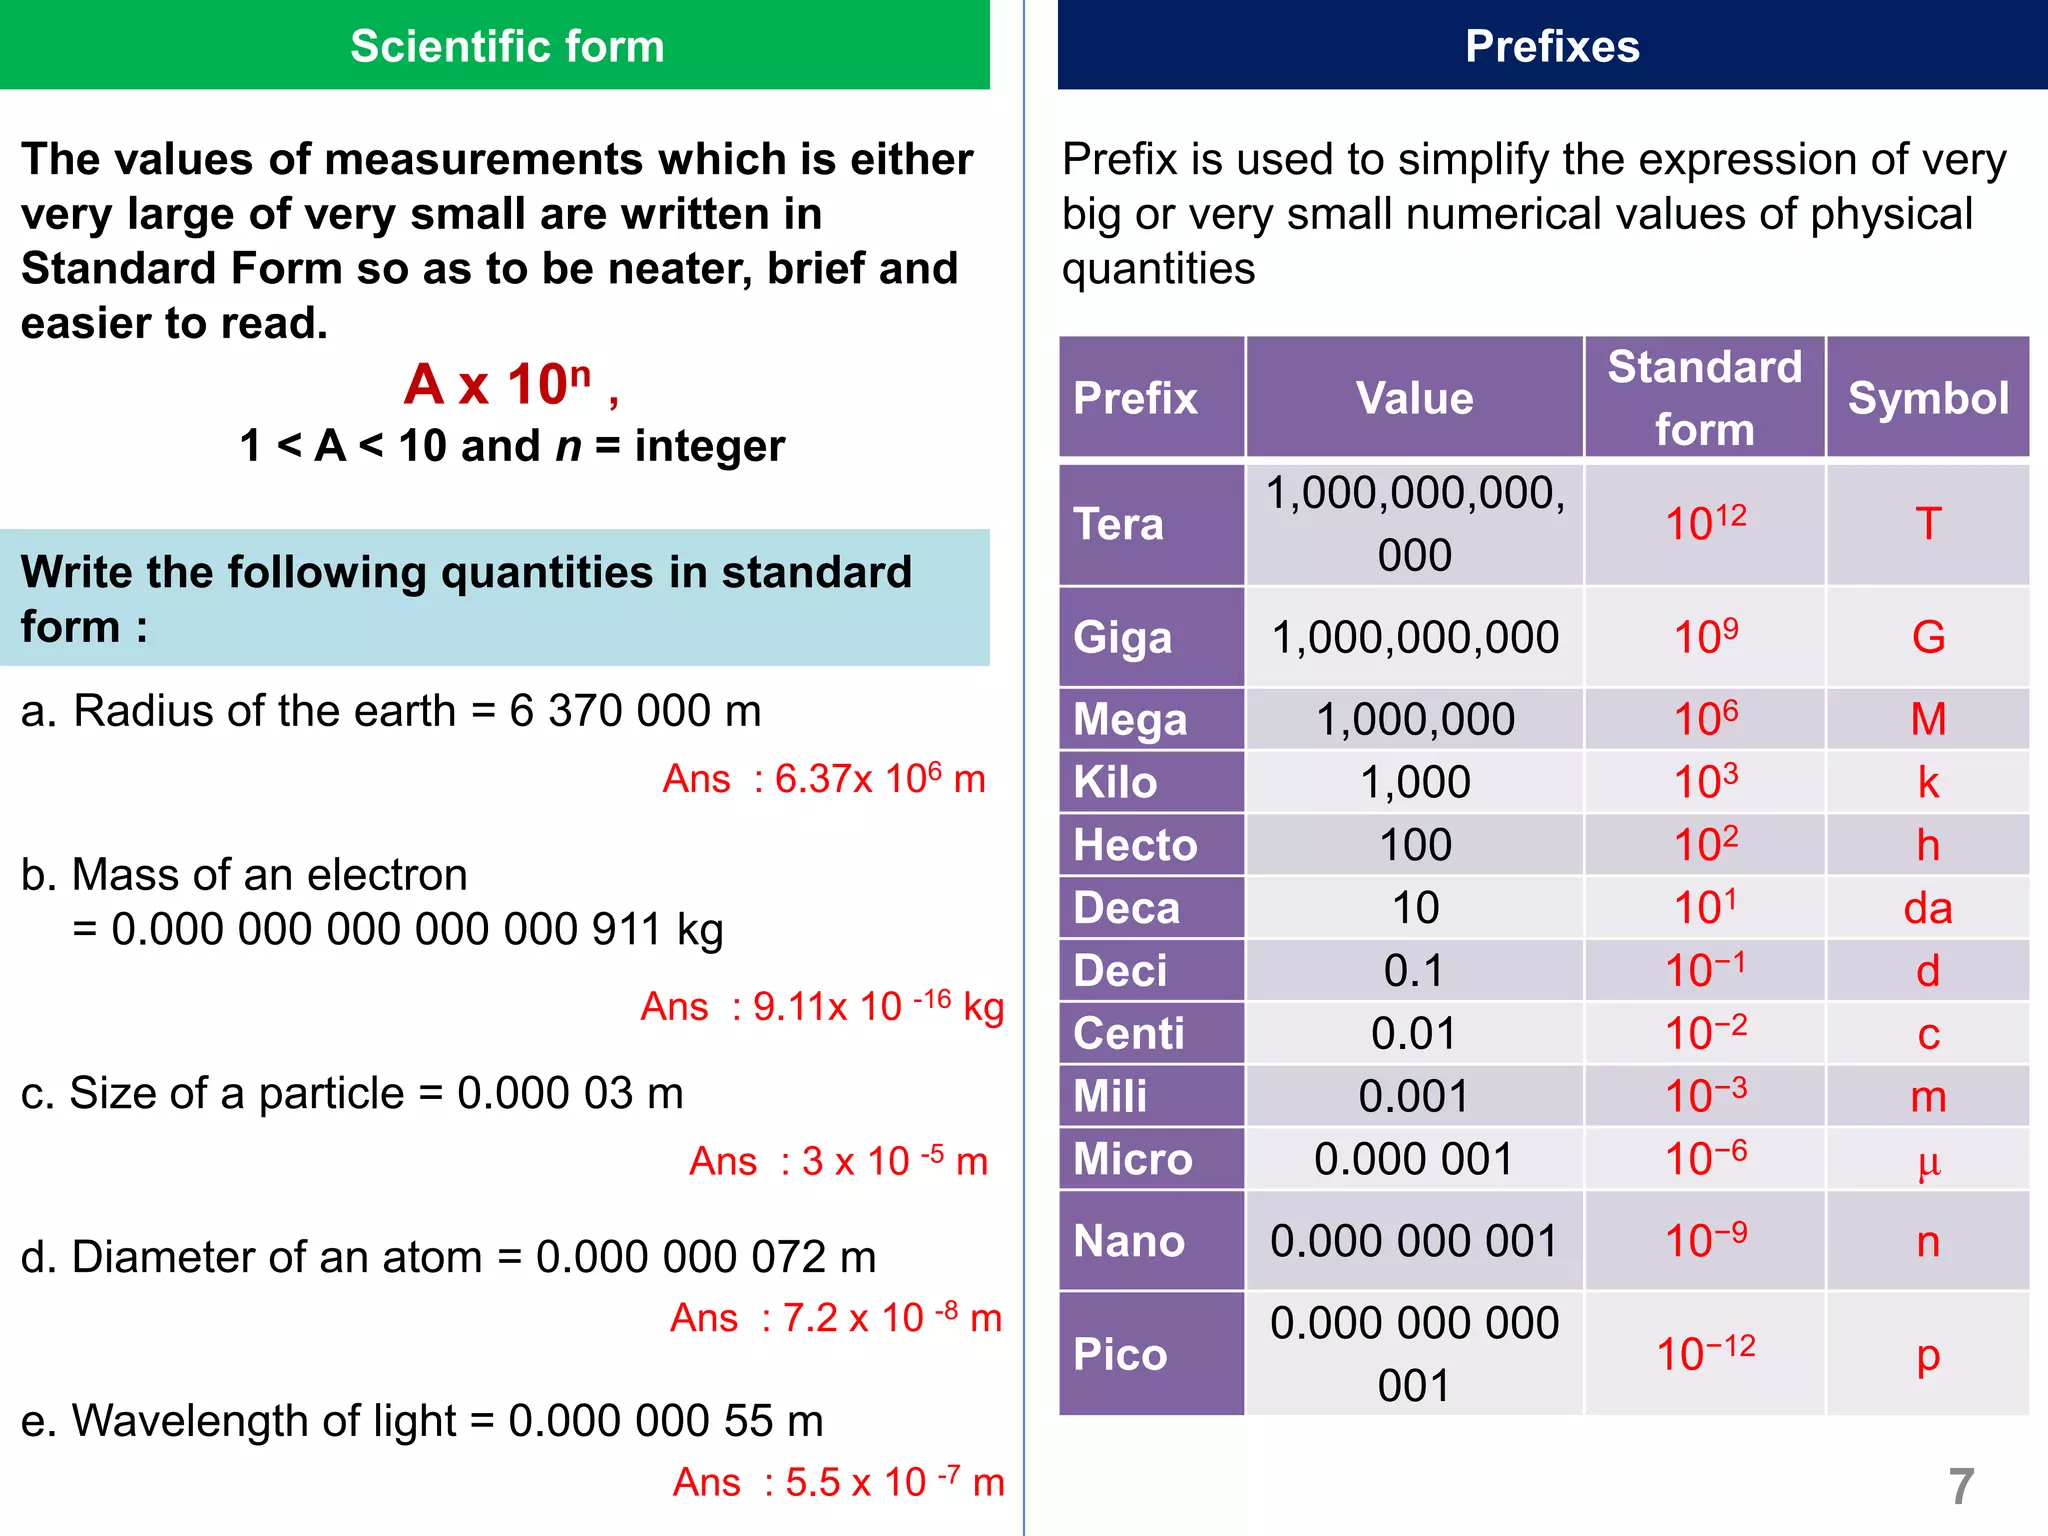
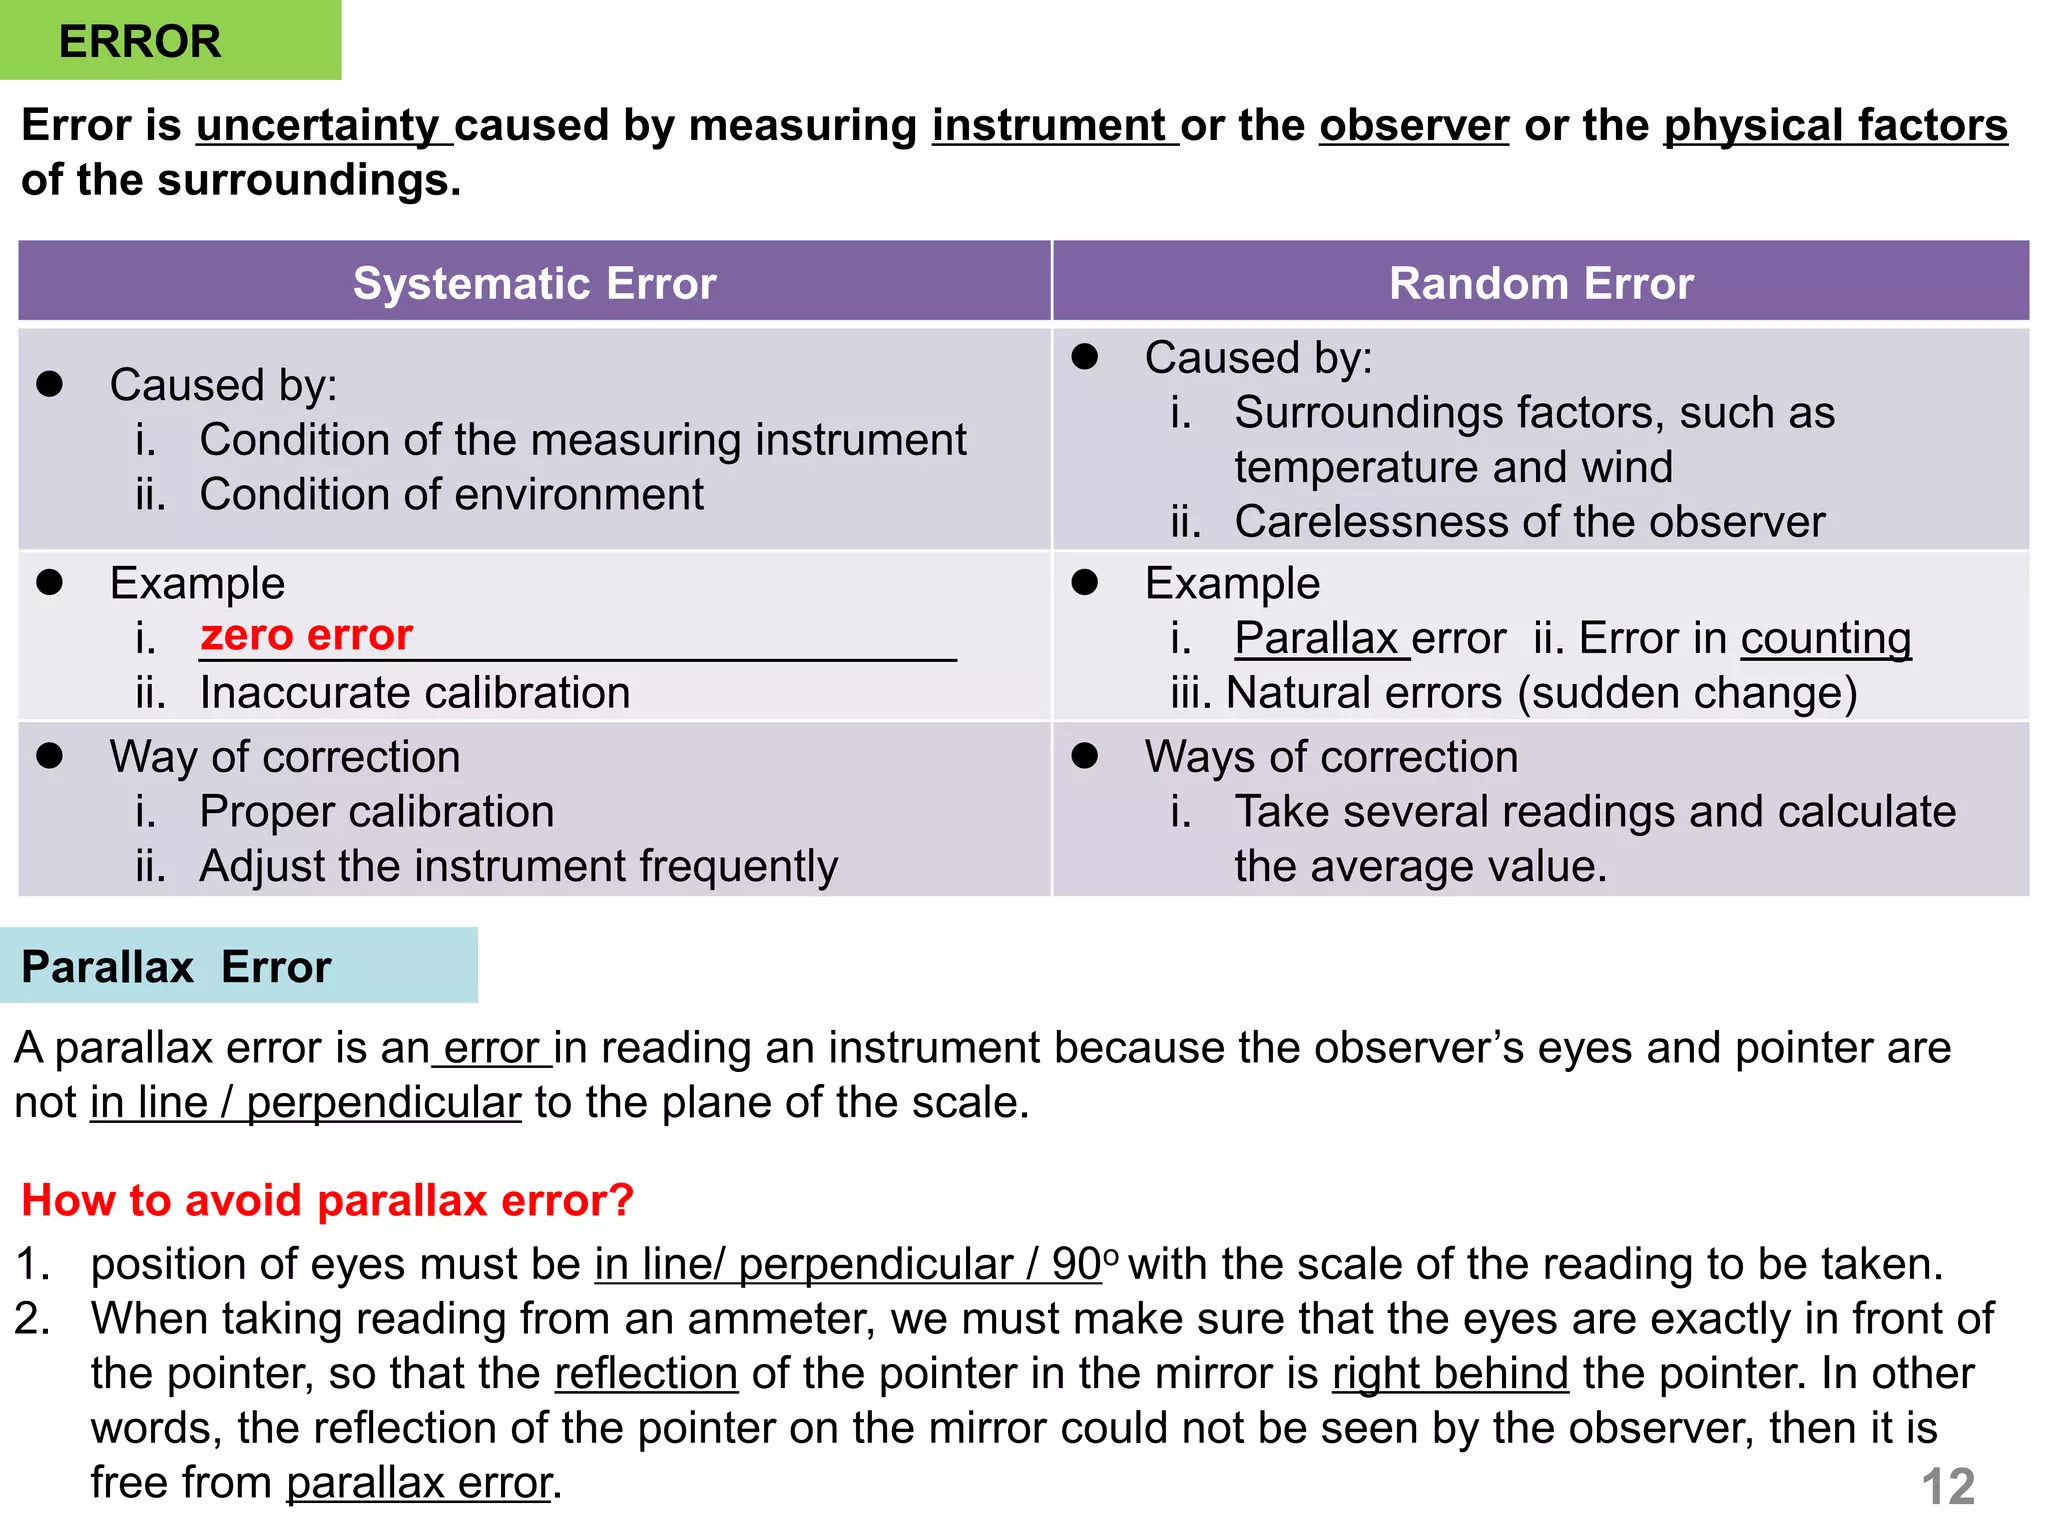
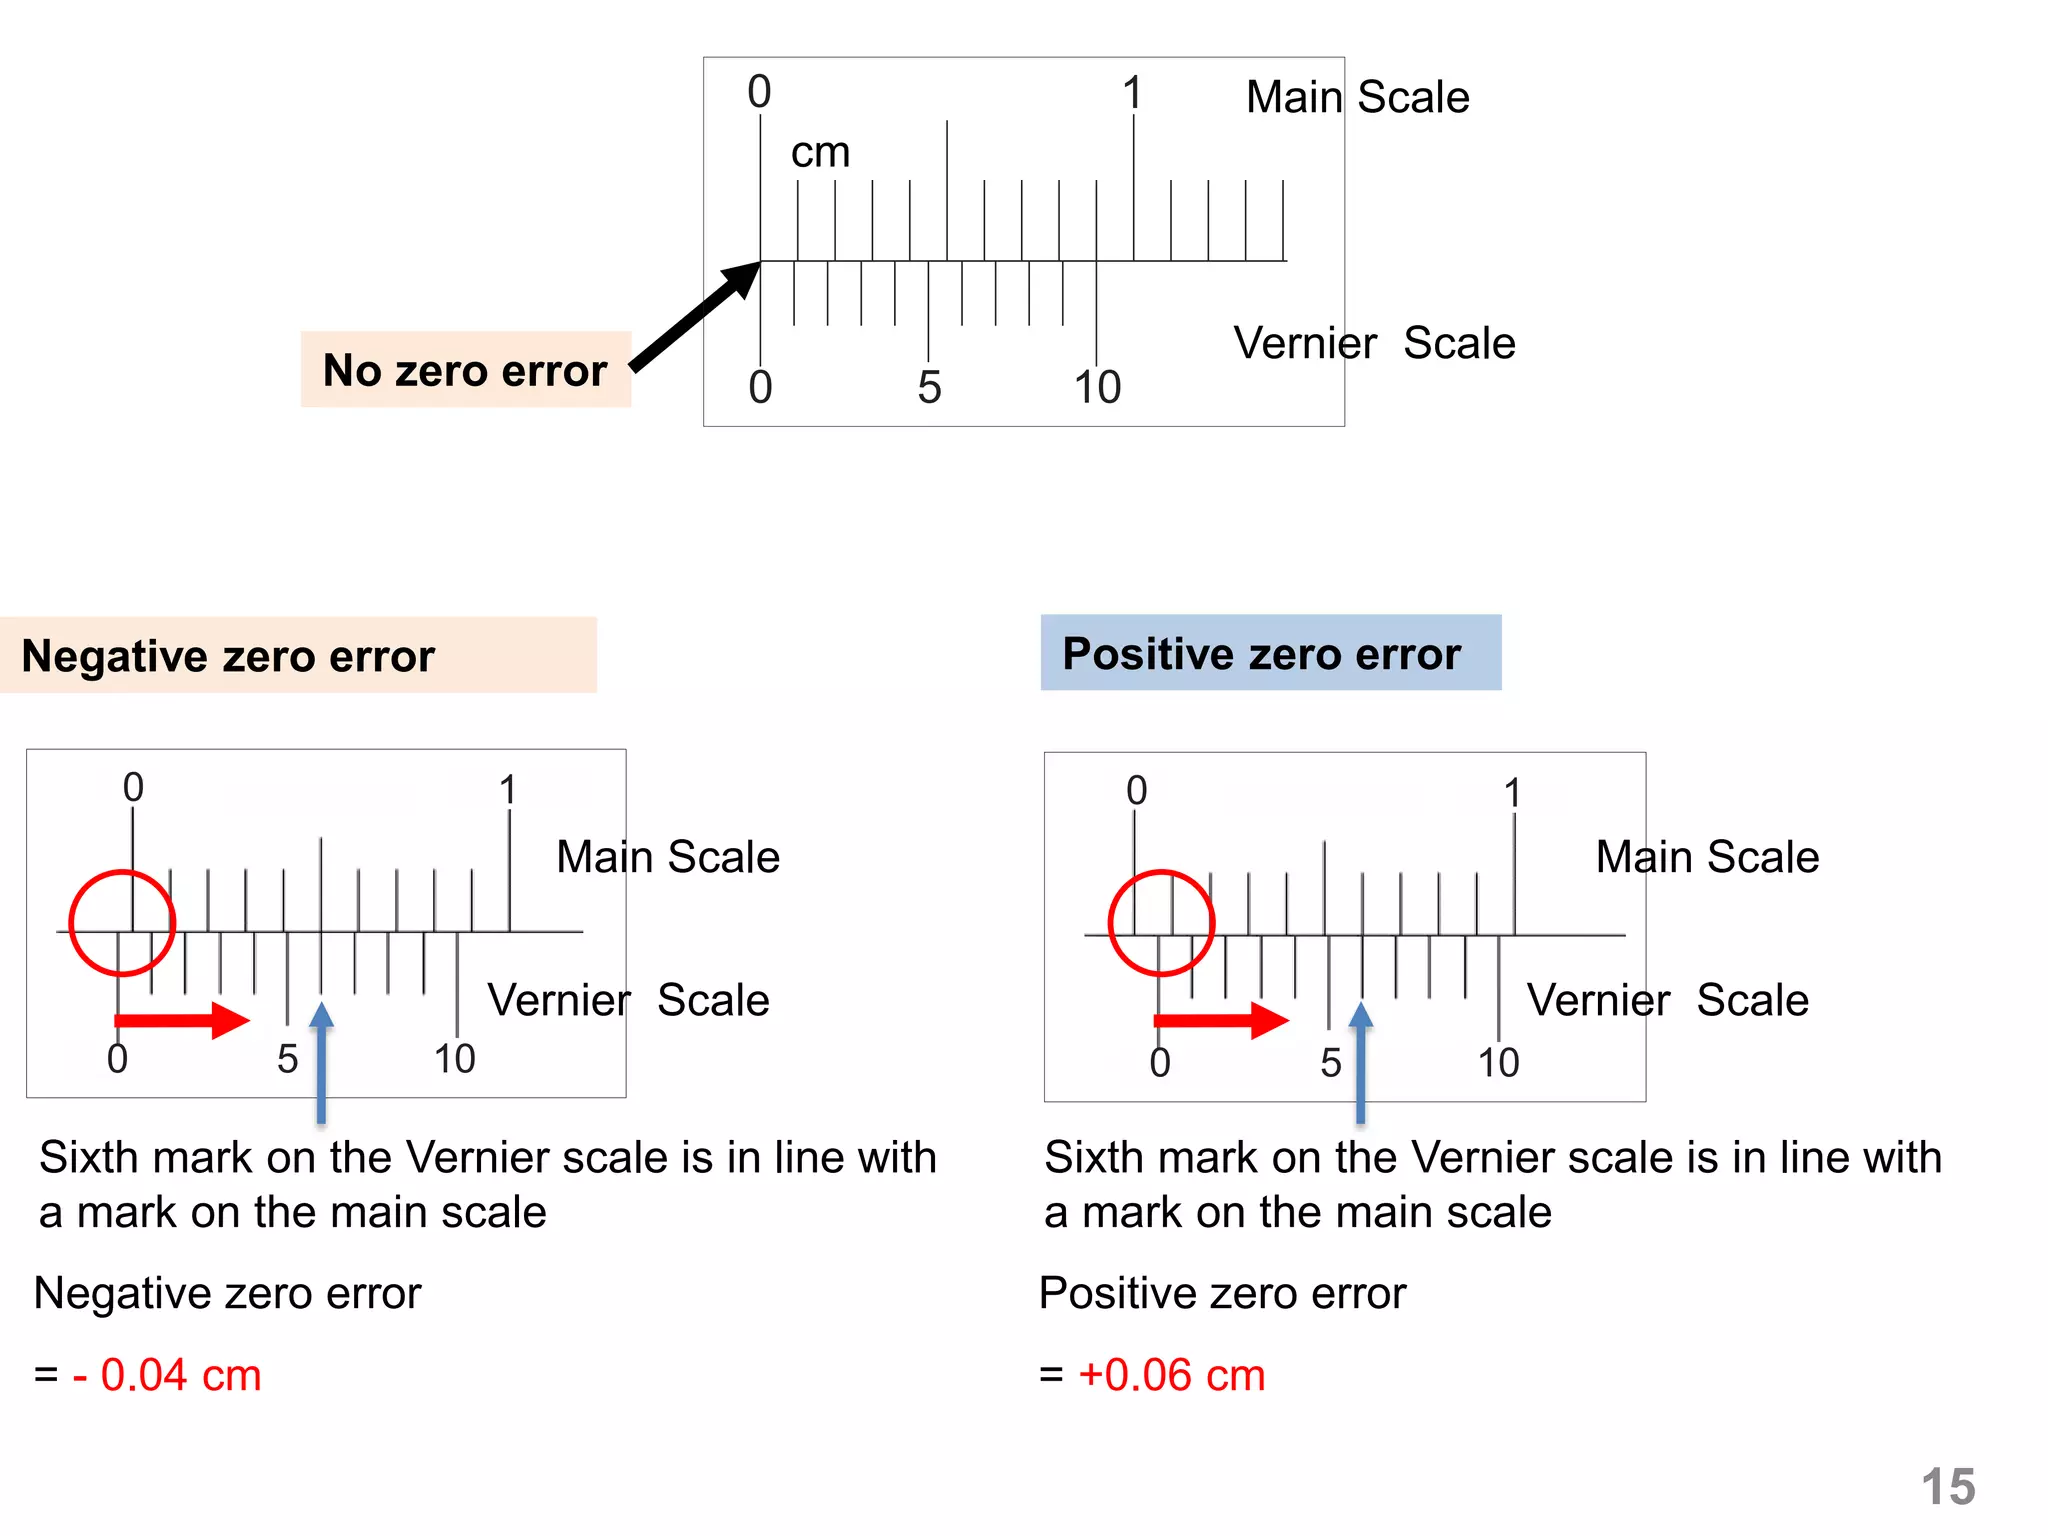
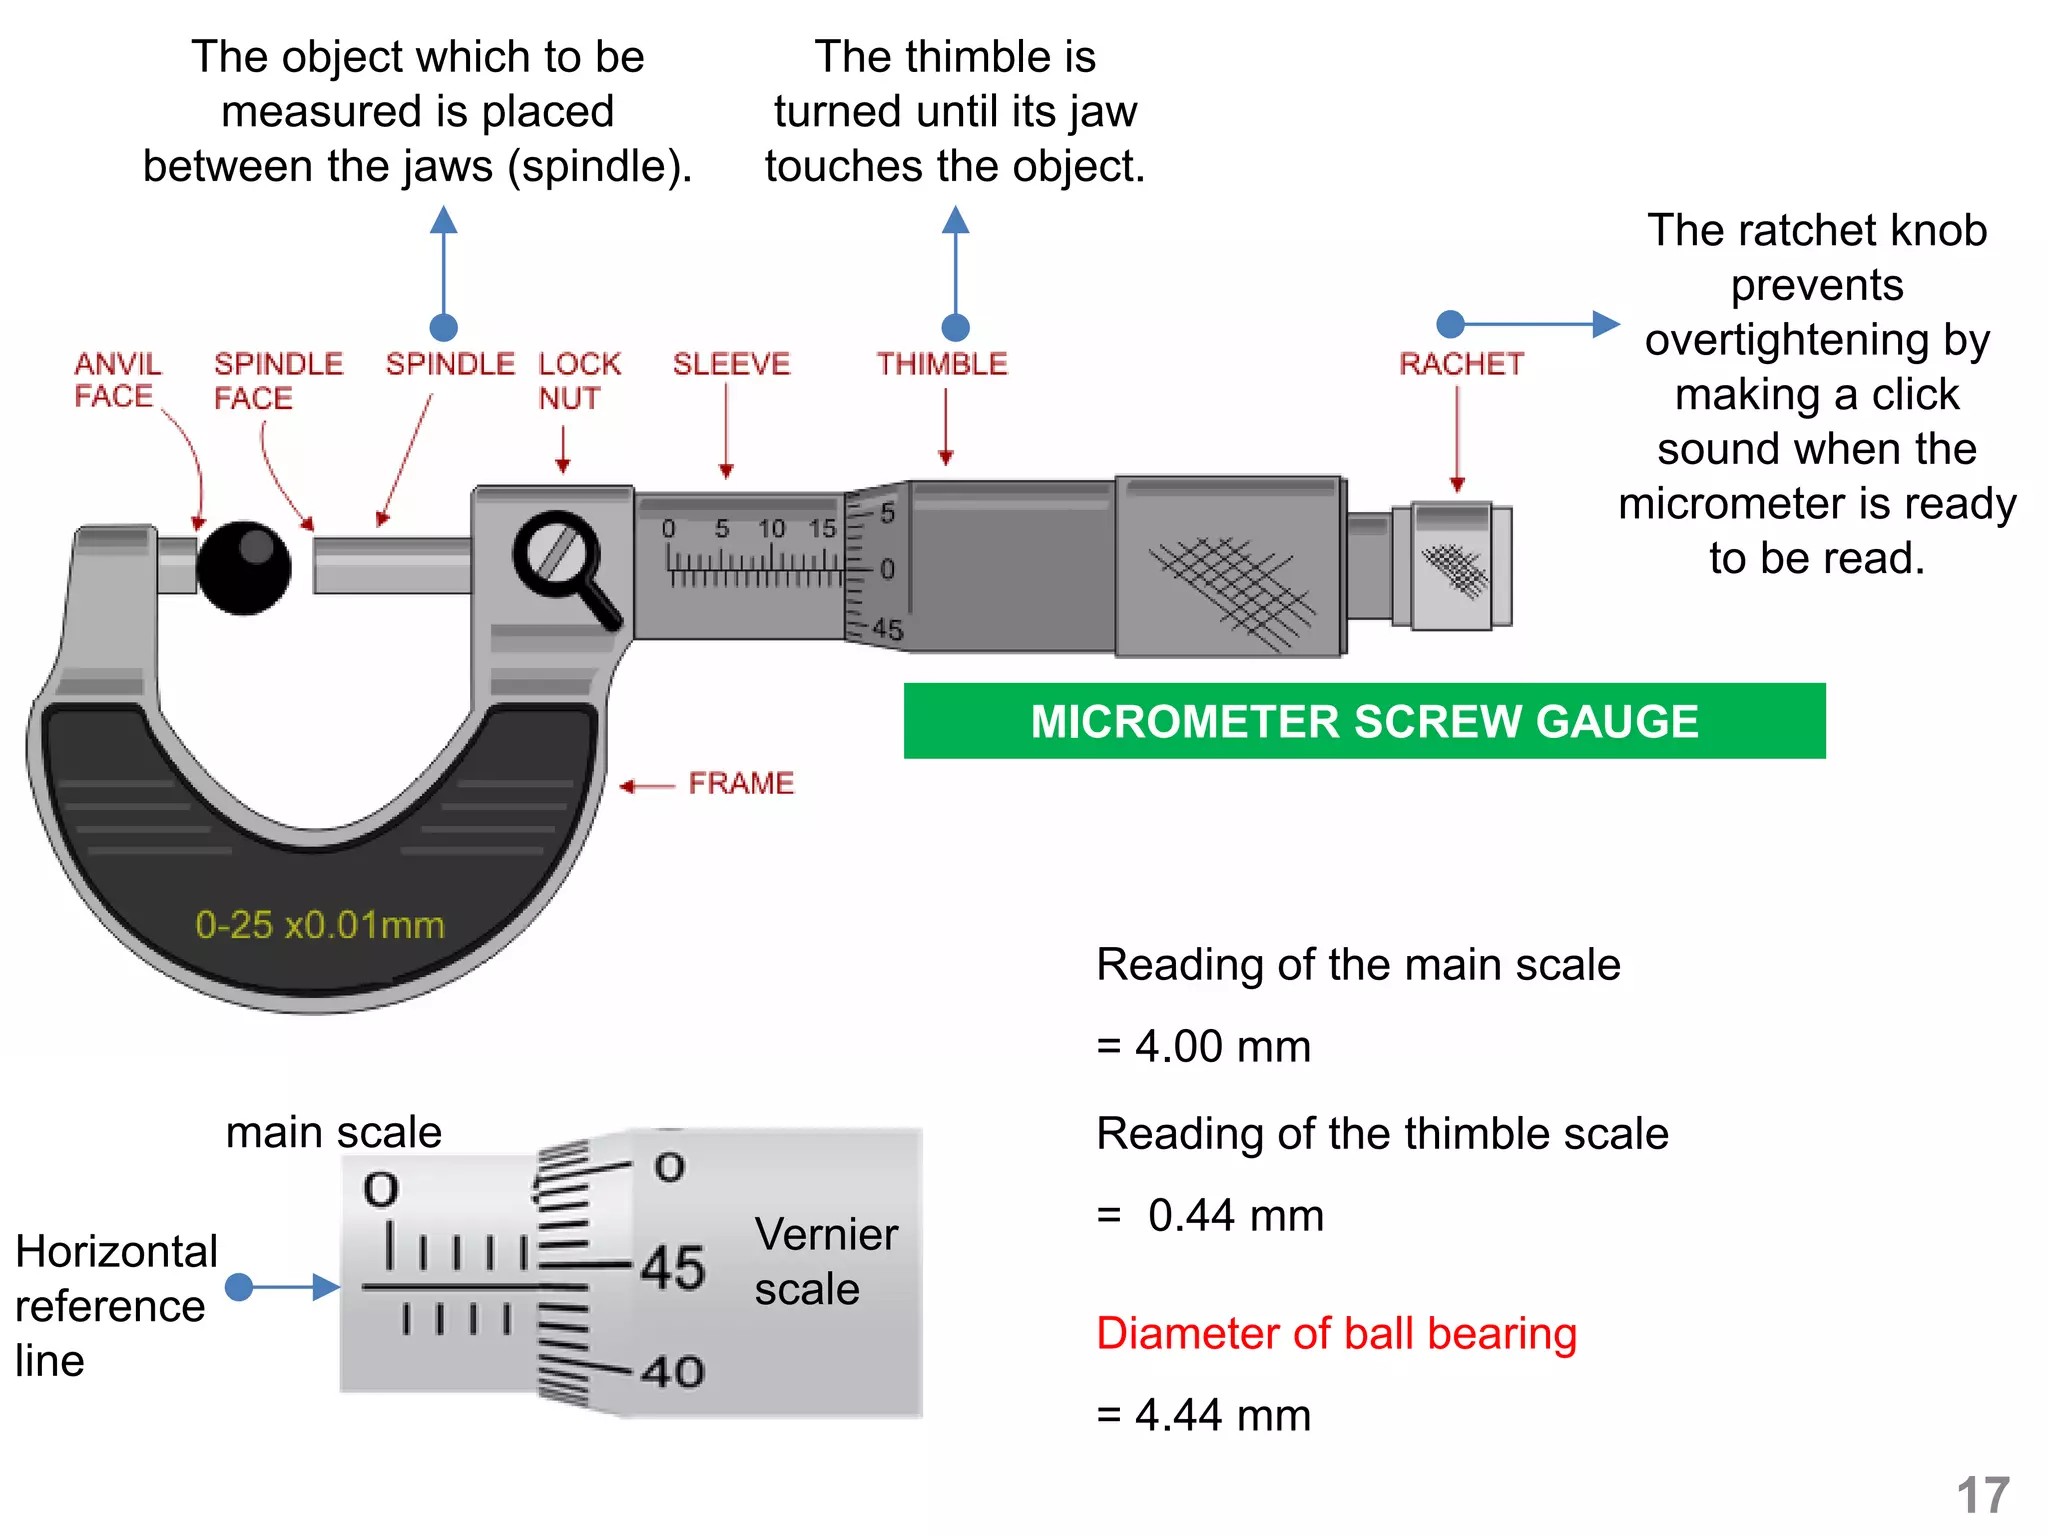
3. Examples are provided to illustrate scientific notation, unit conversion, identifying systematic and random errors, and the proper use of instruments like the vernier caliper and micrometer screw gauge.