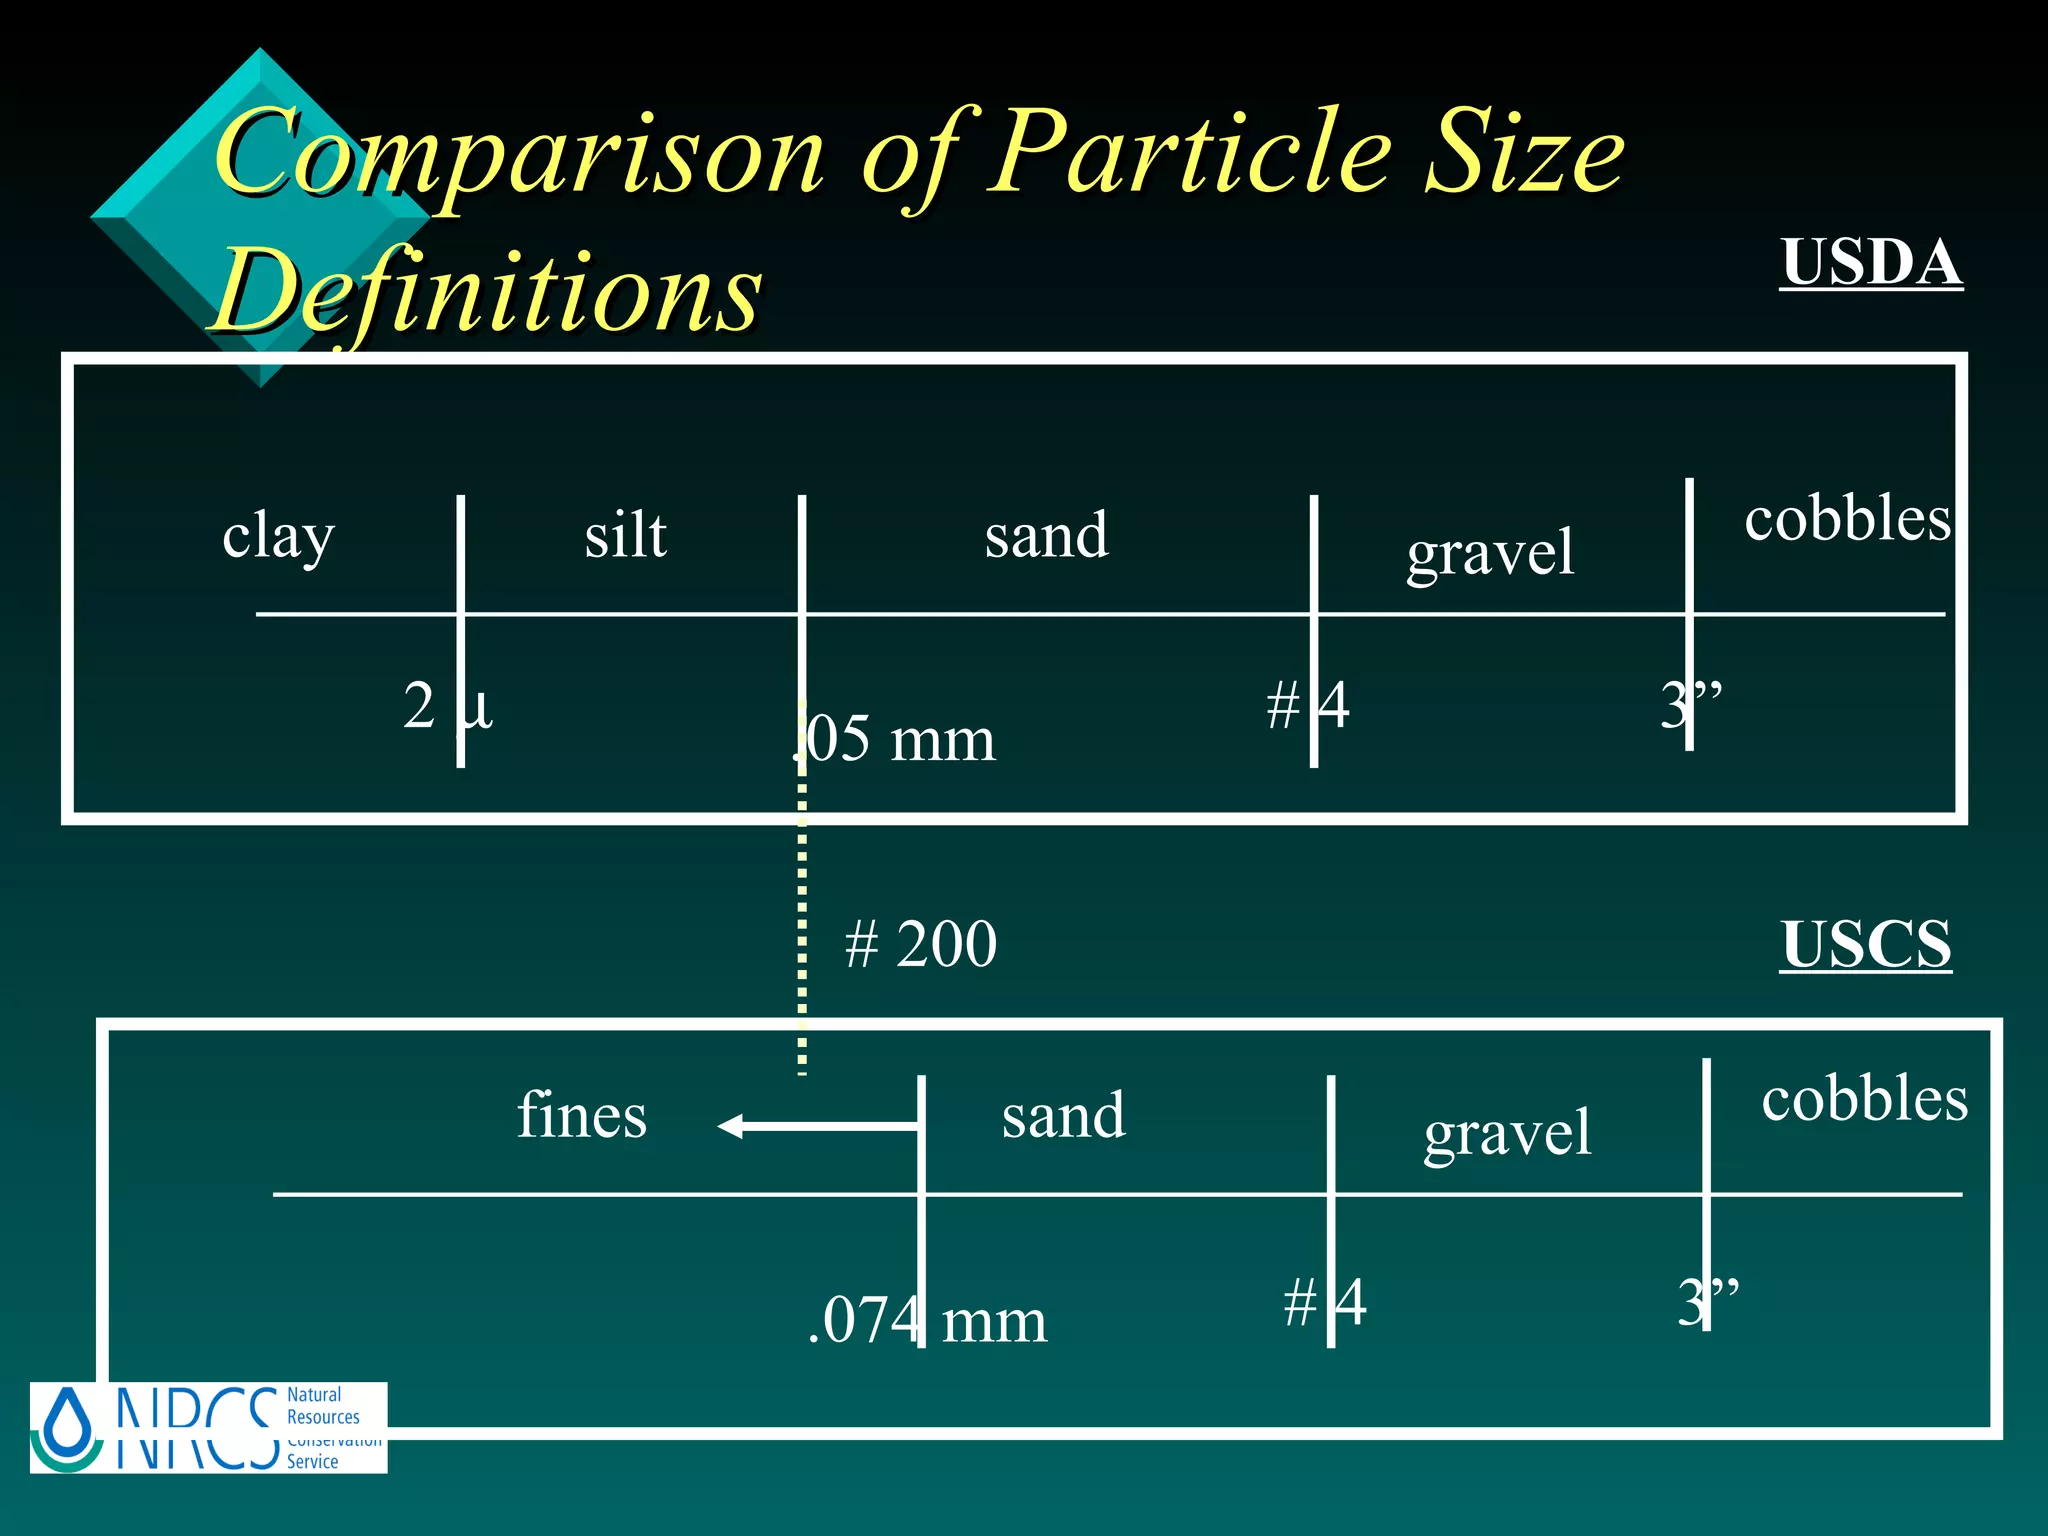
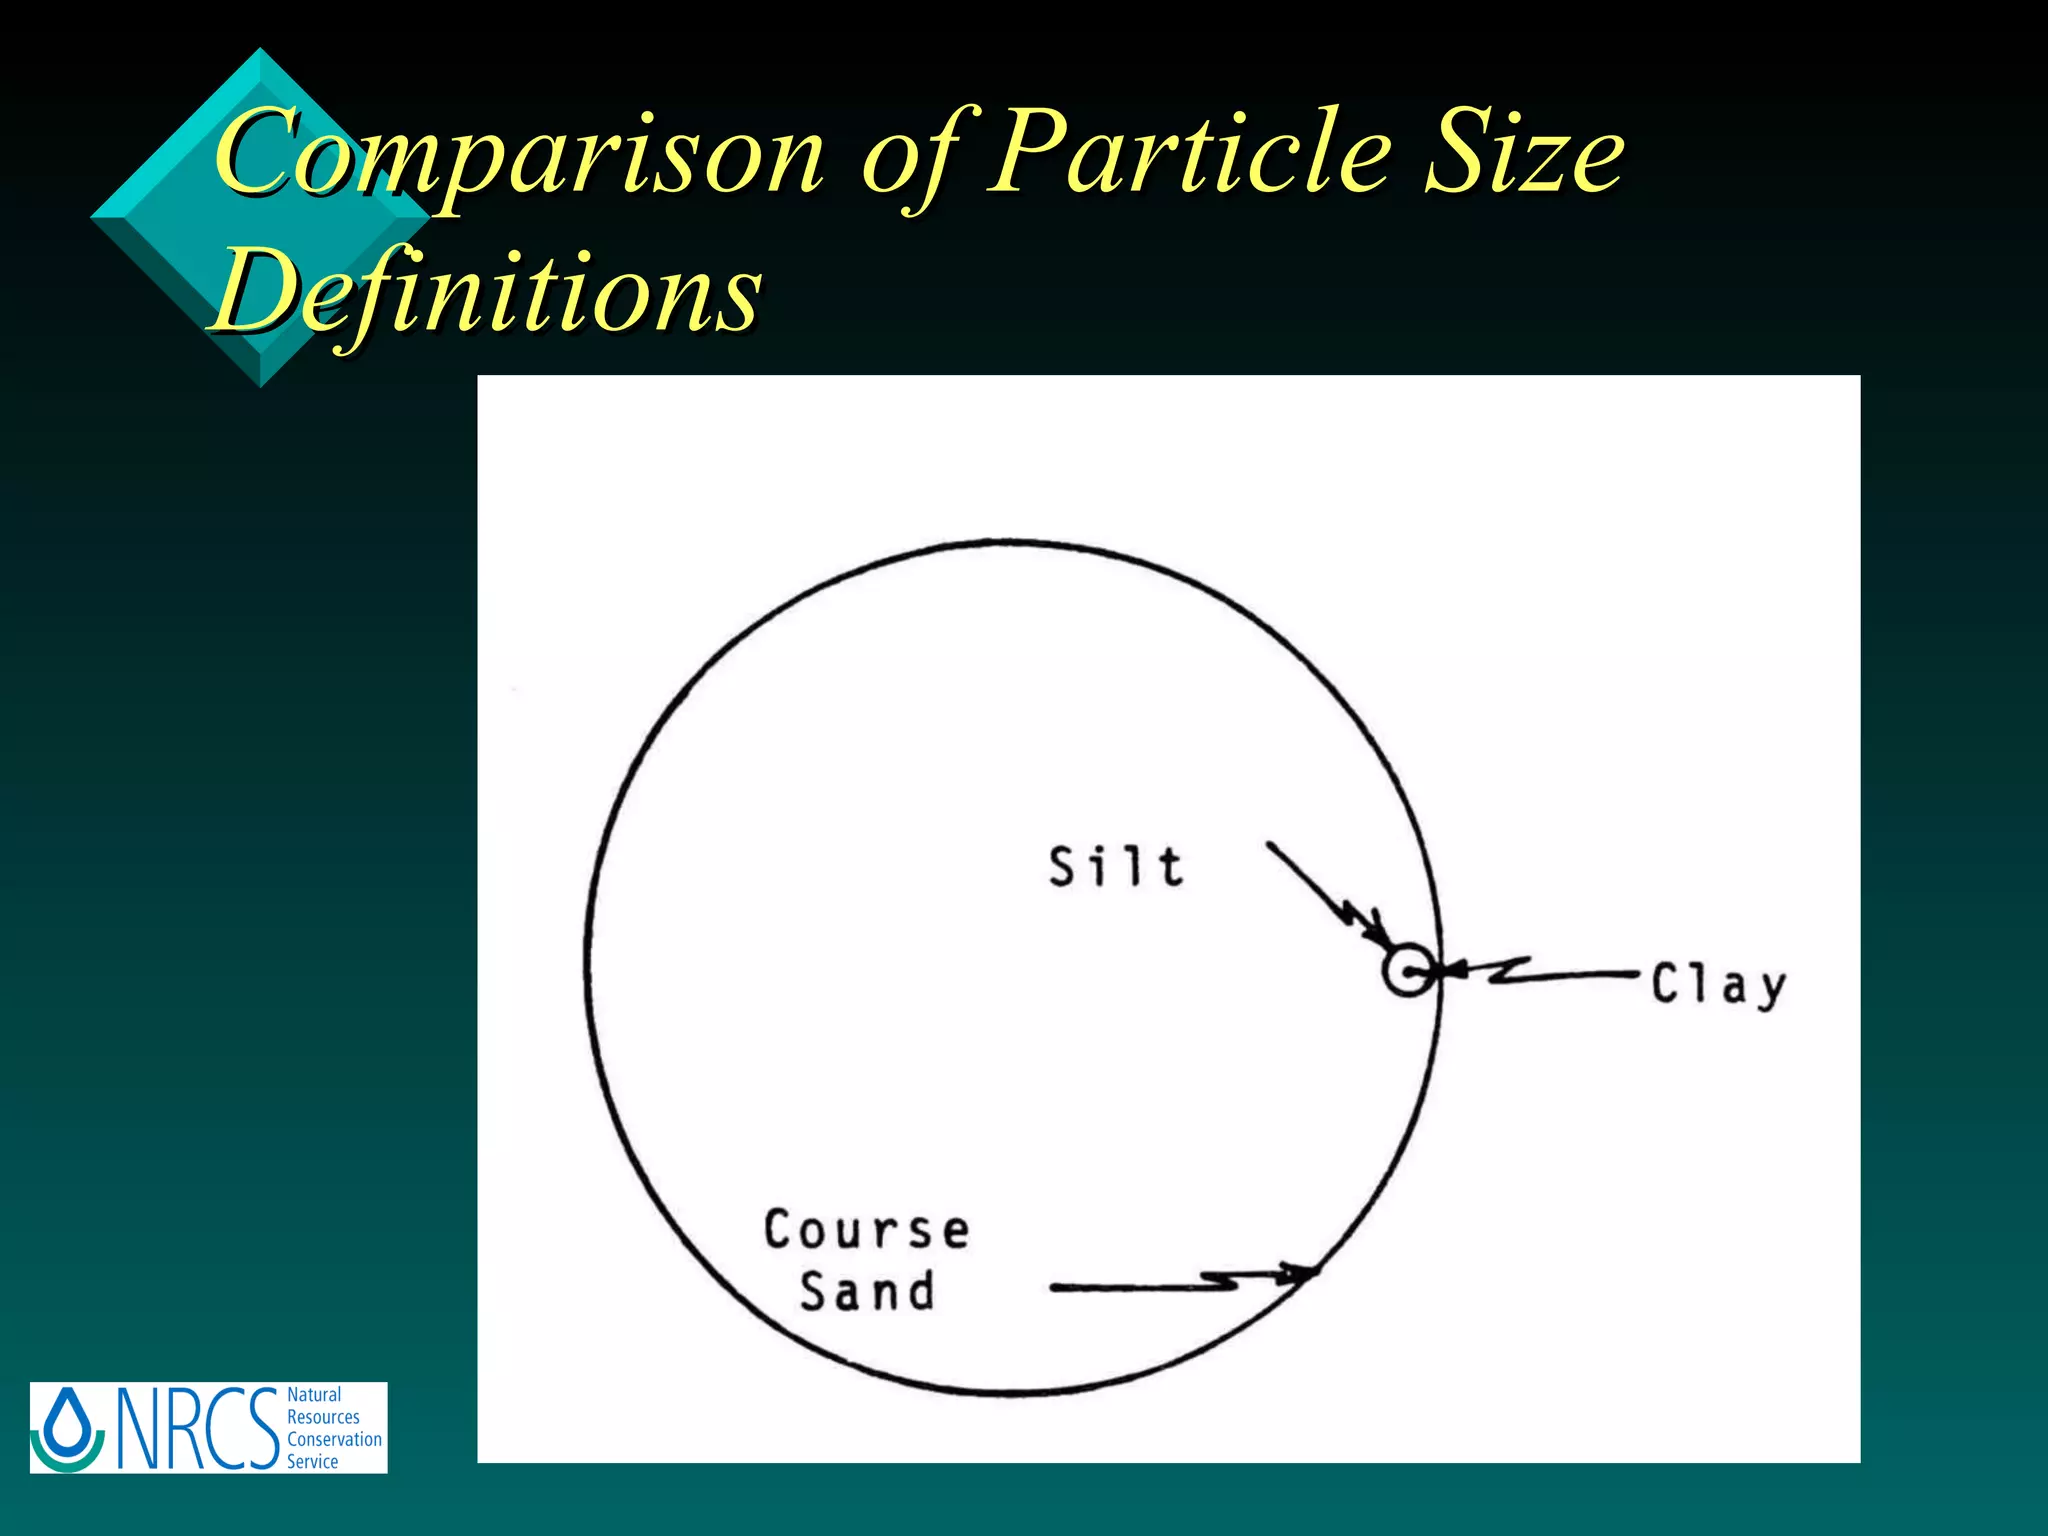
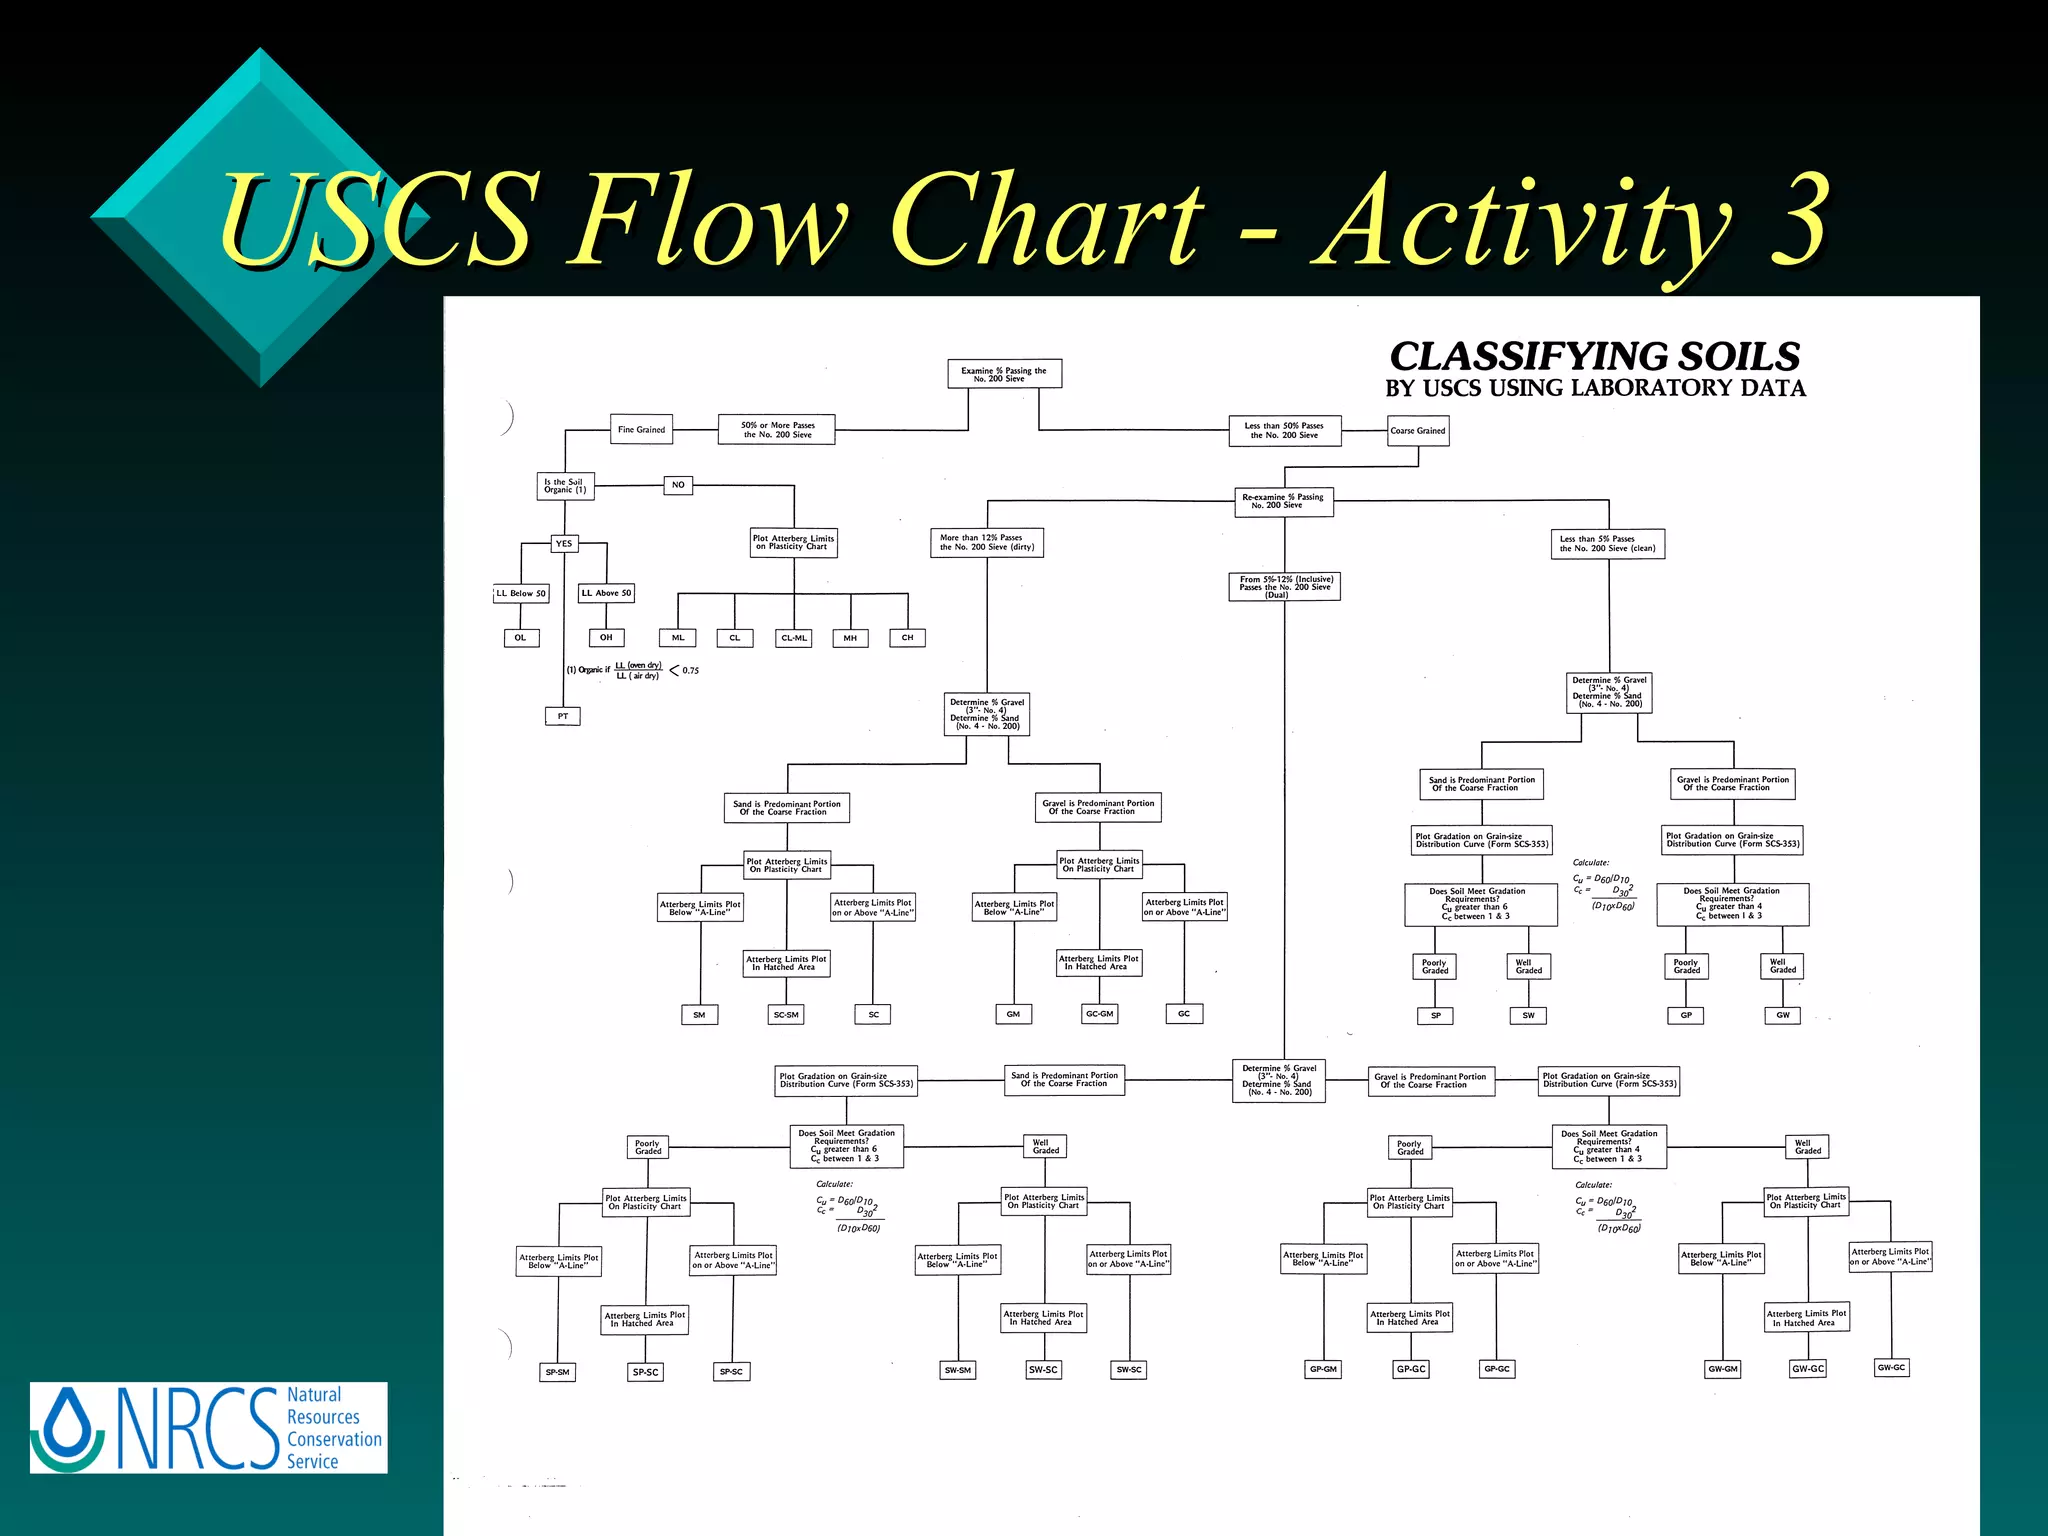
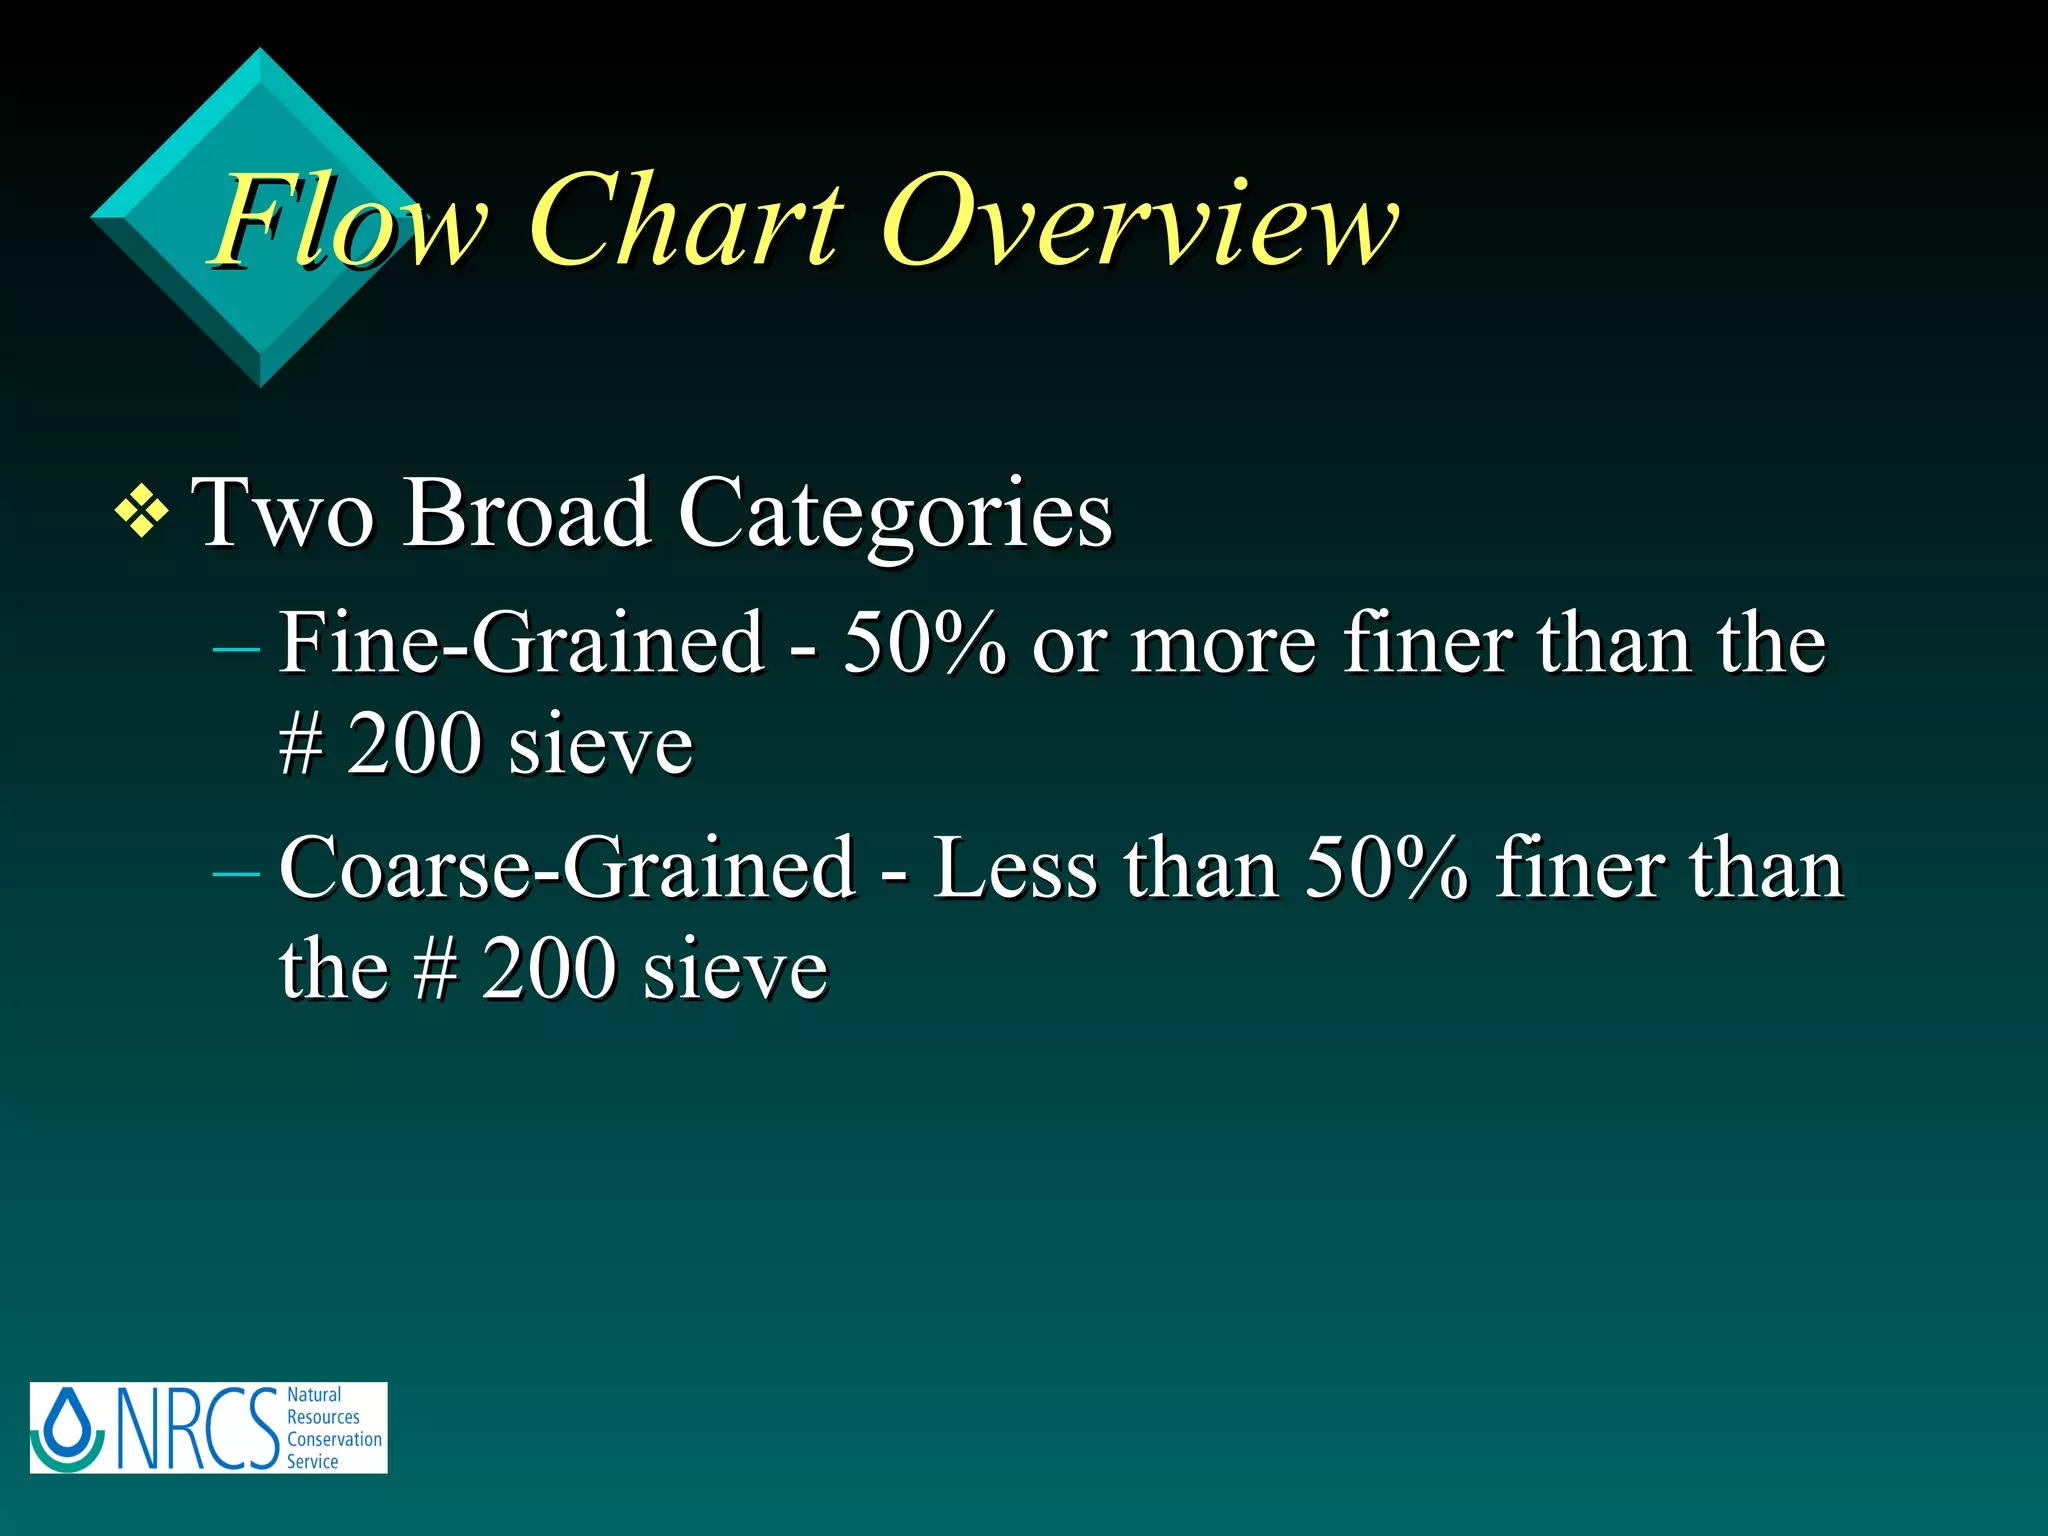
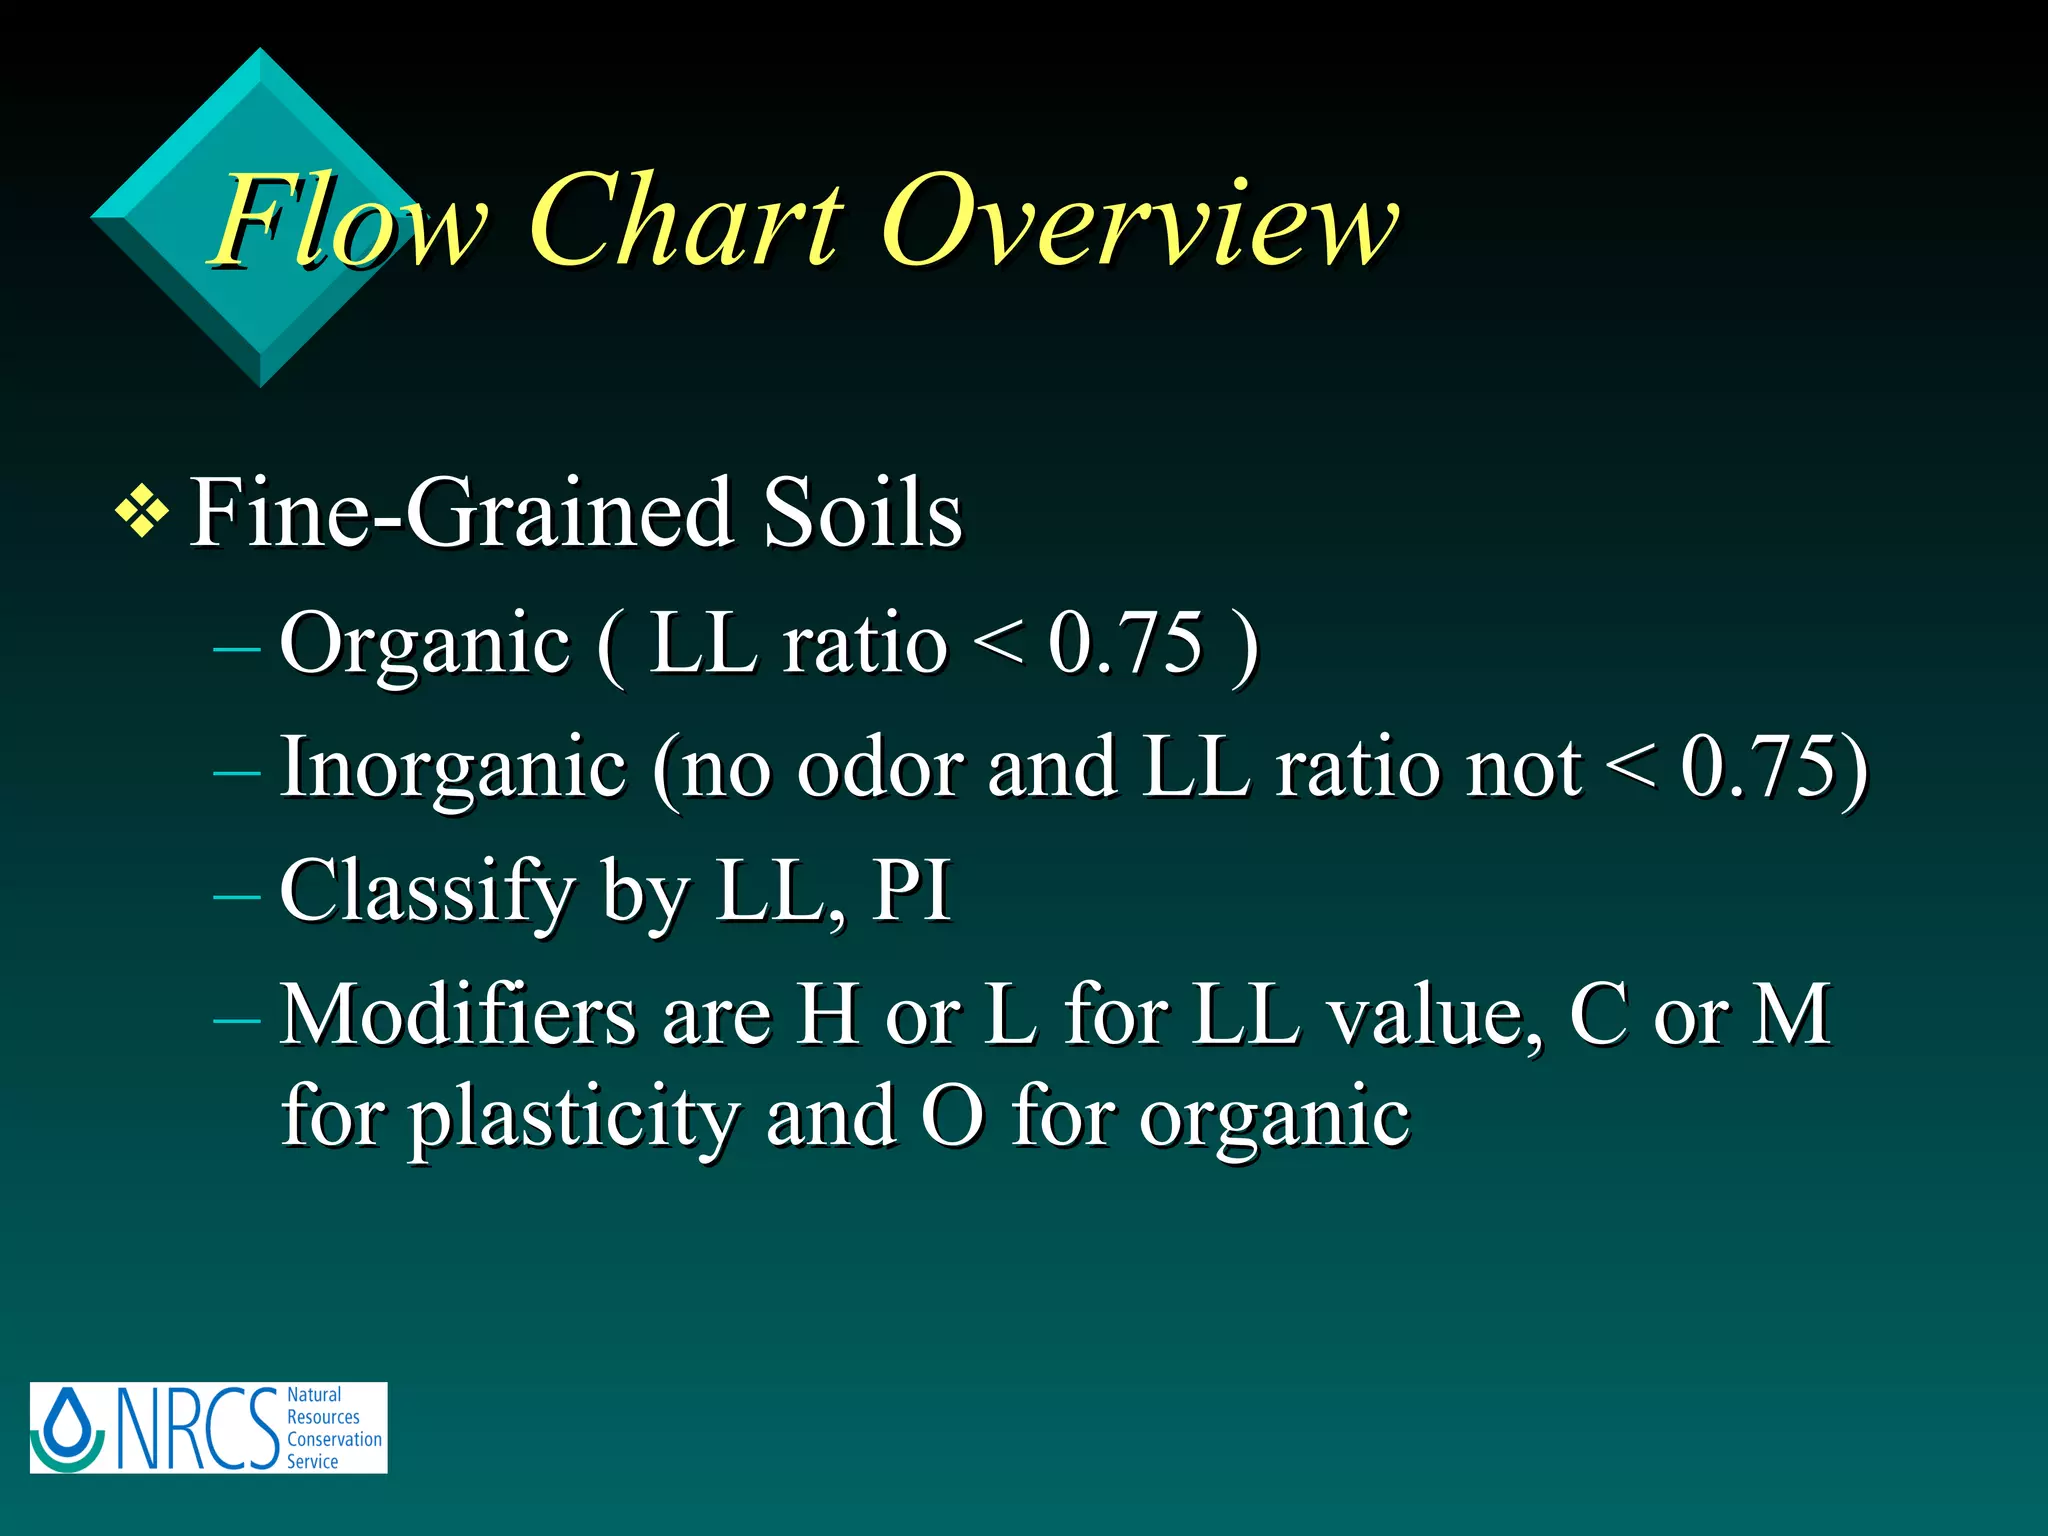
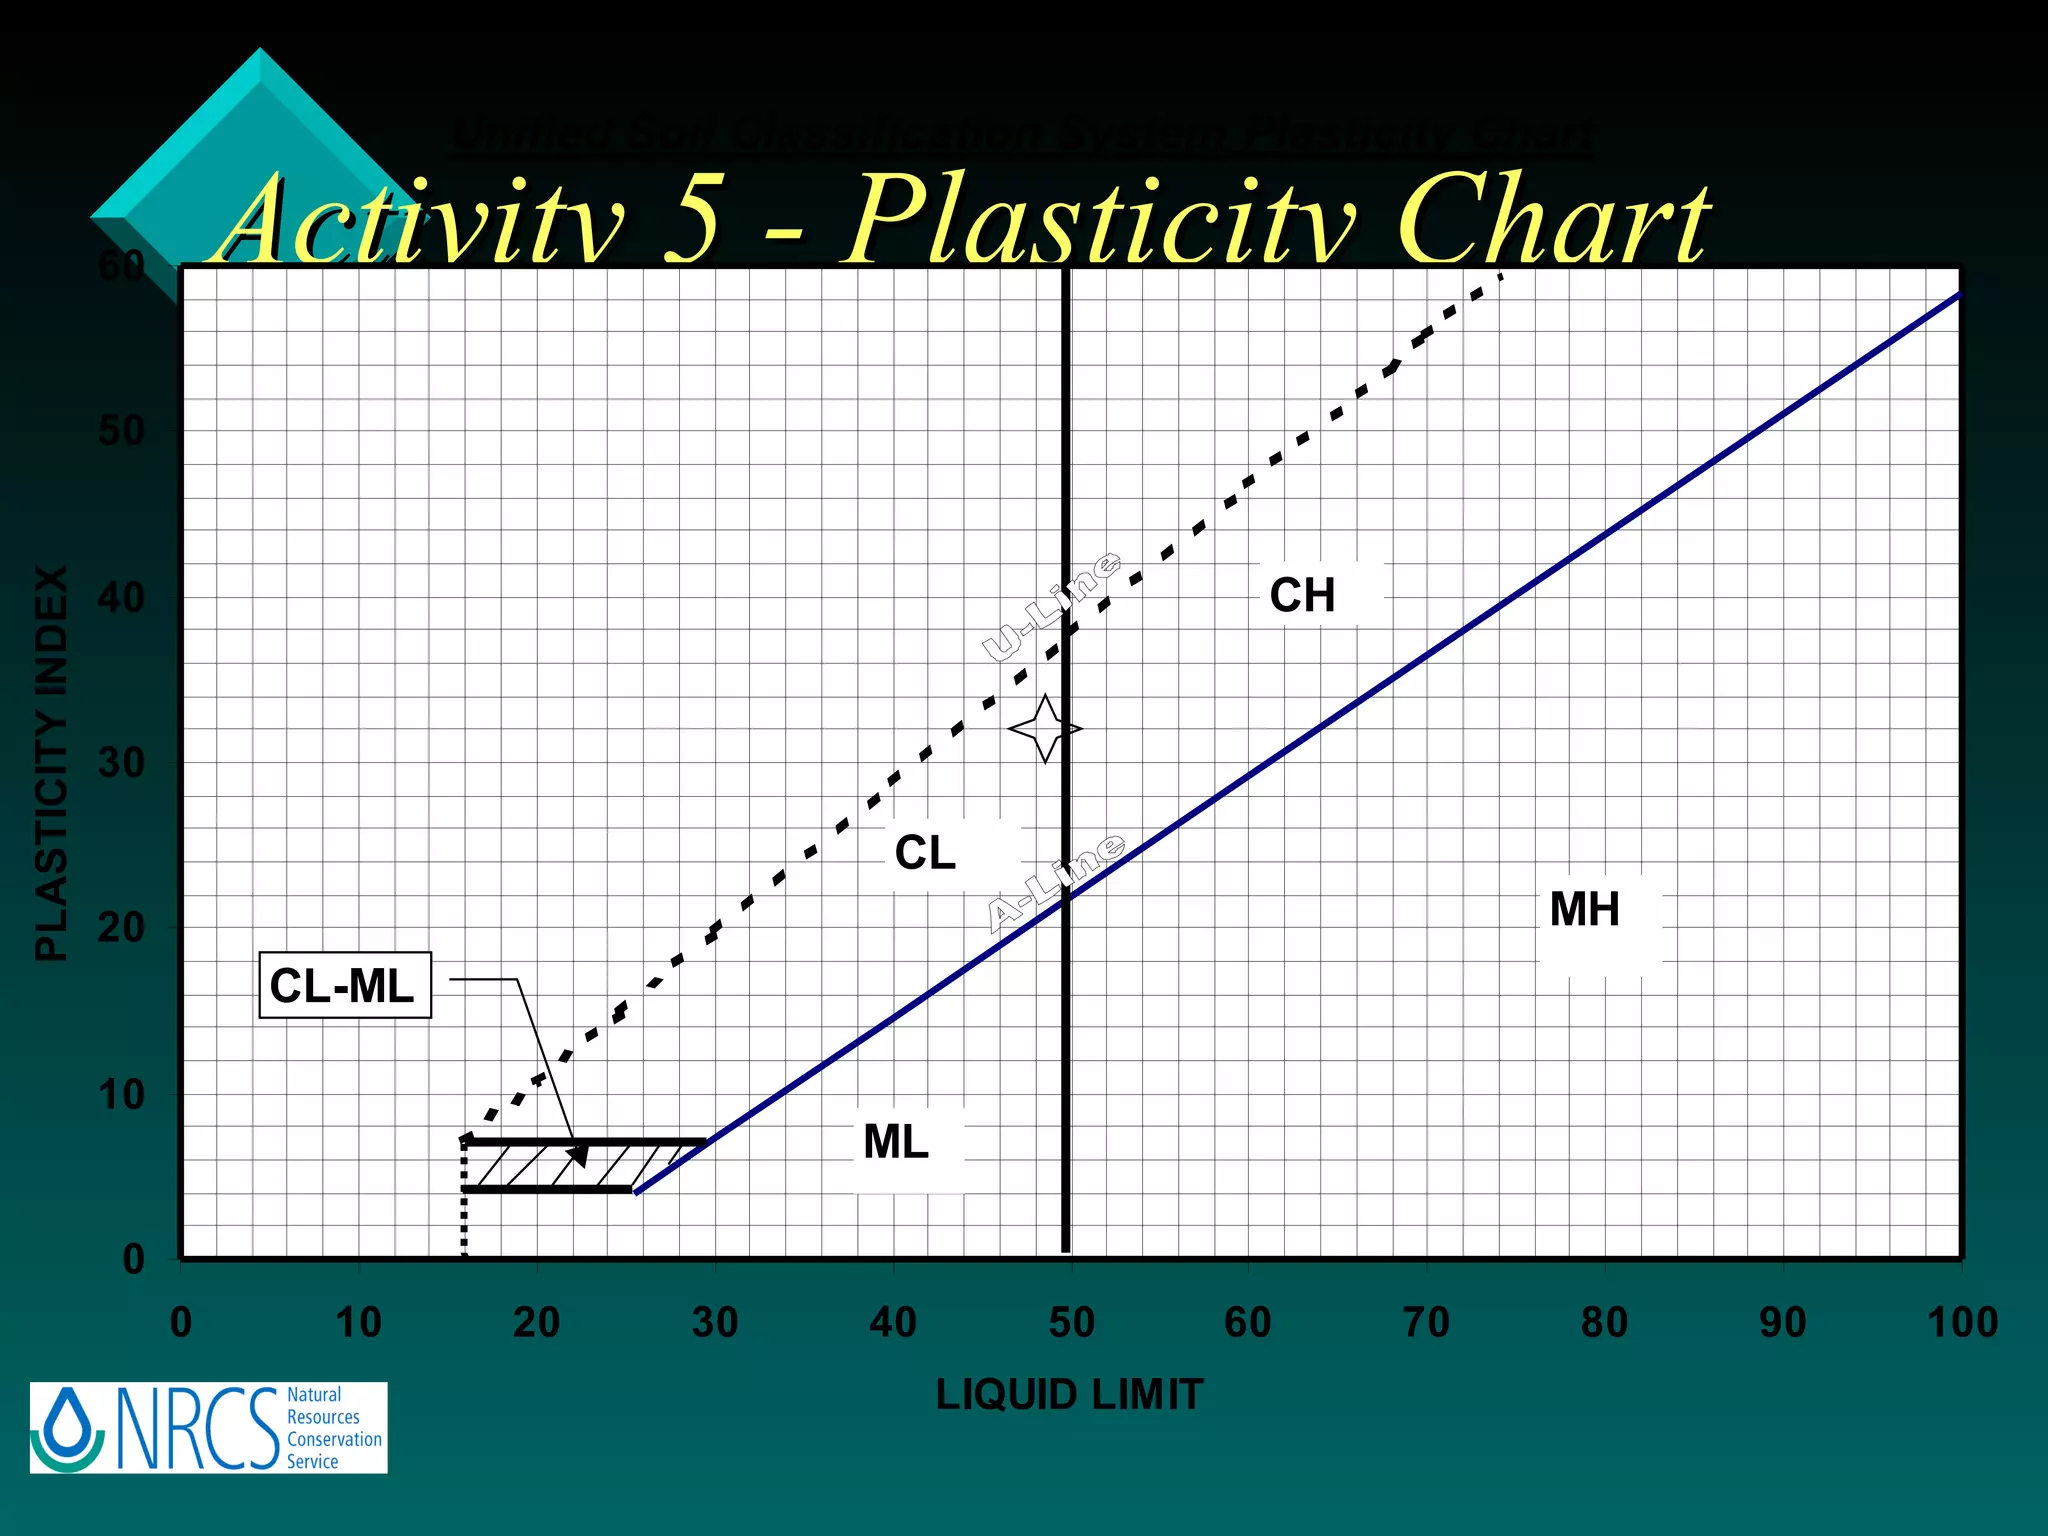
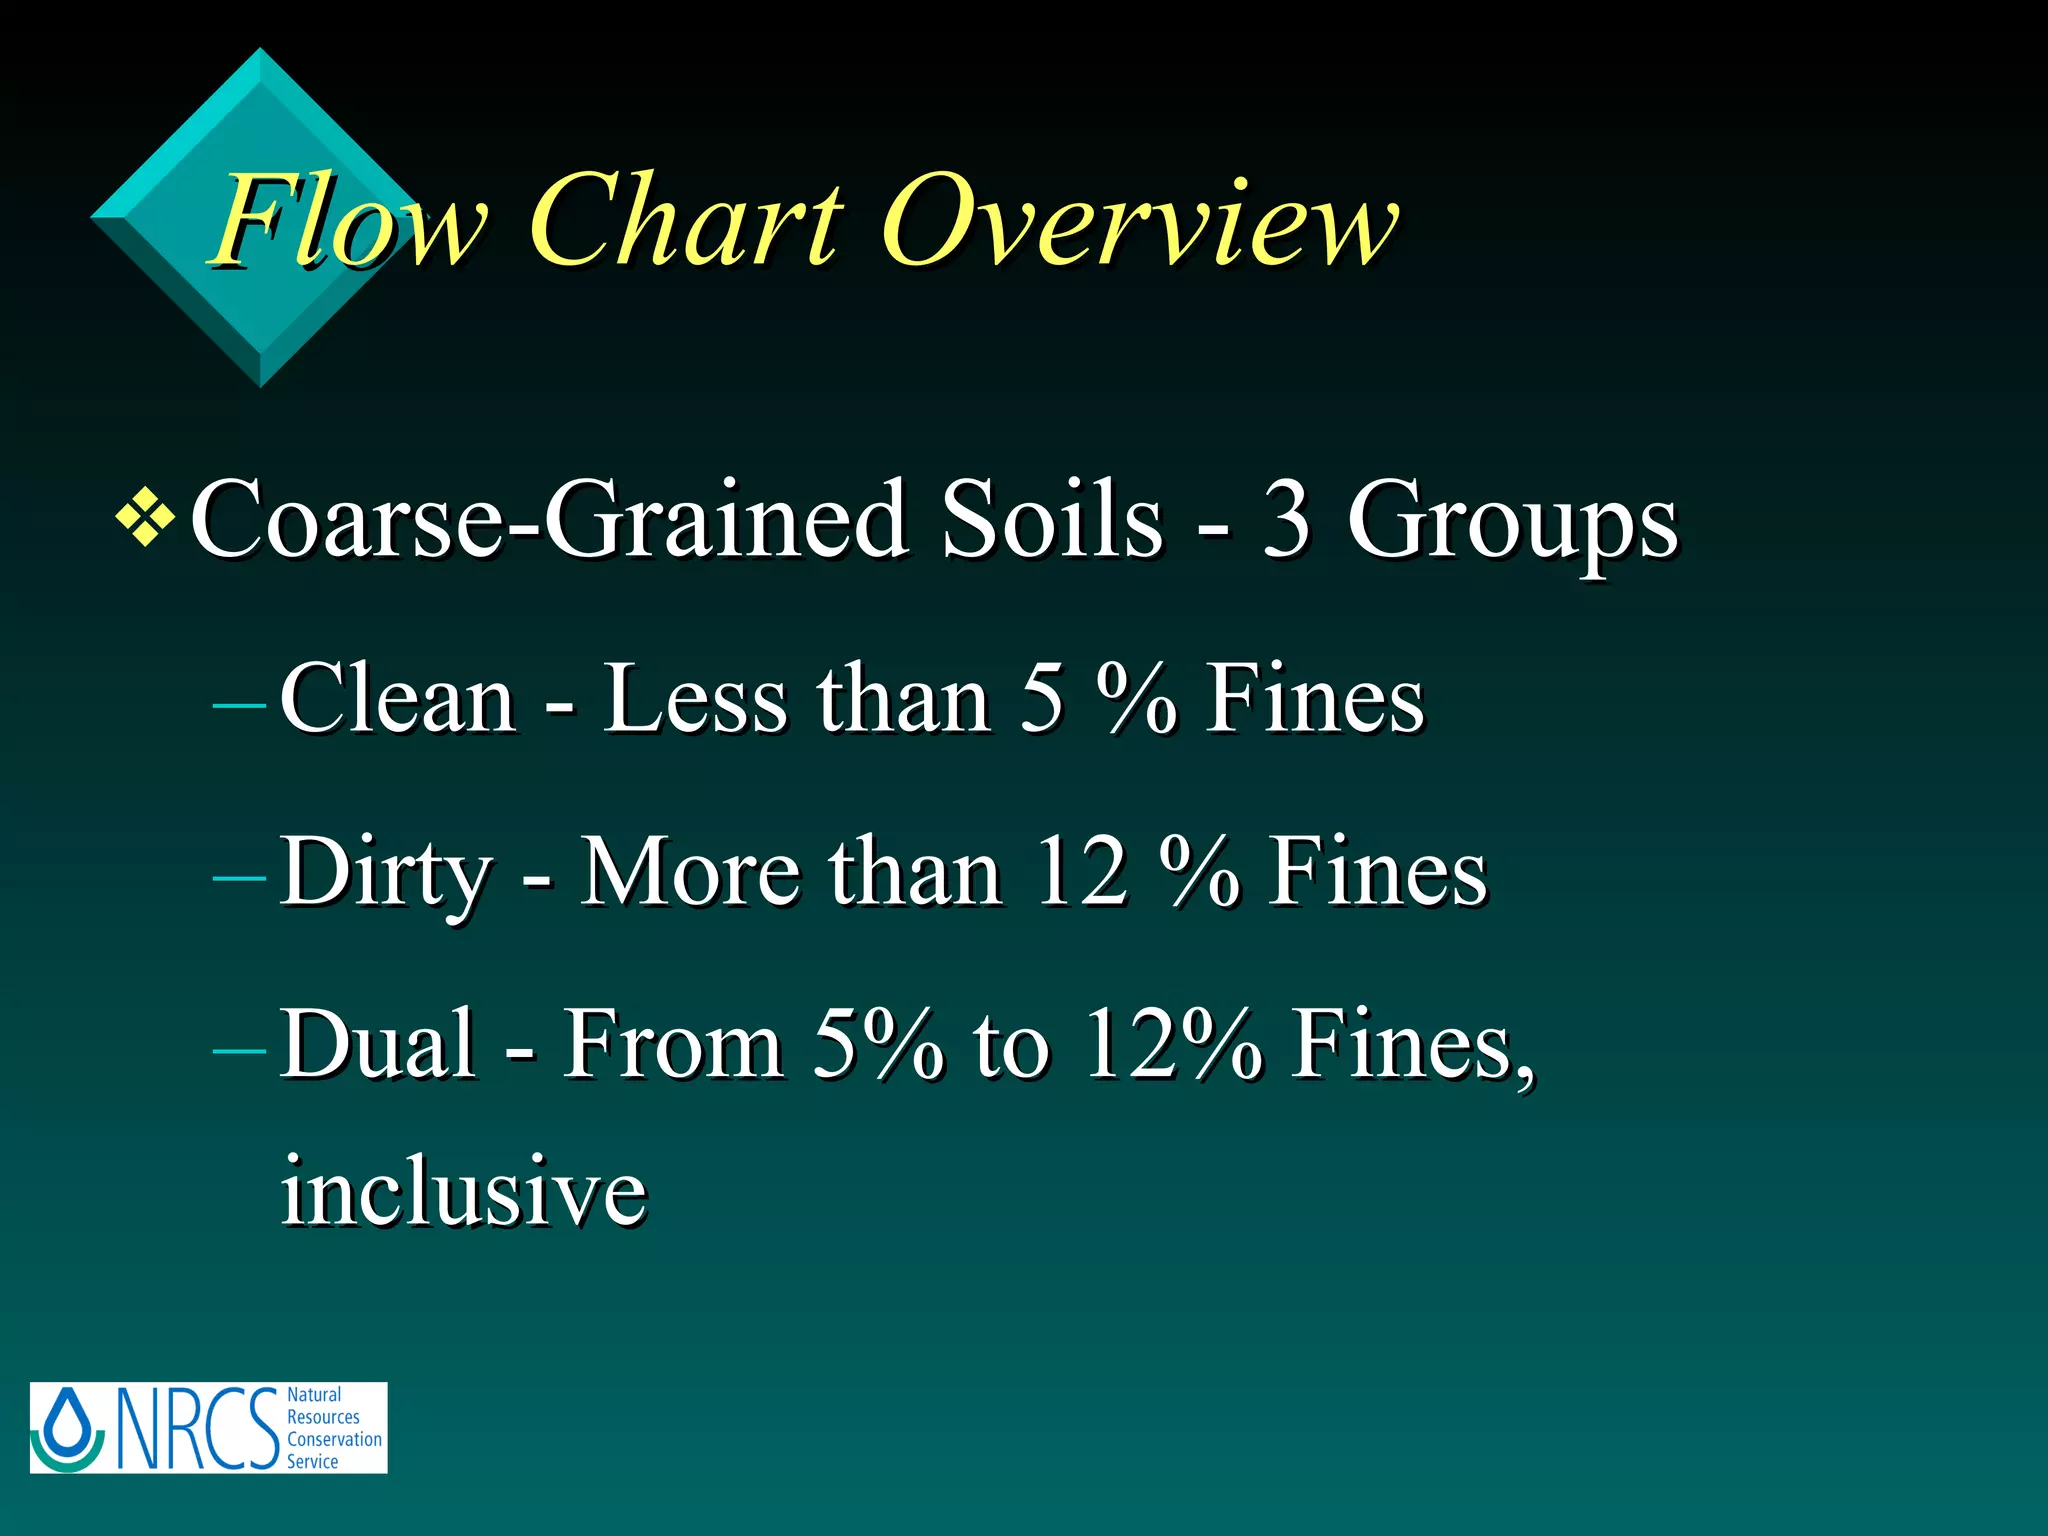
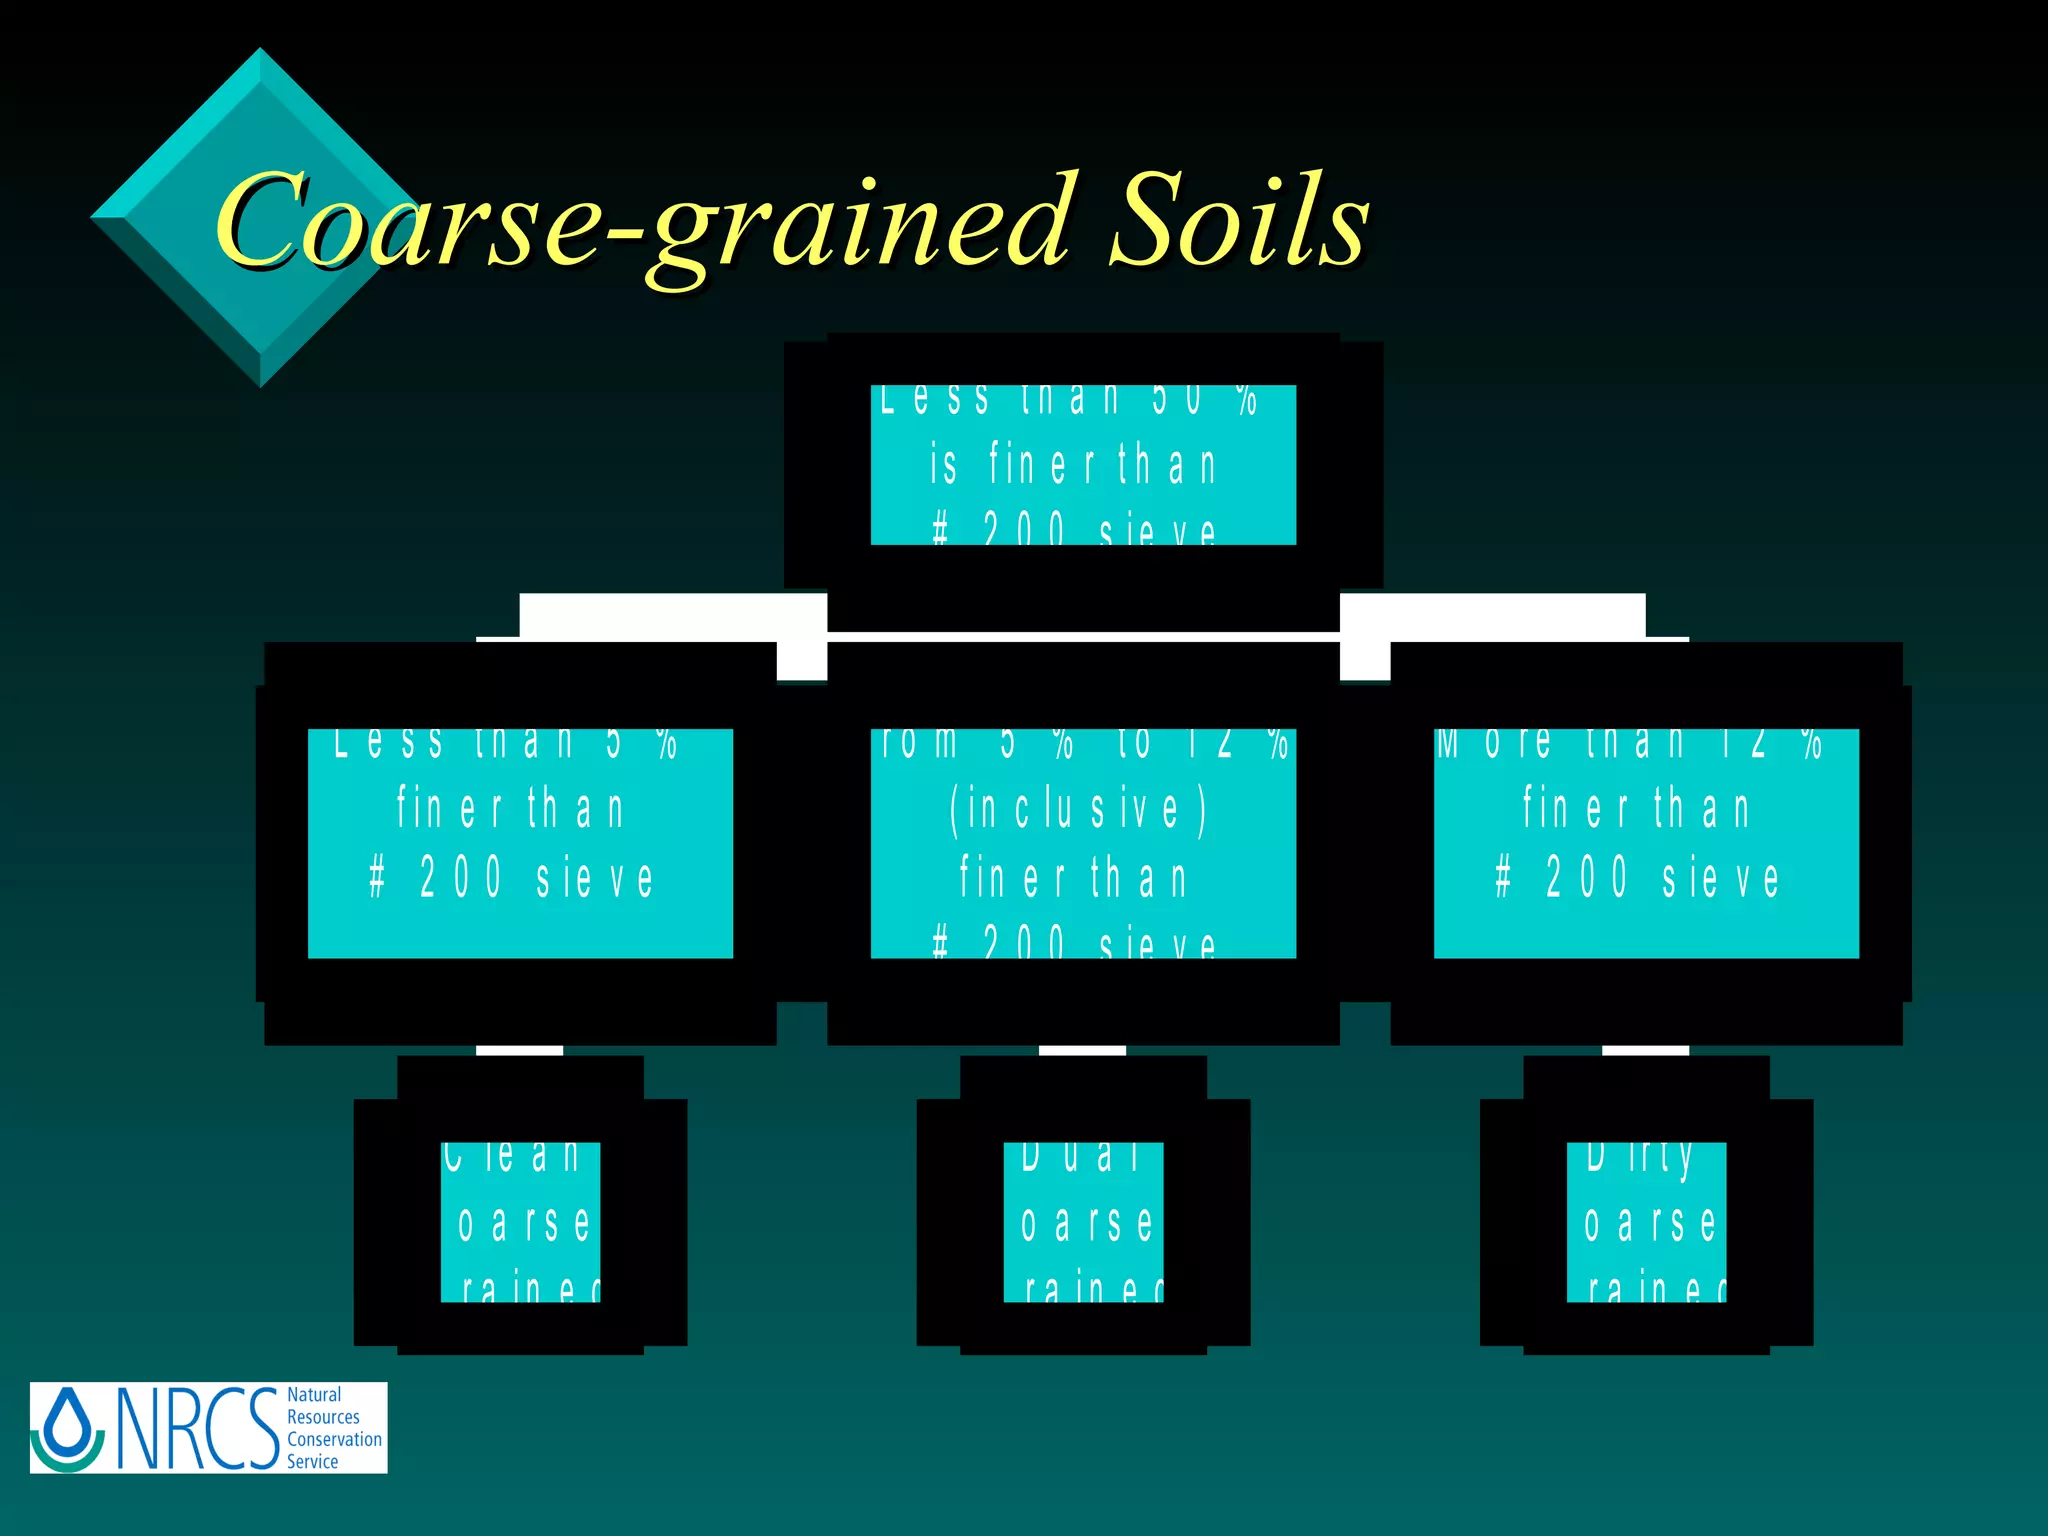
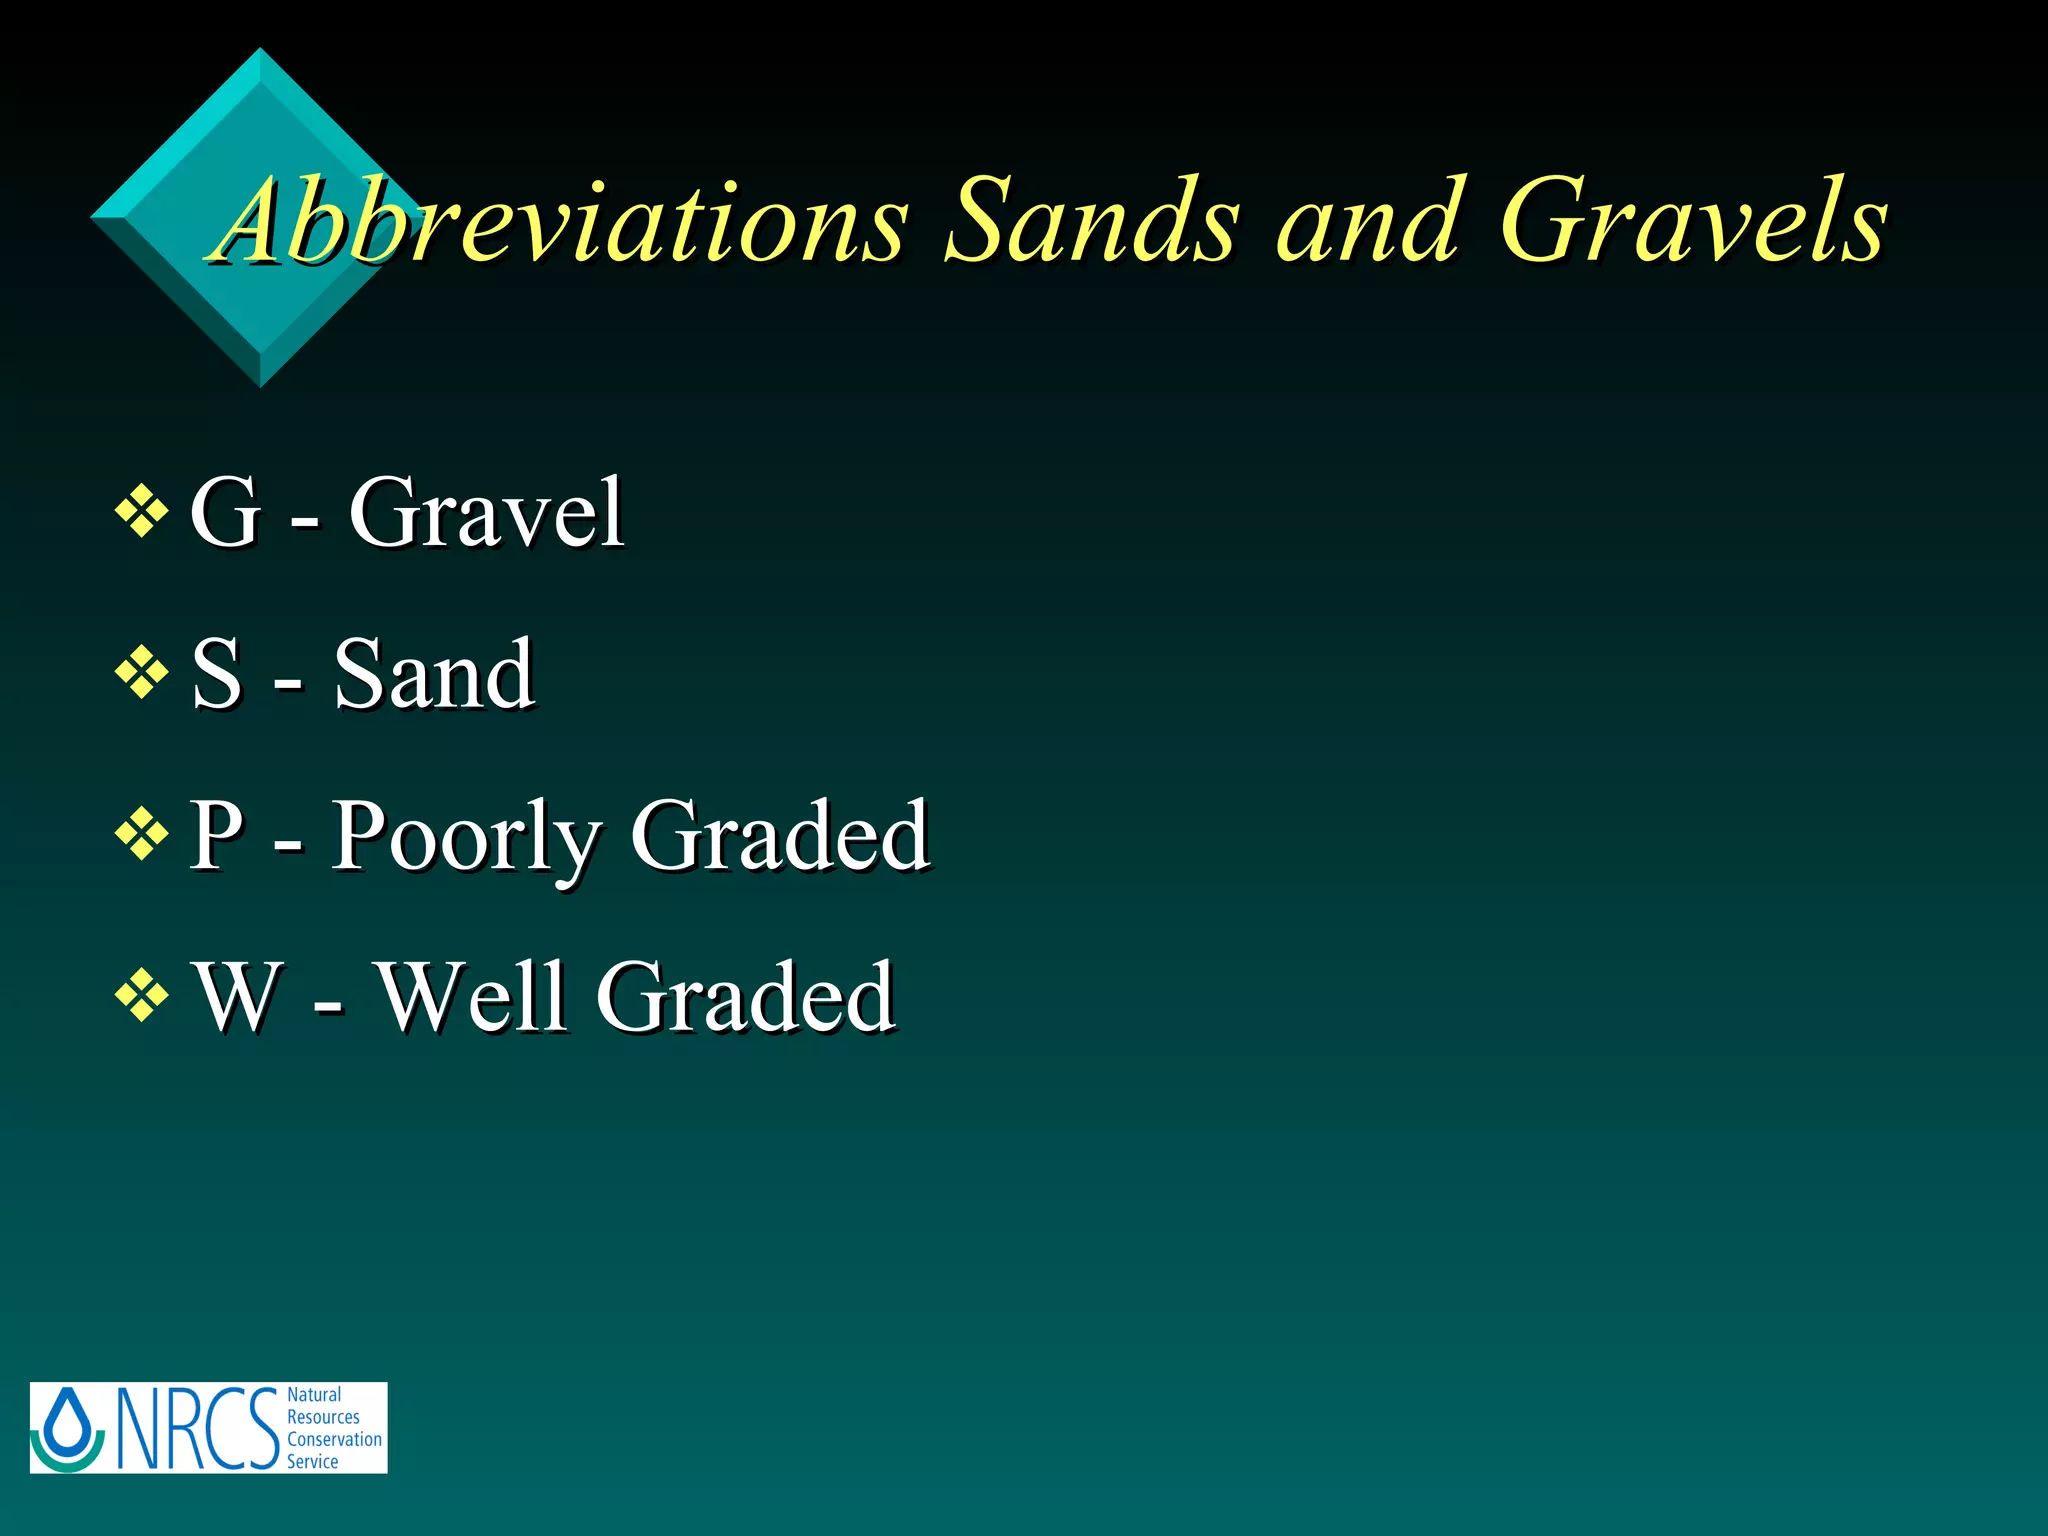
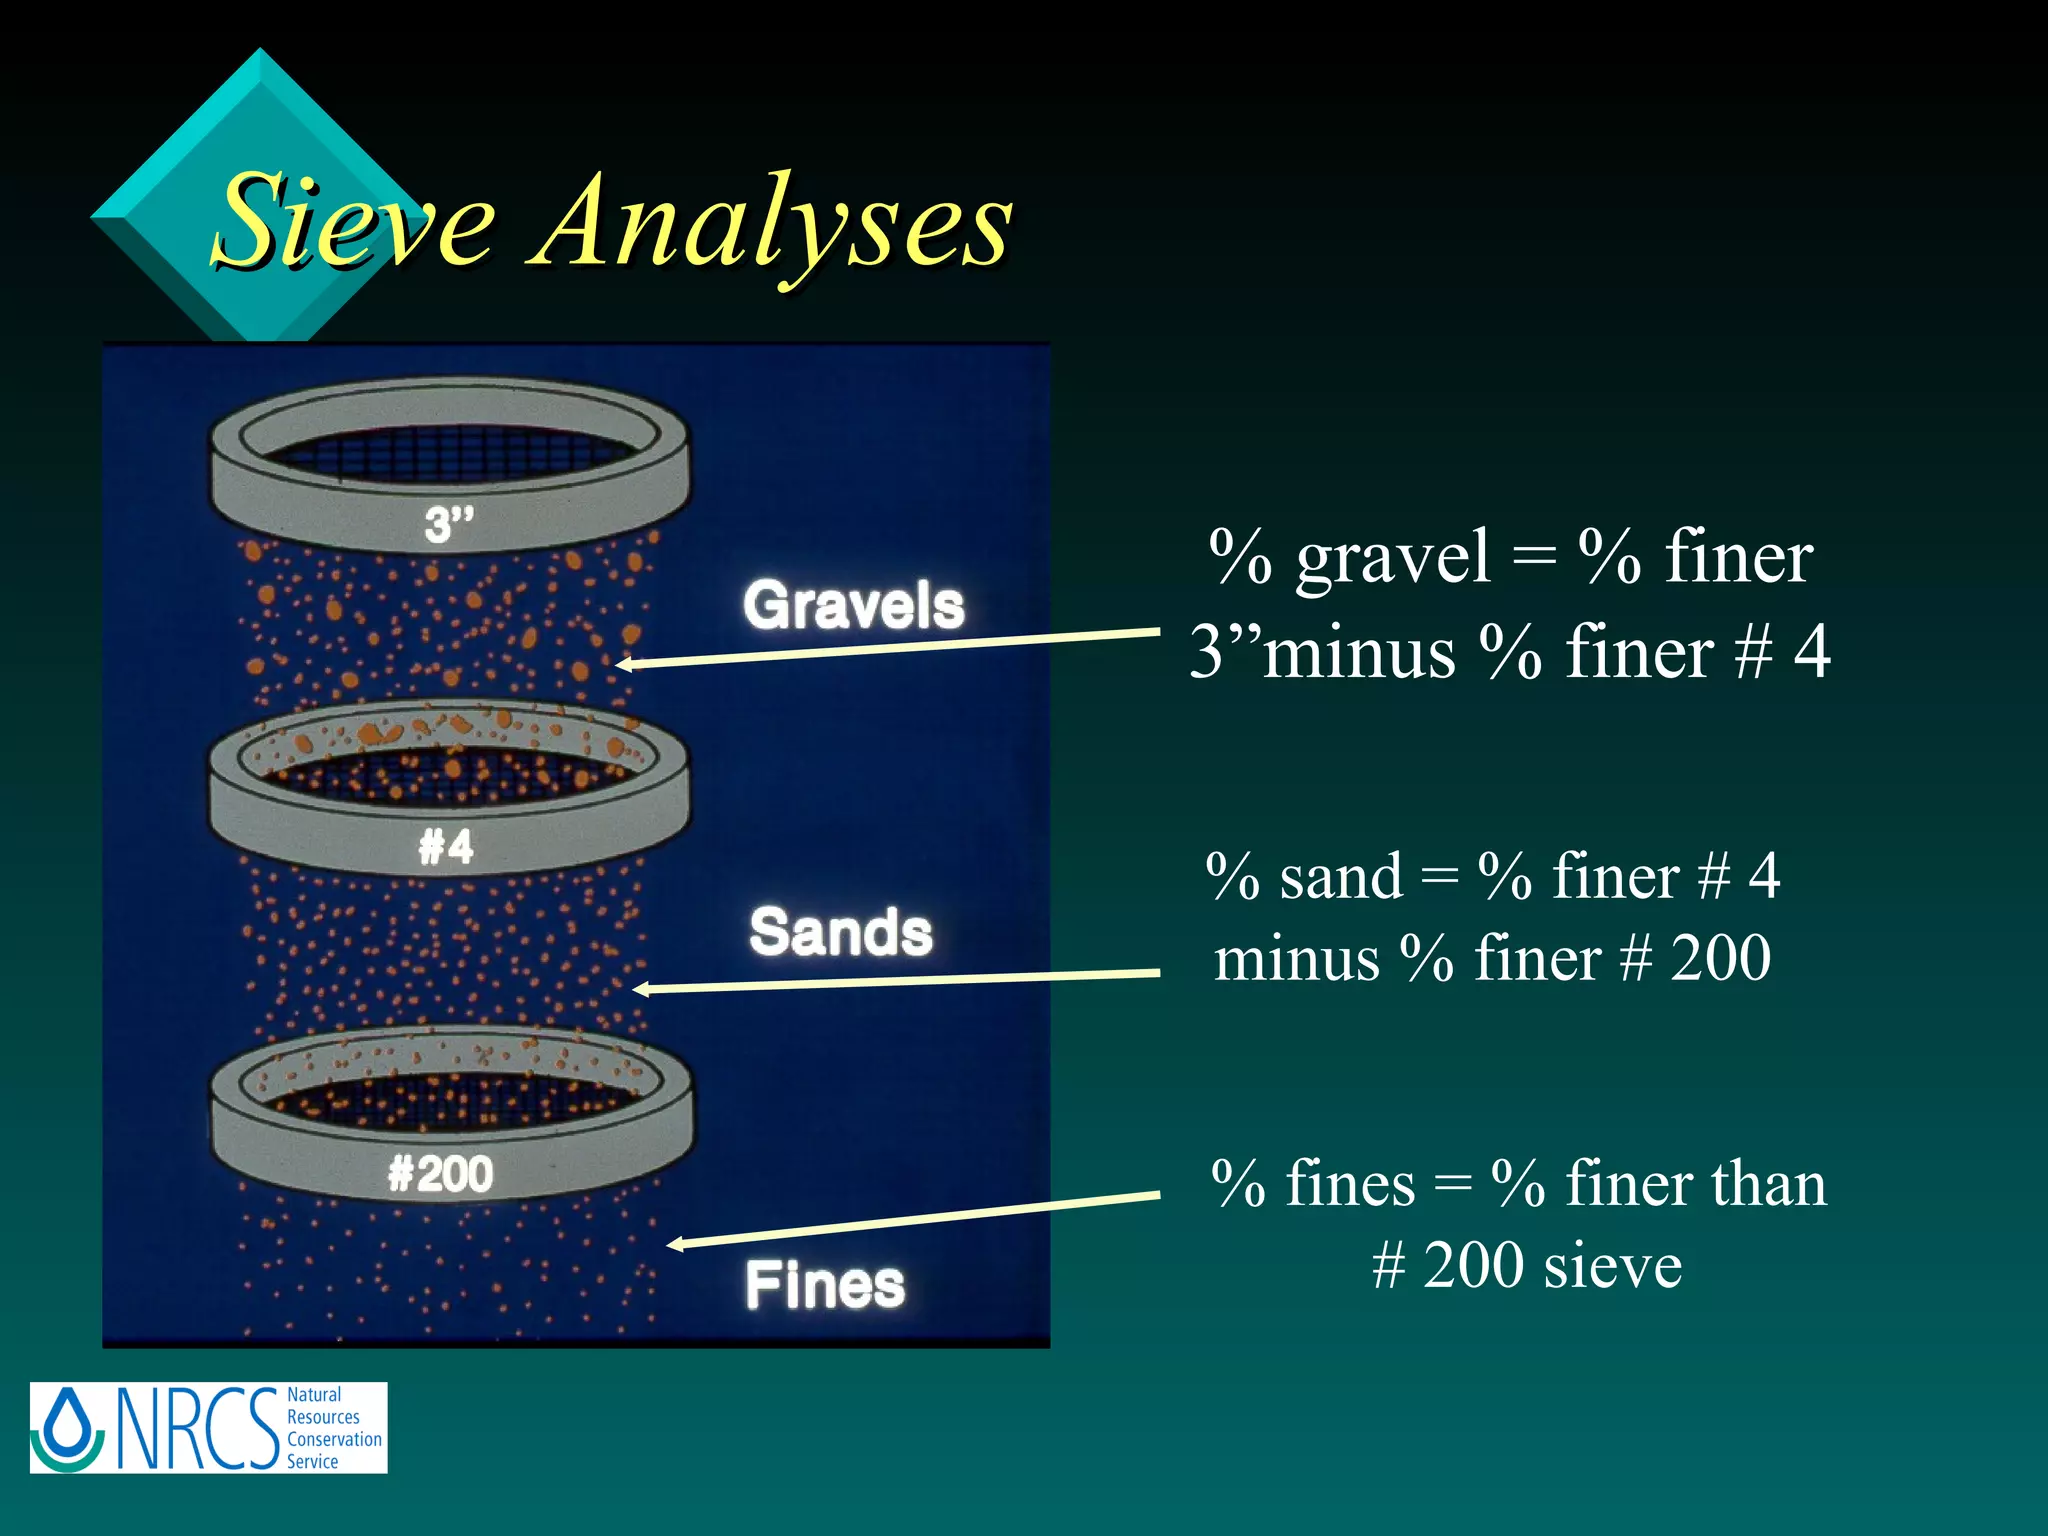
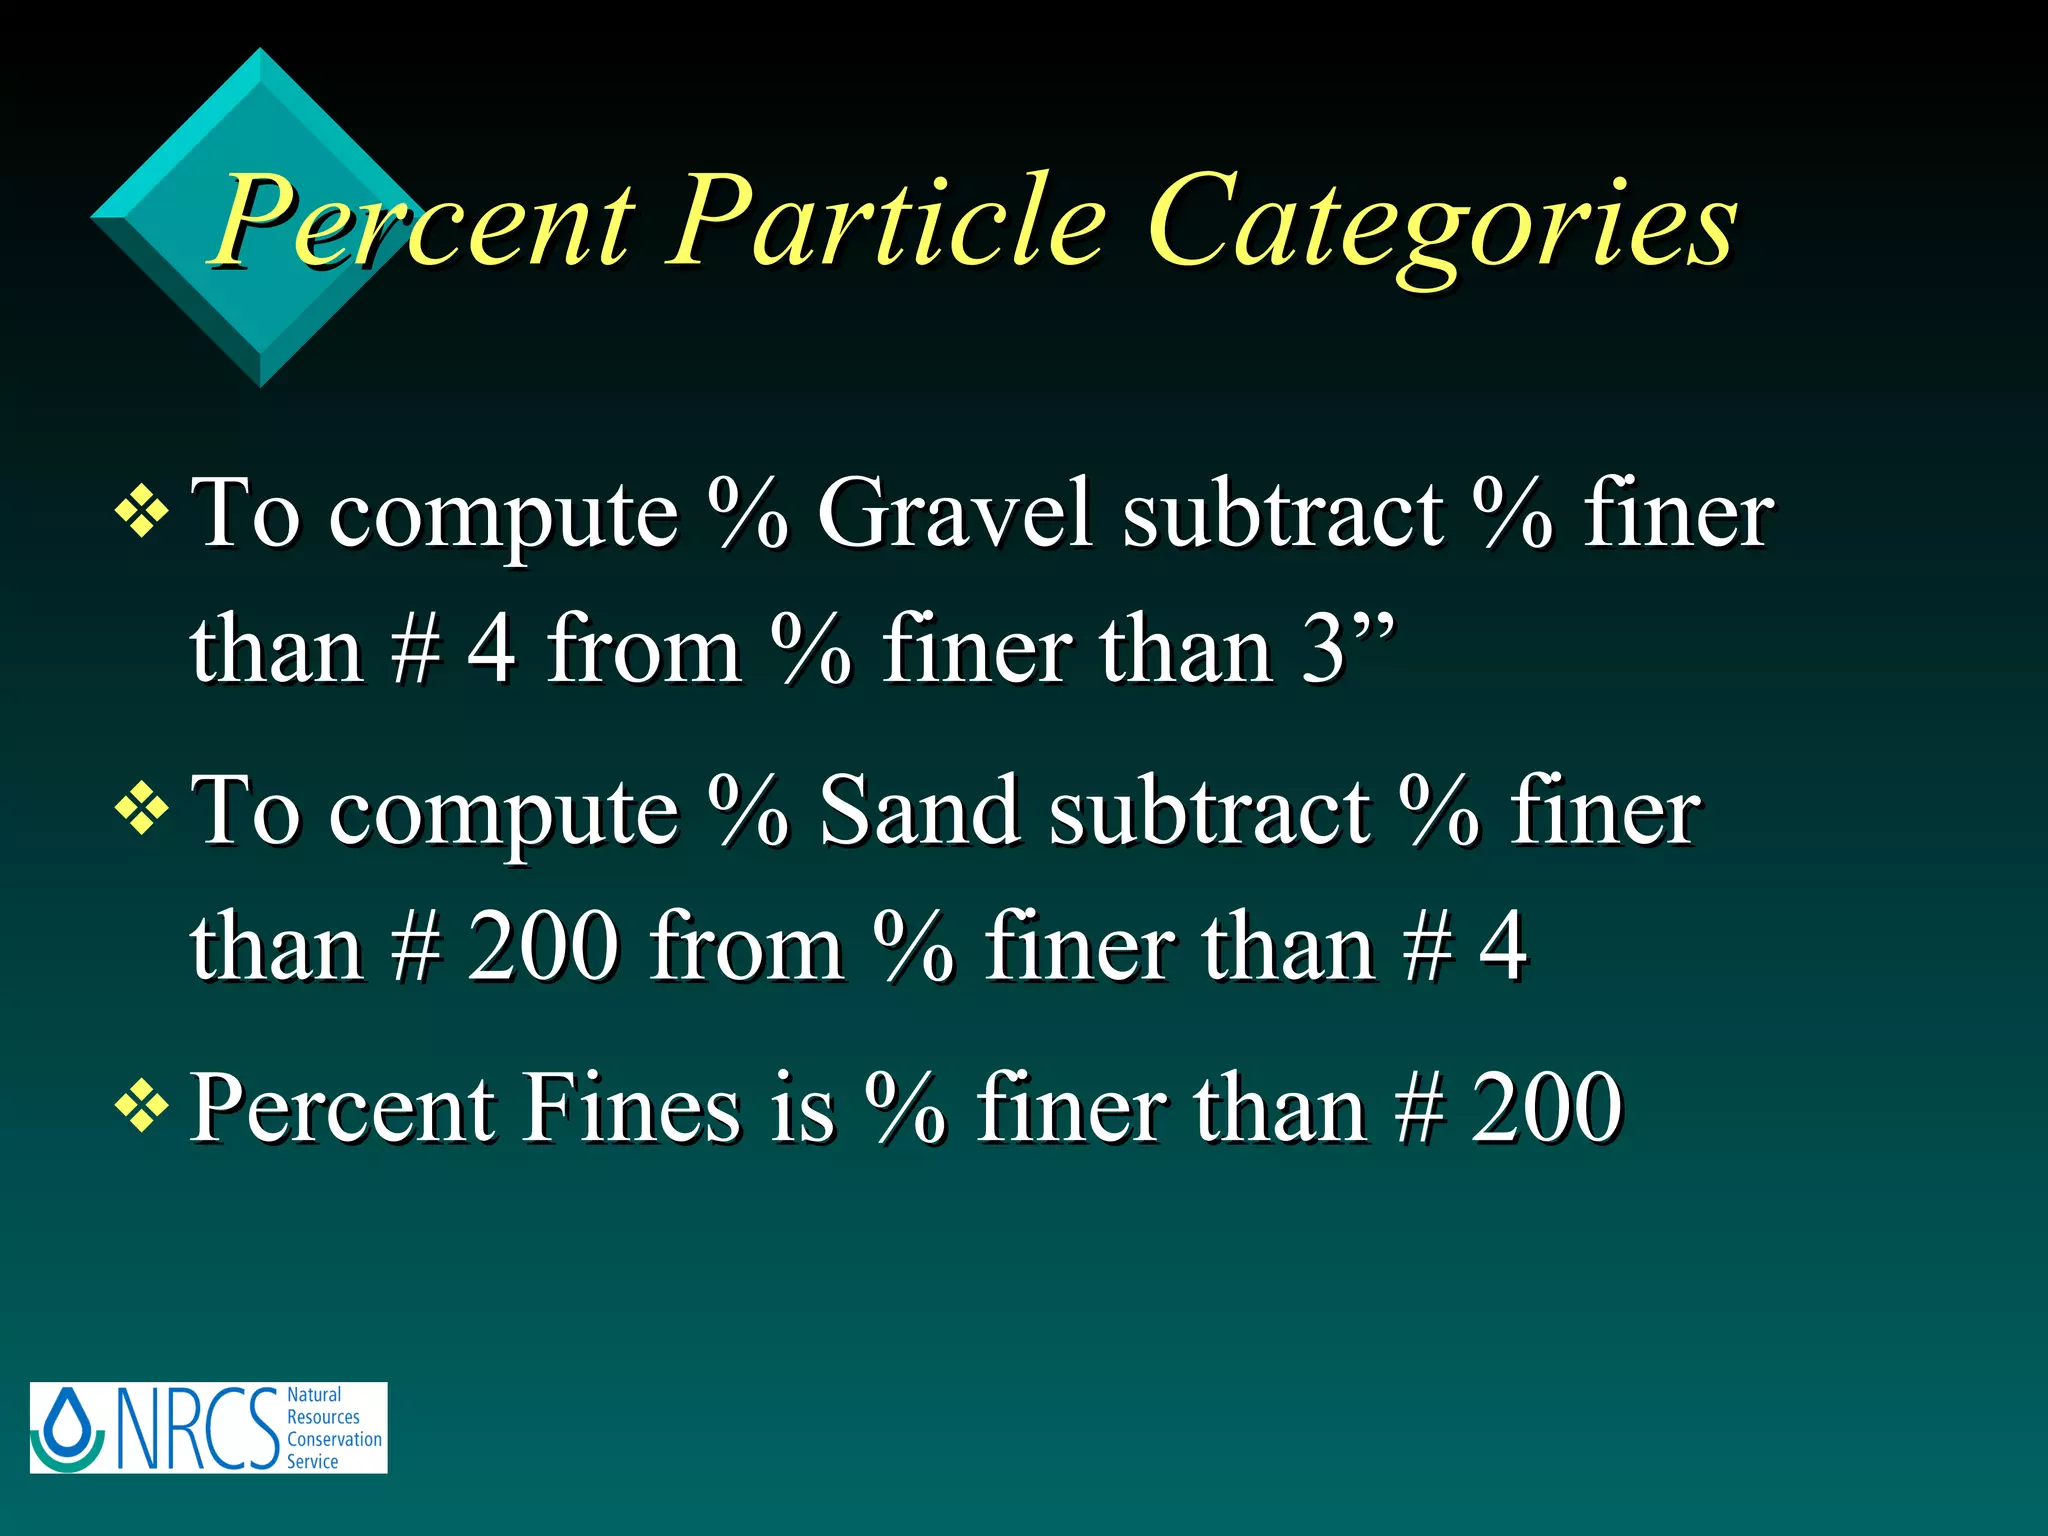
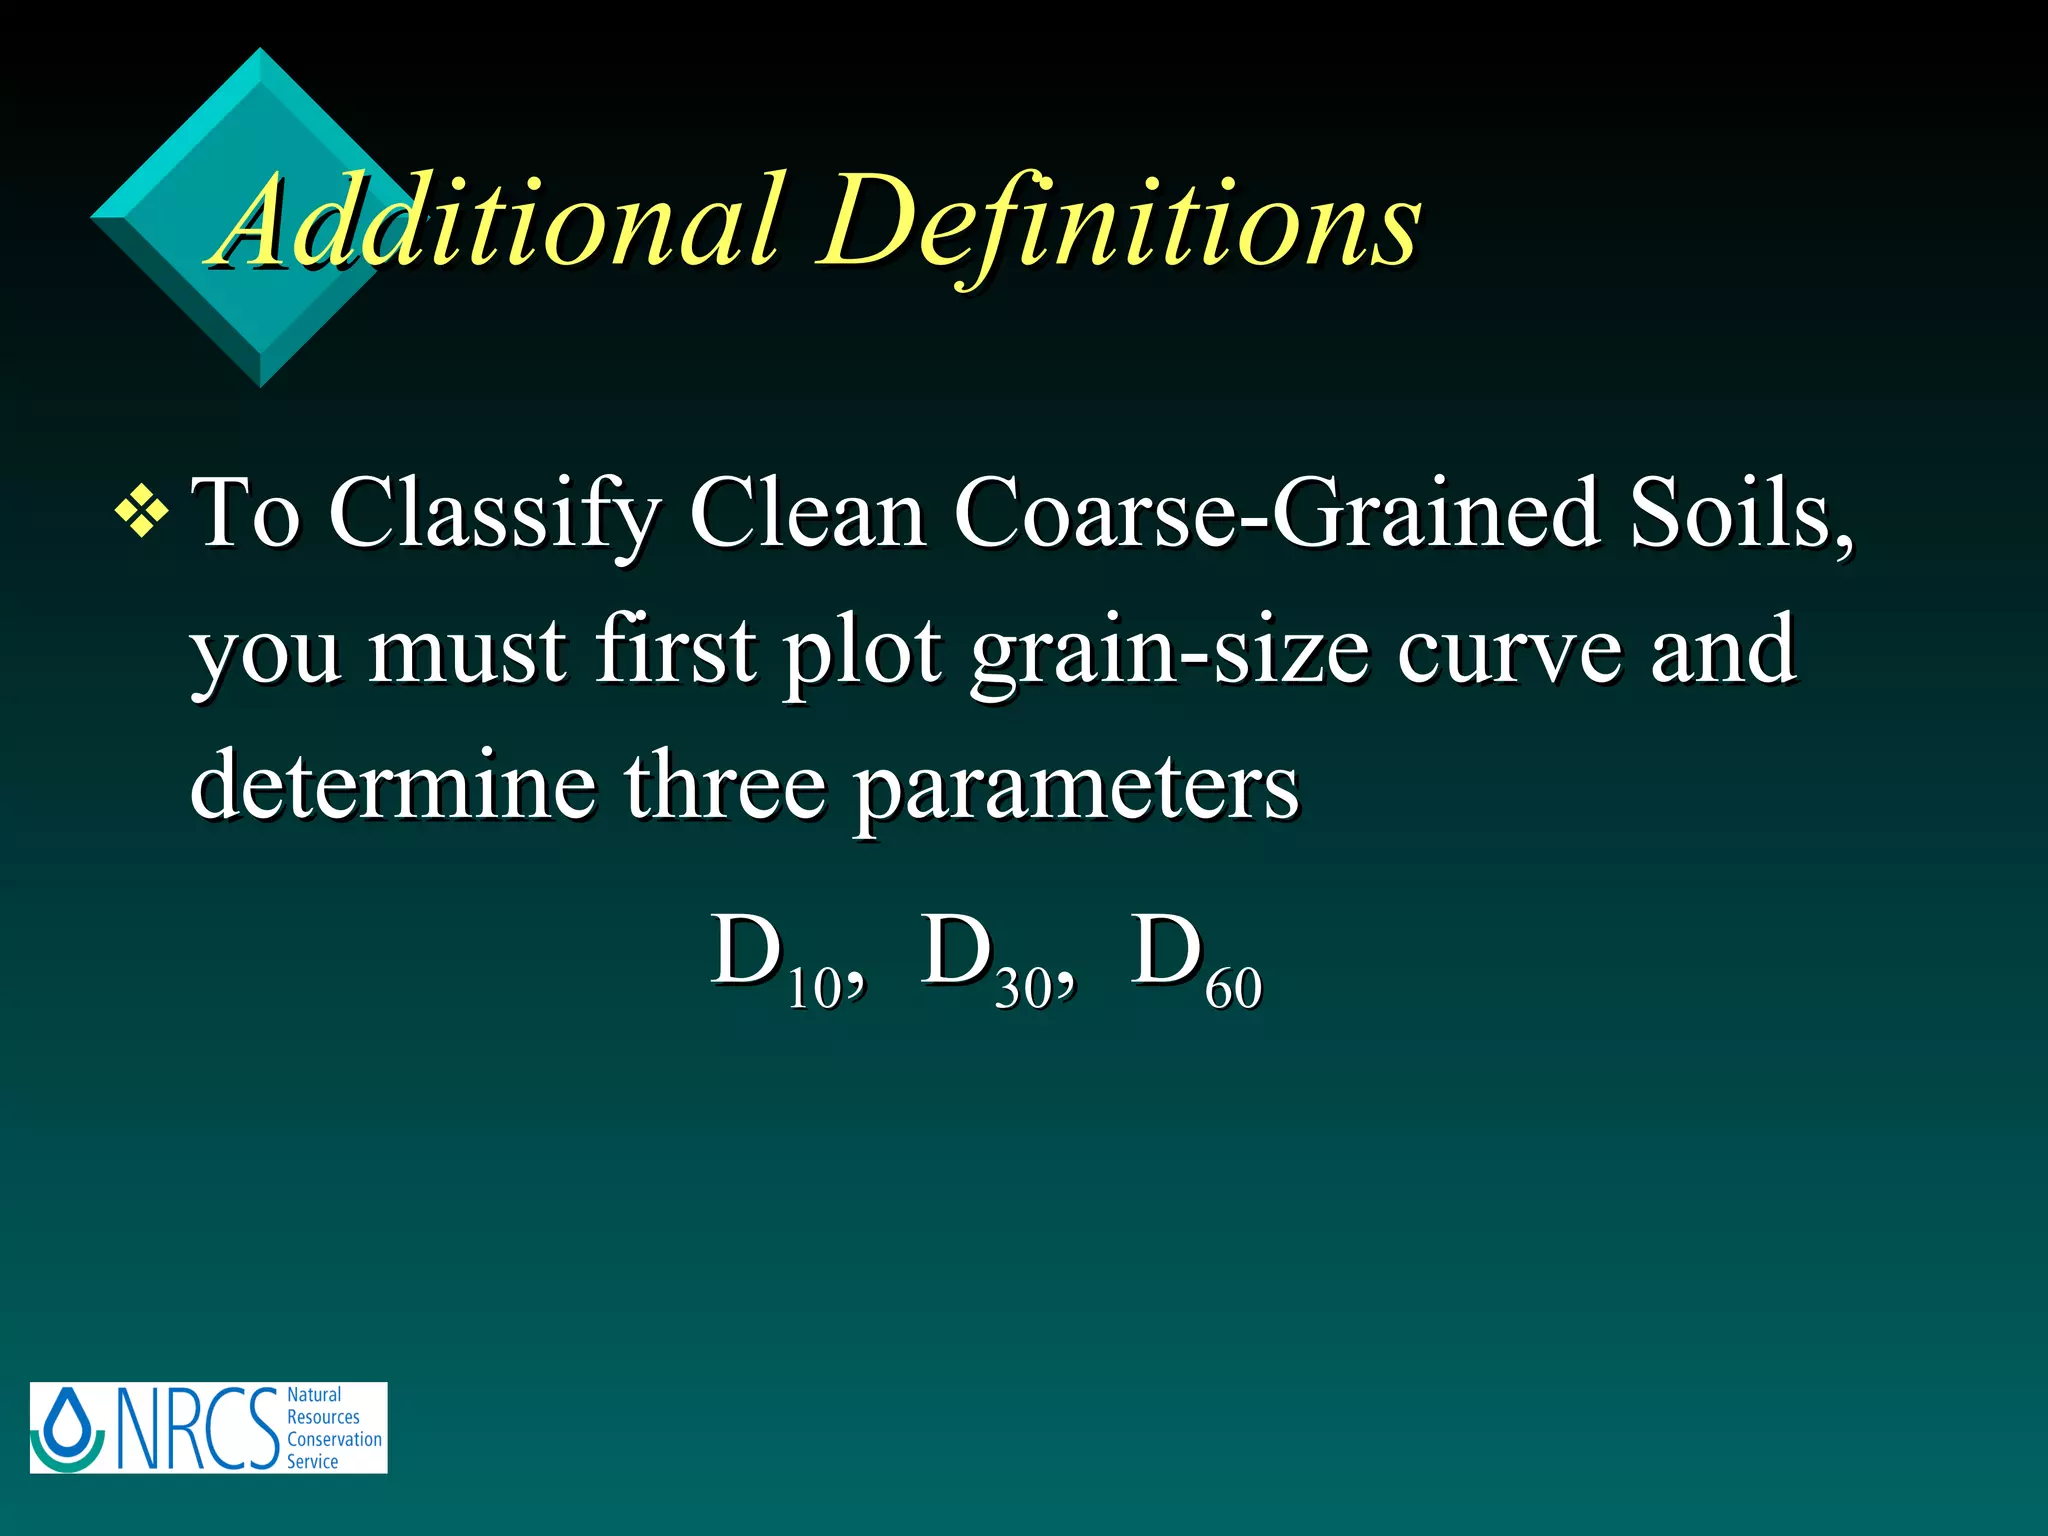
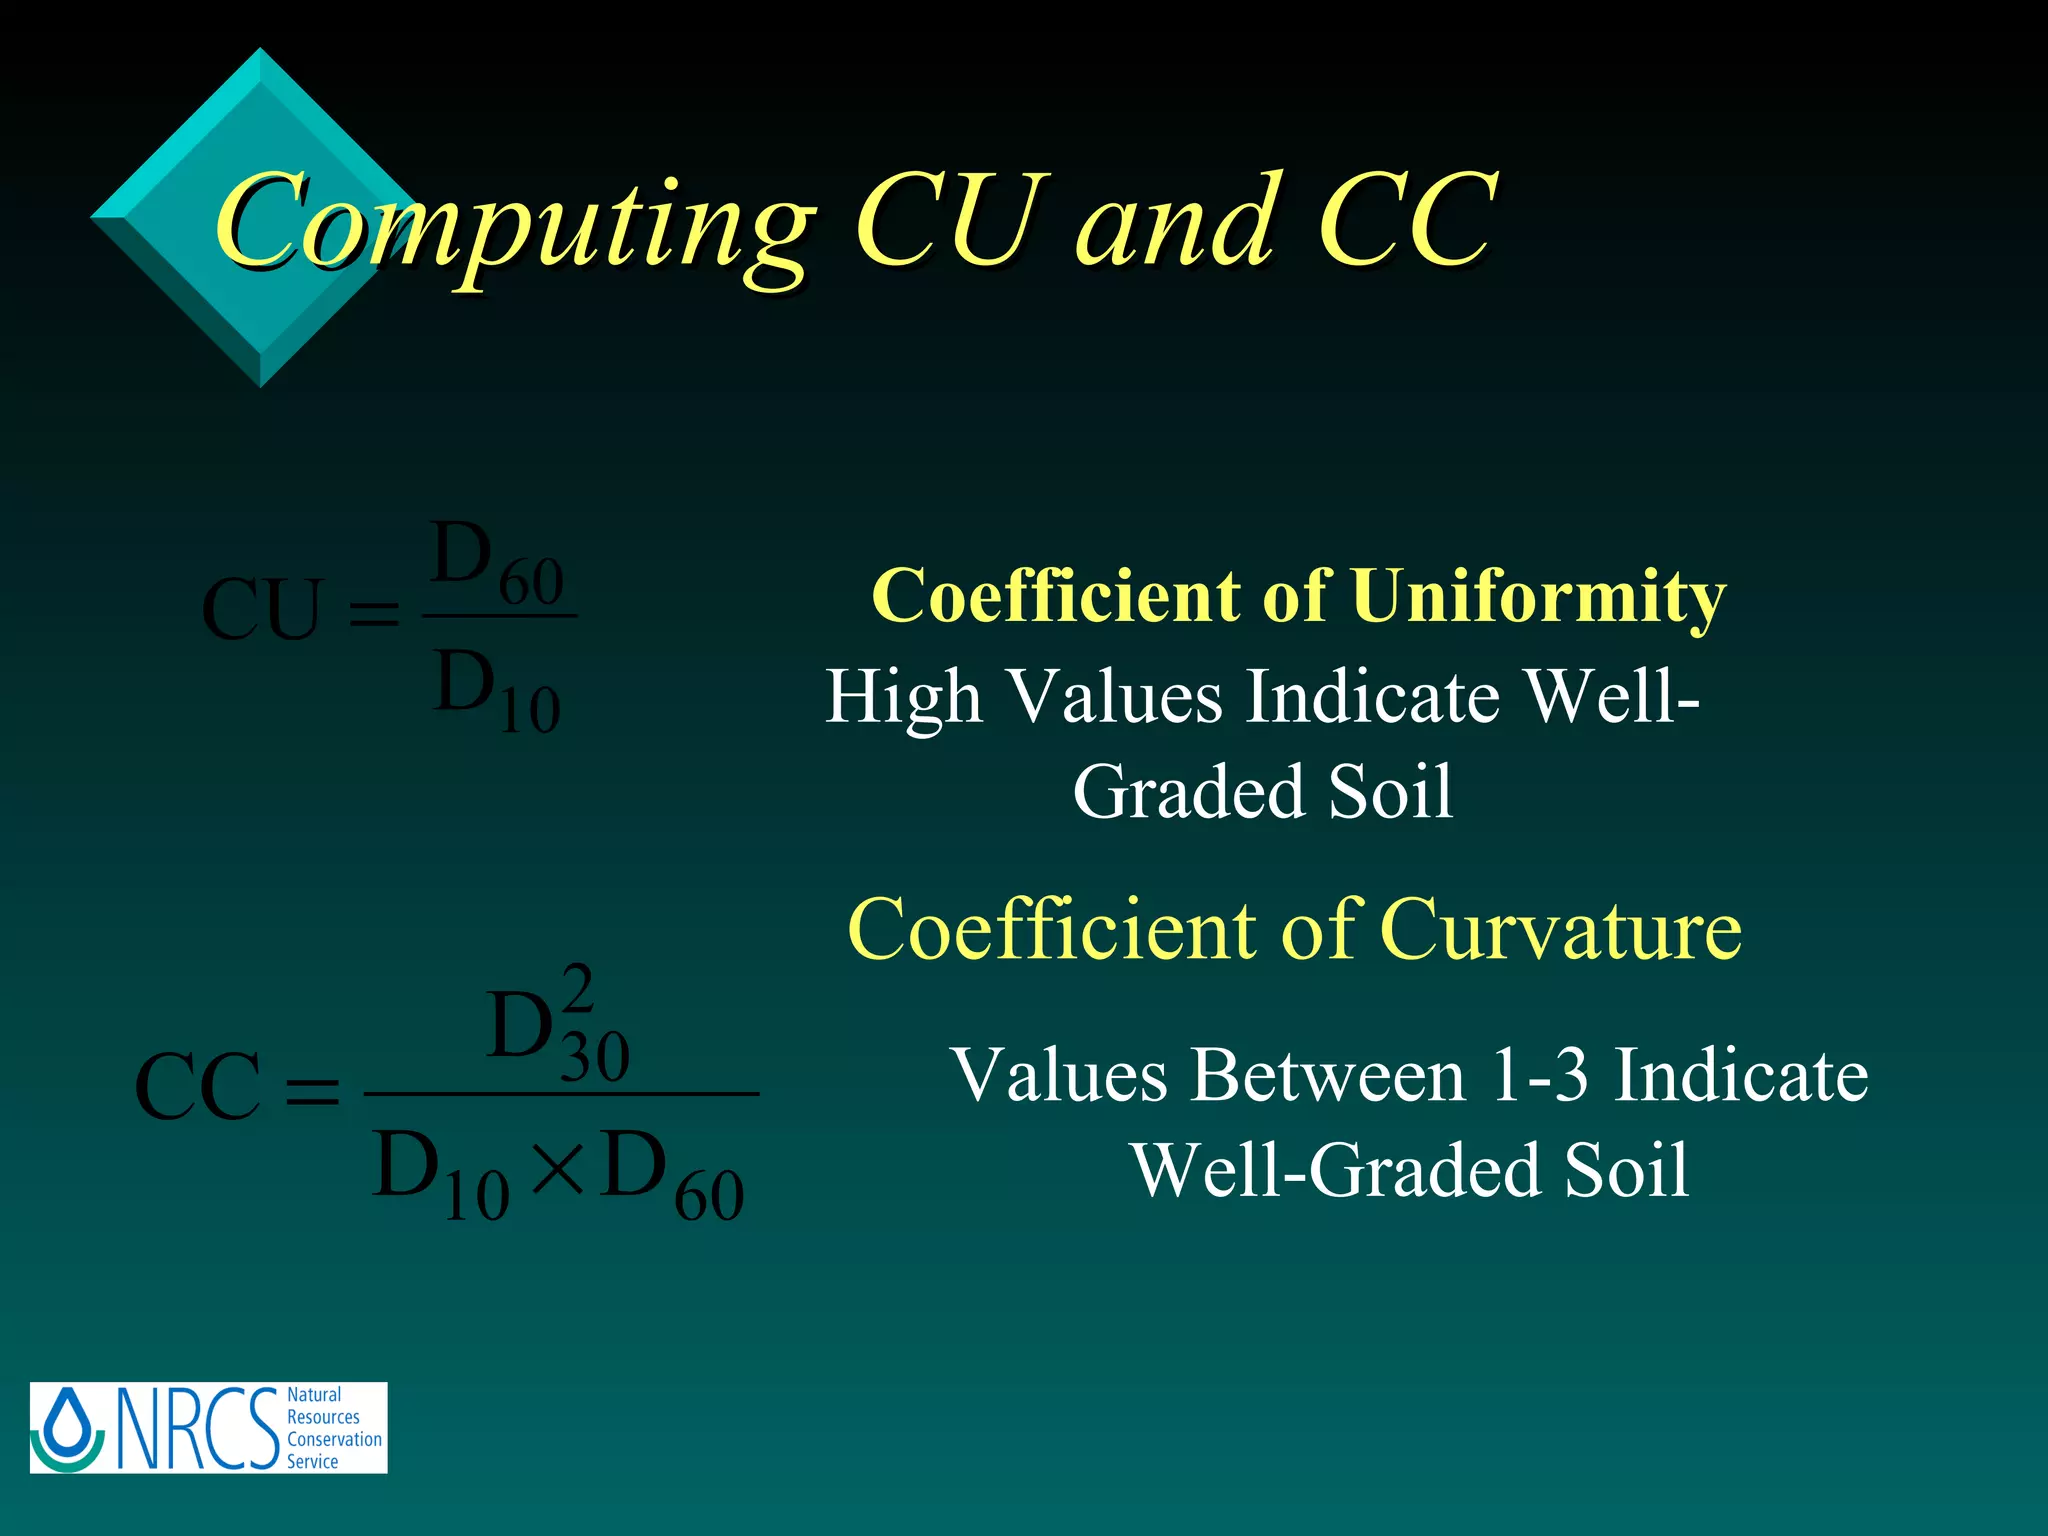
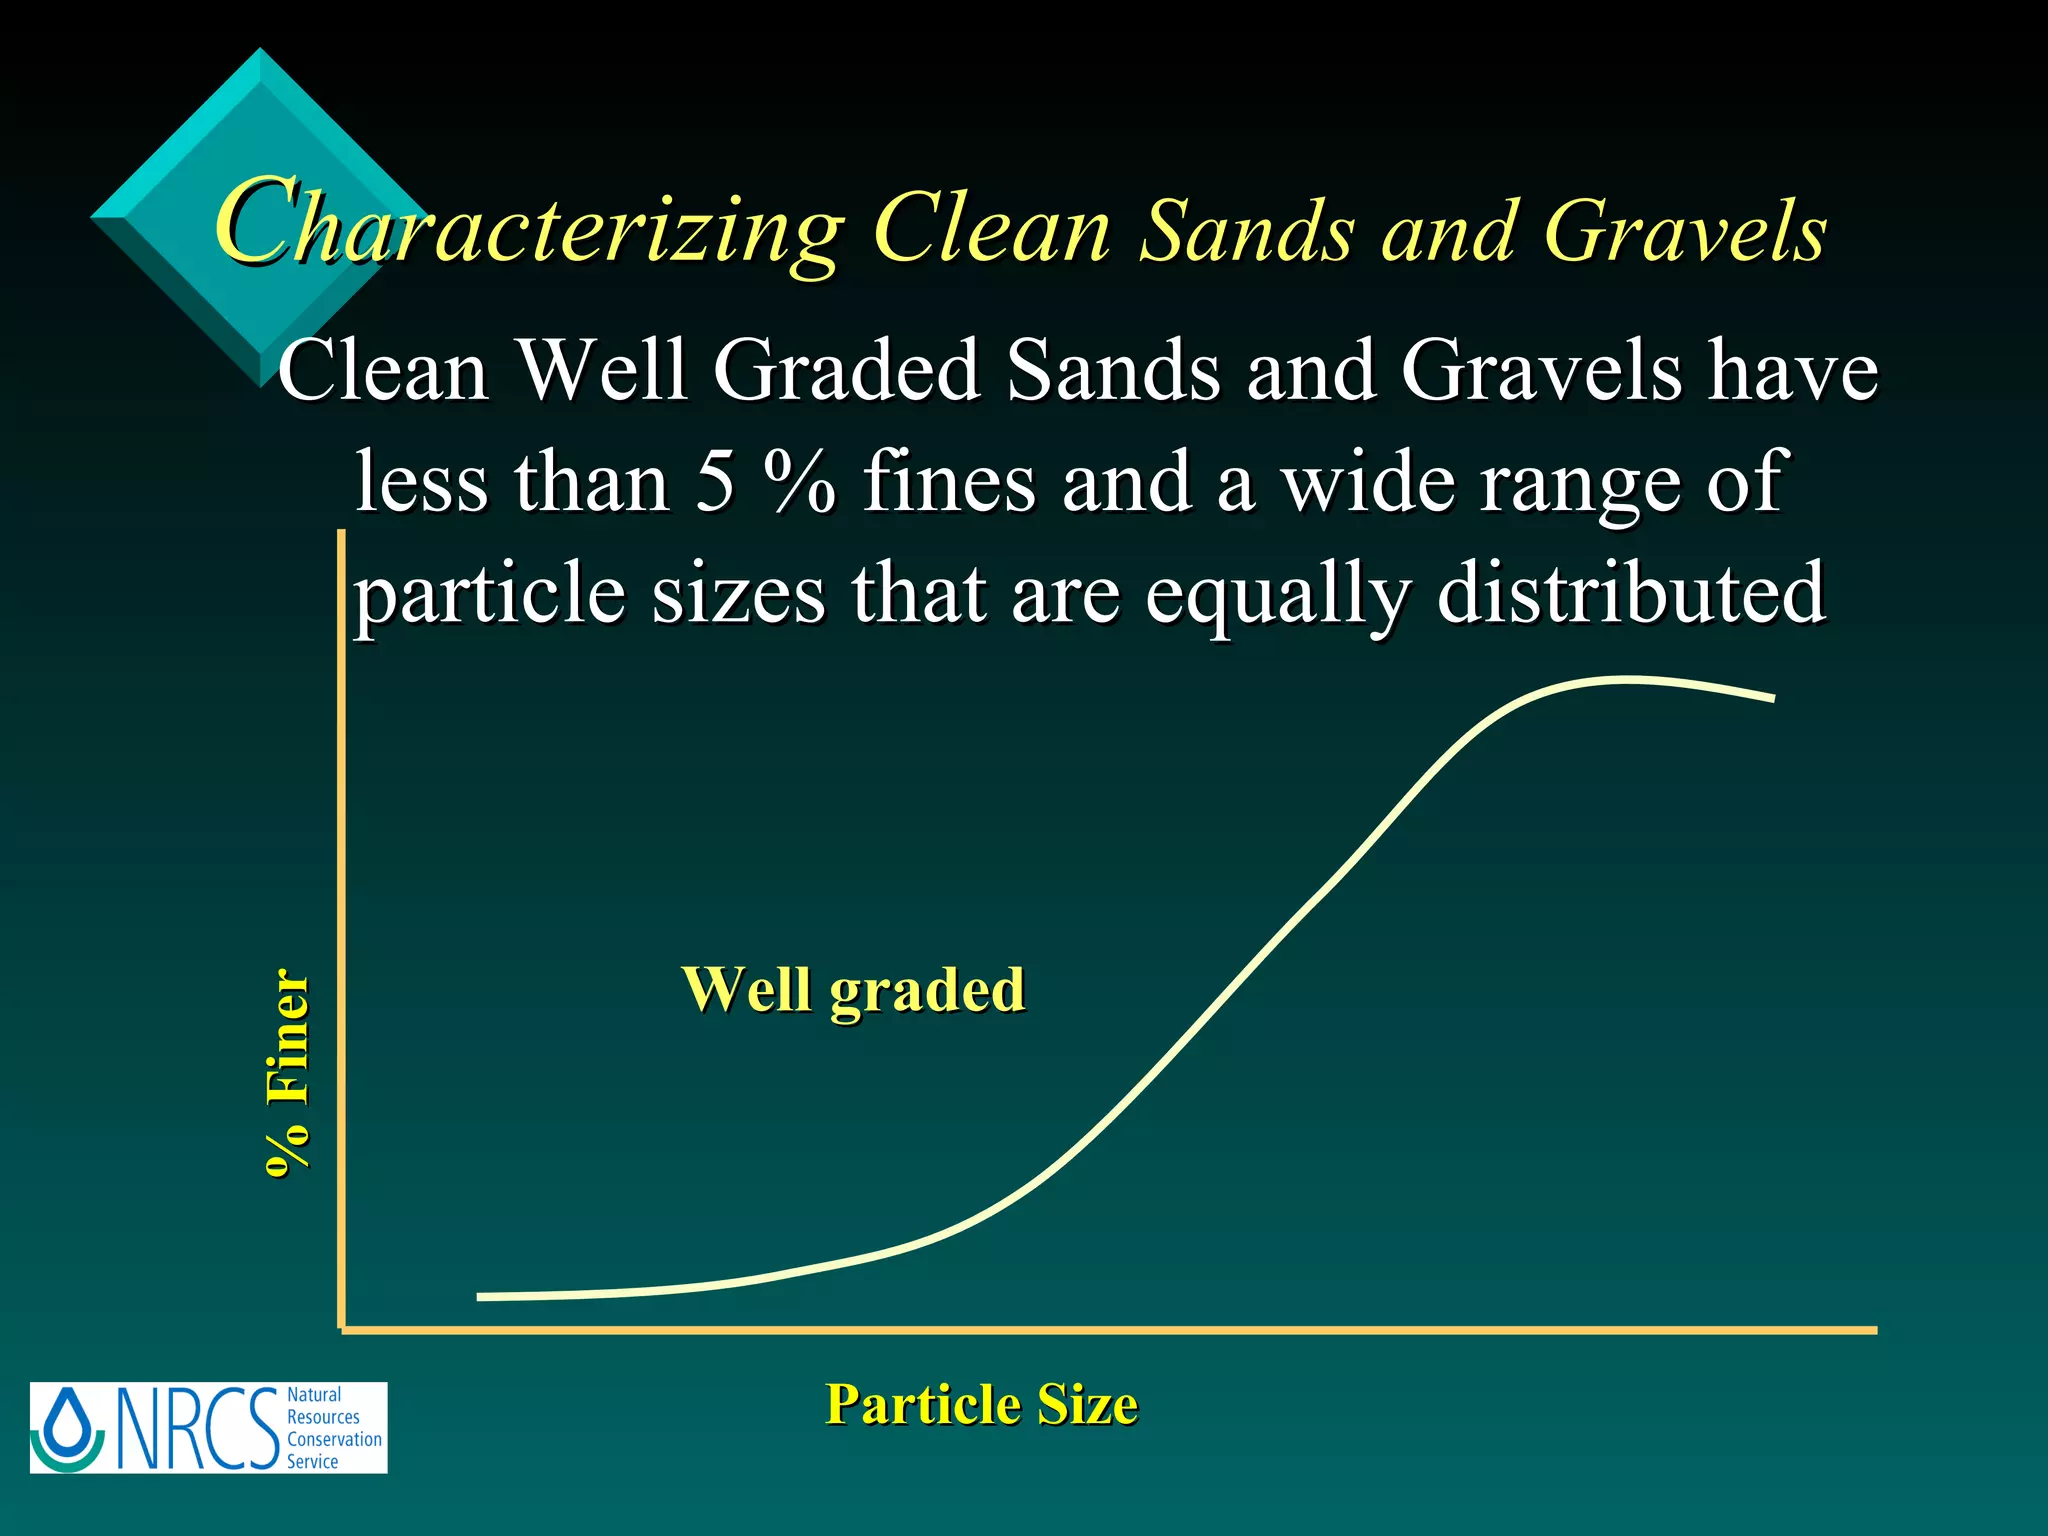
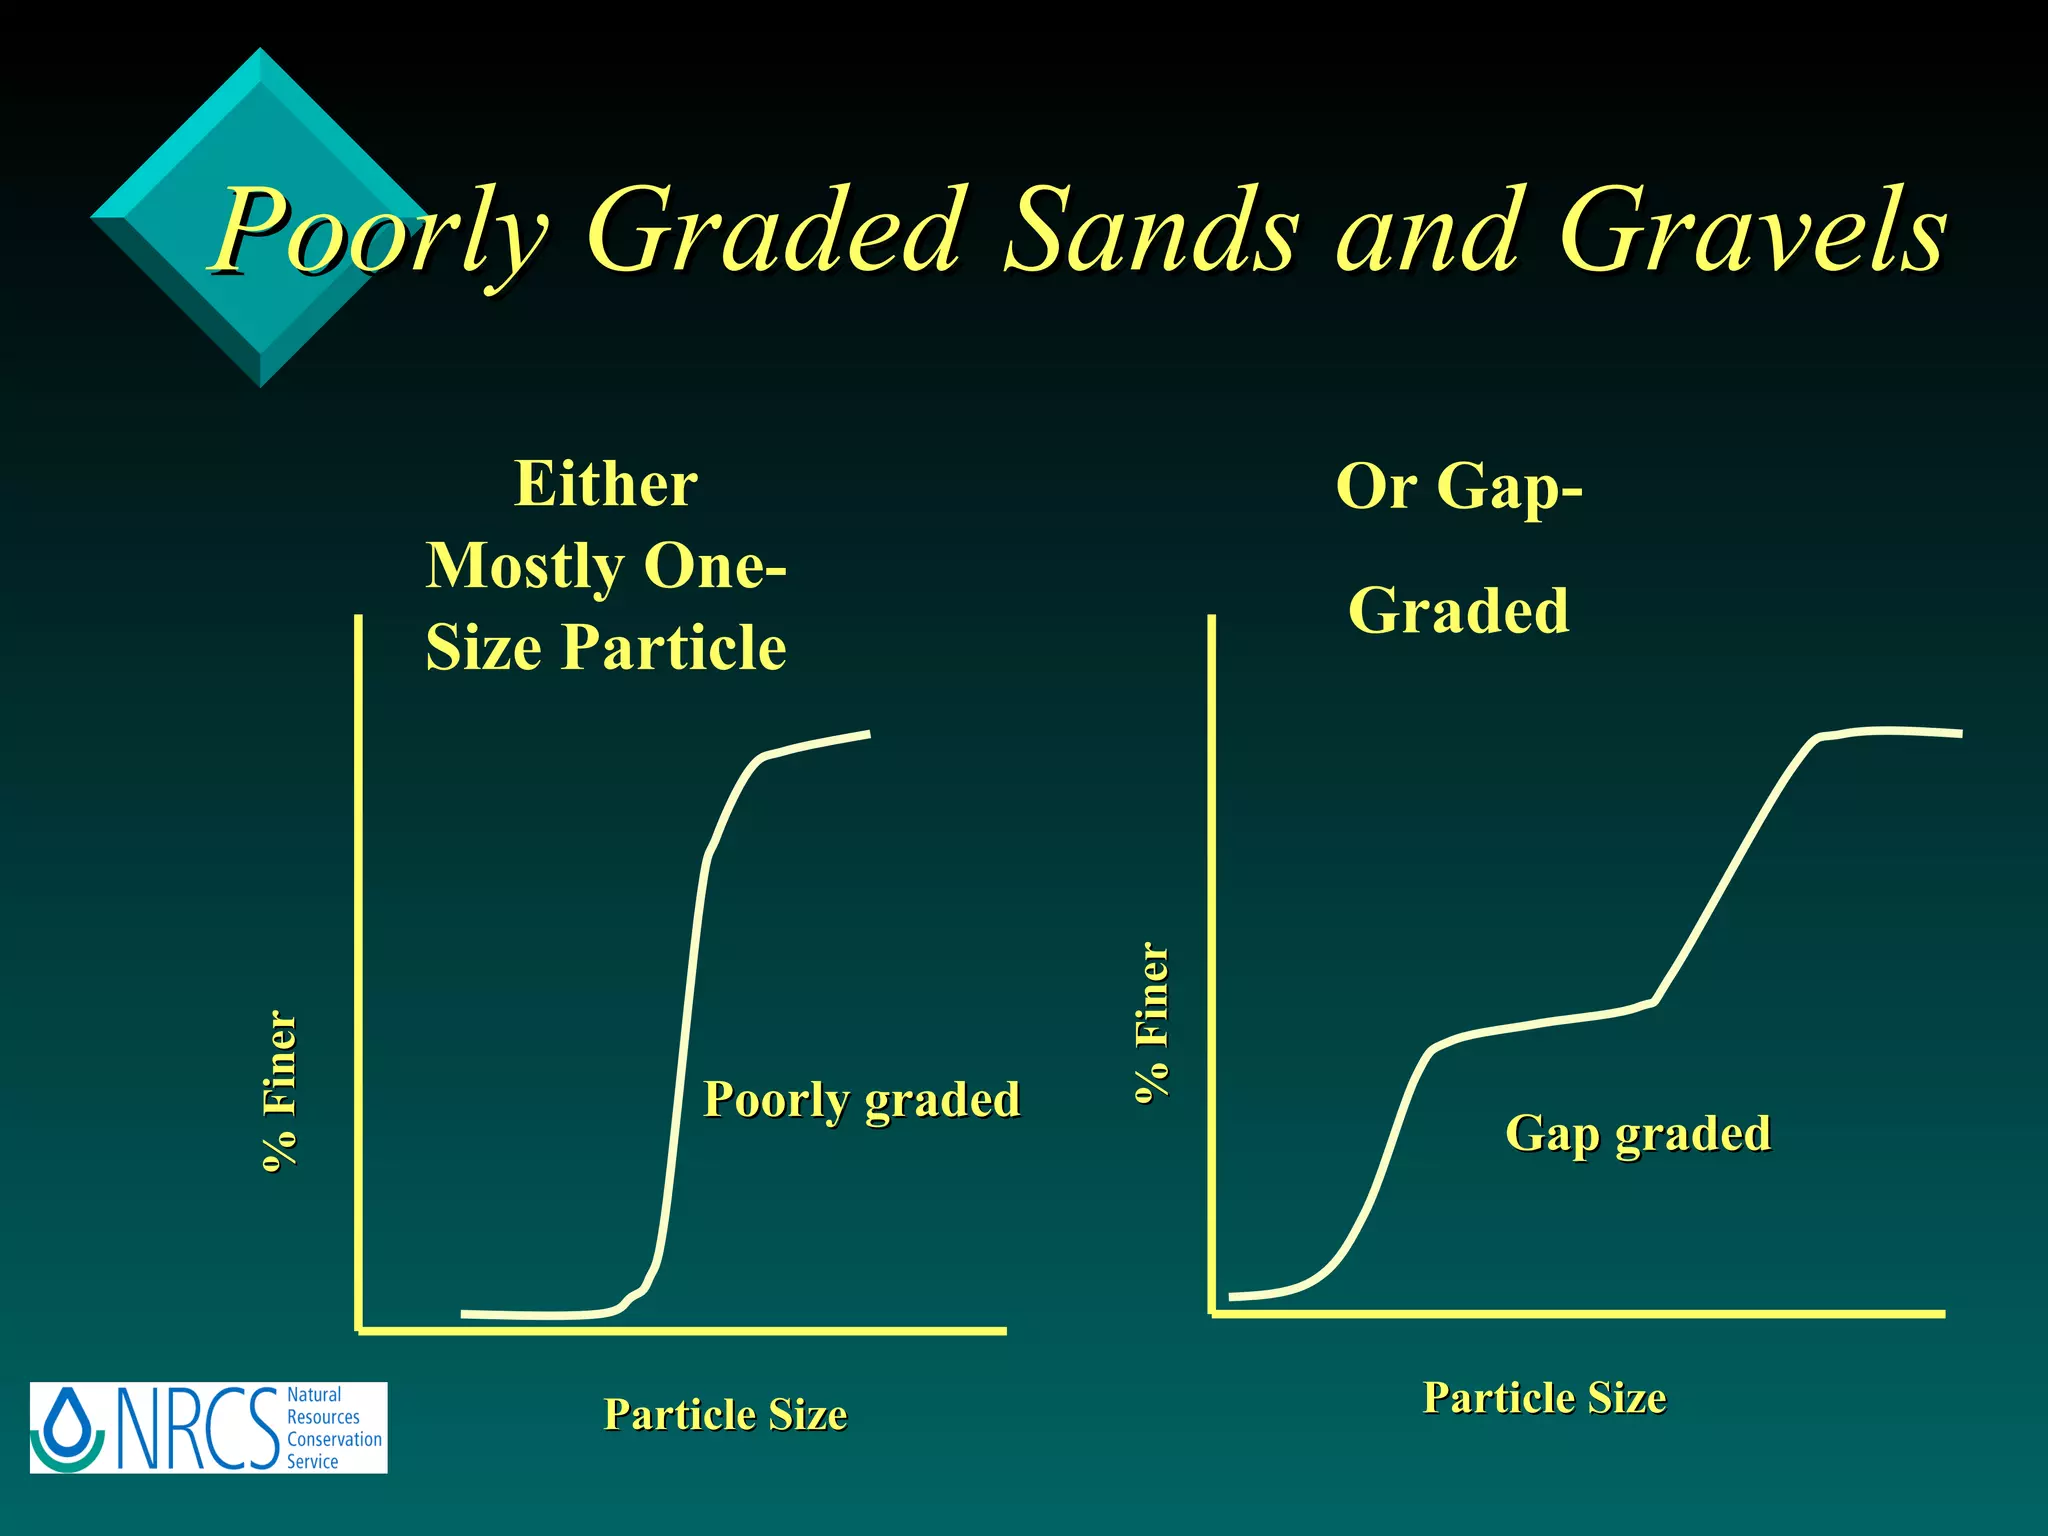
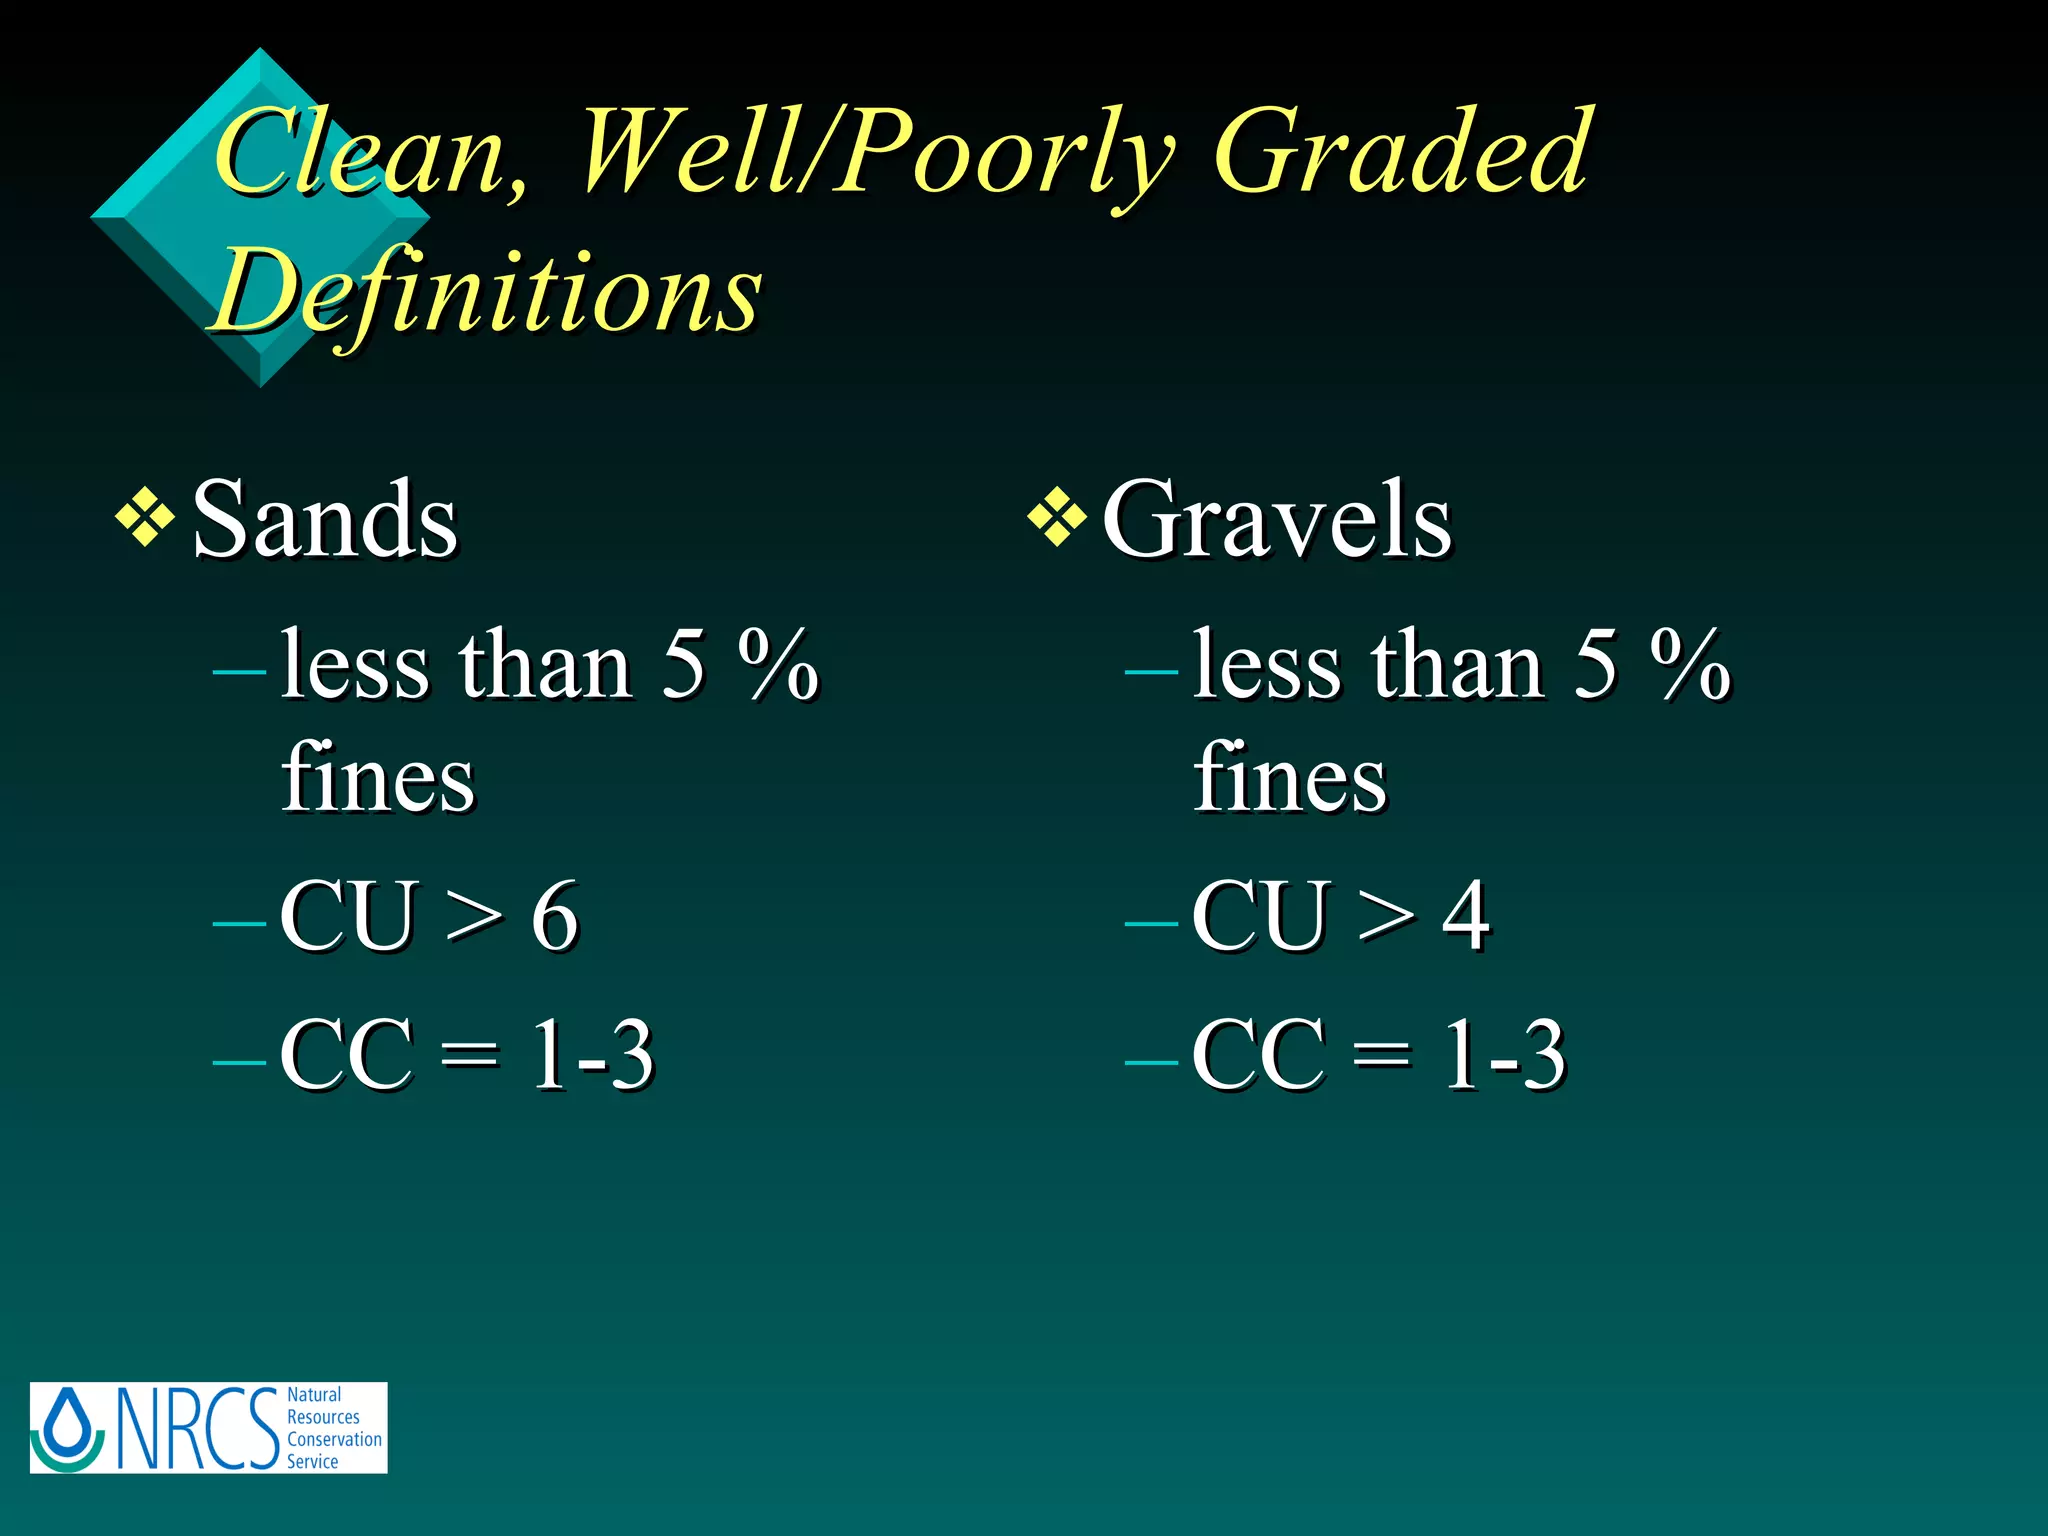
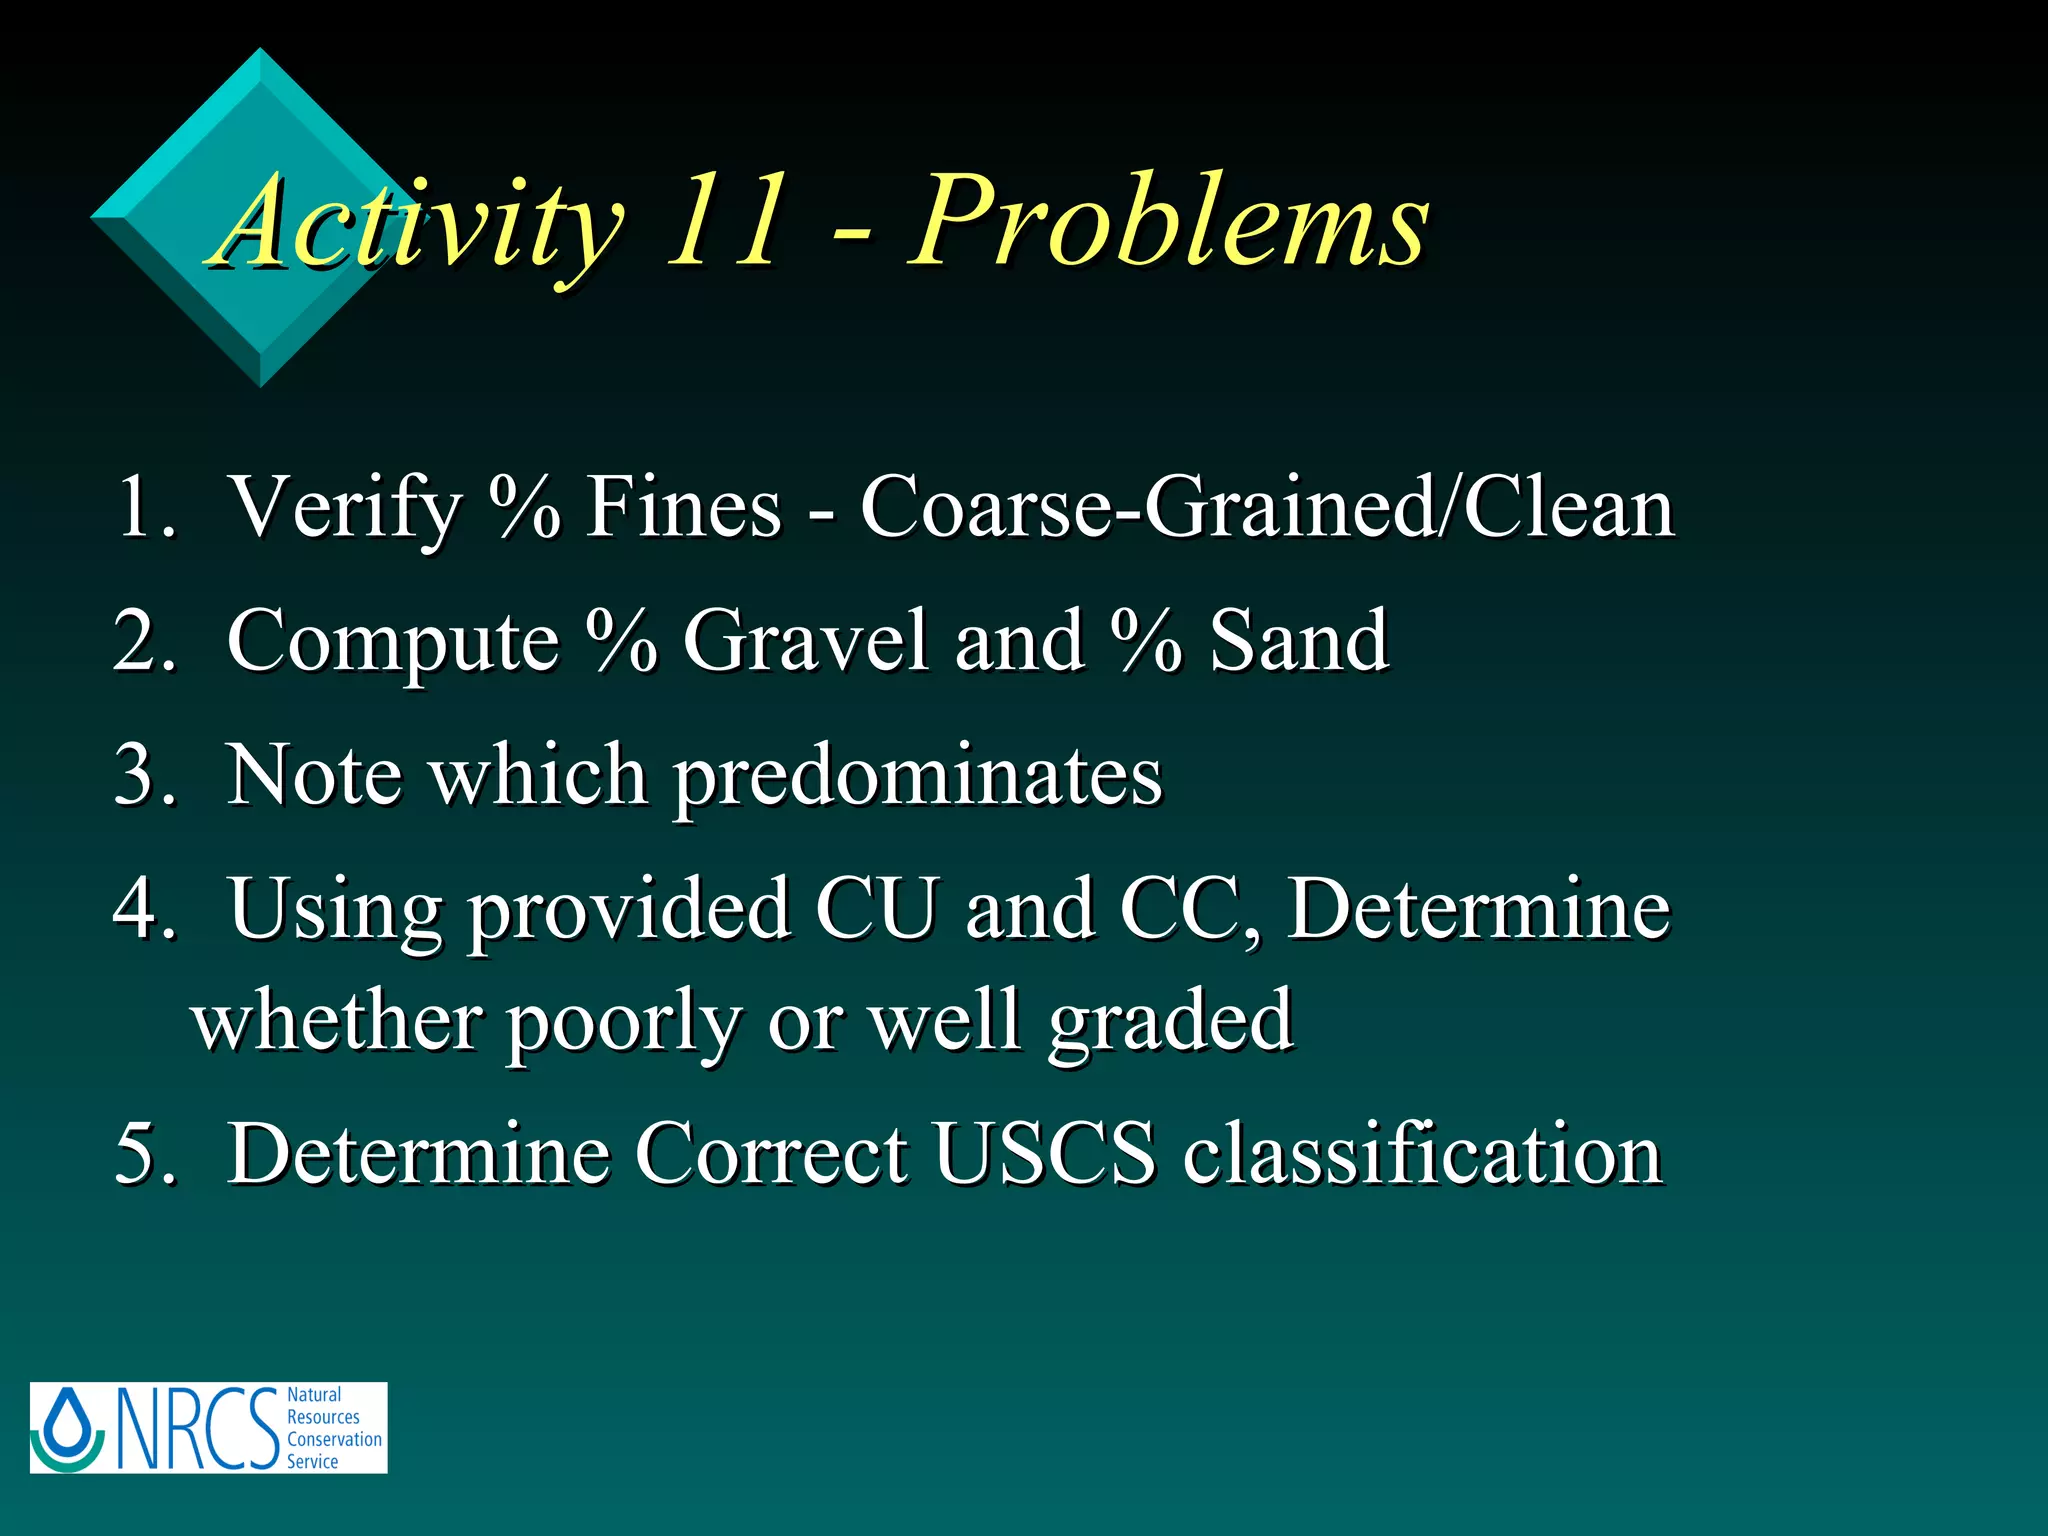
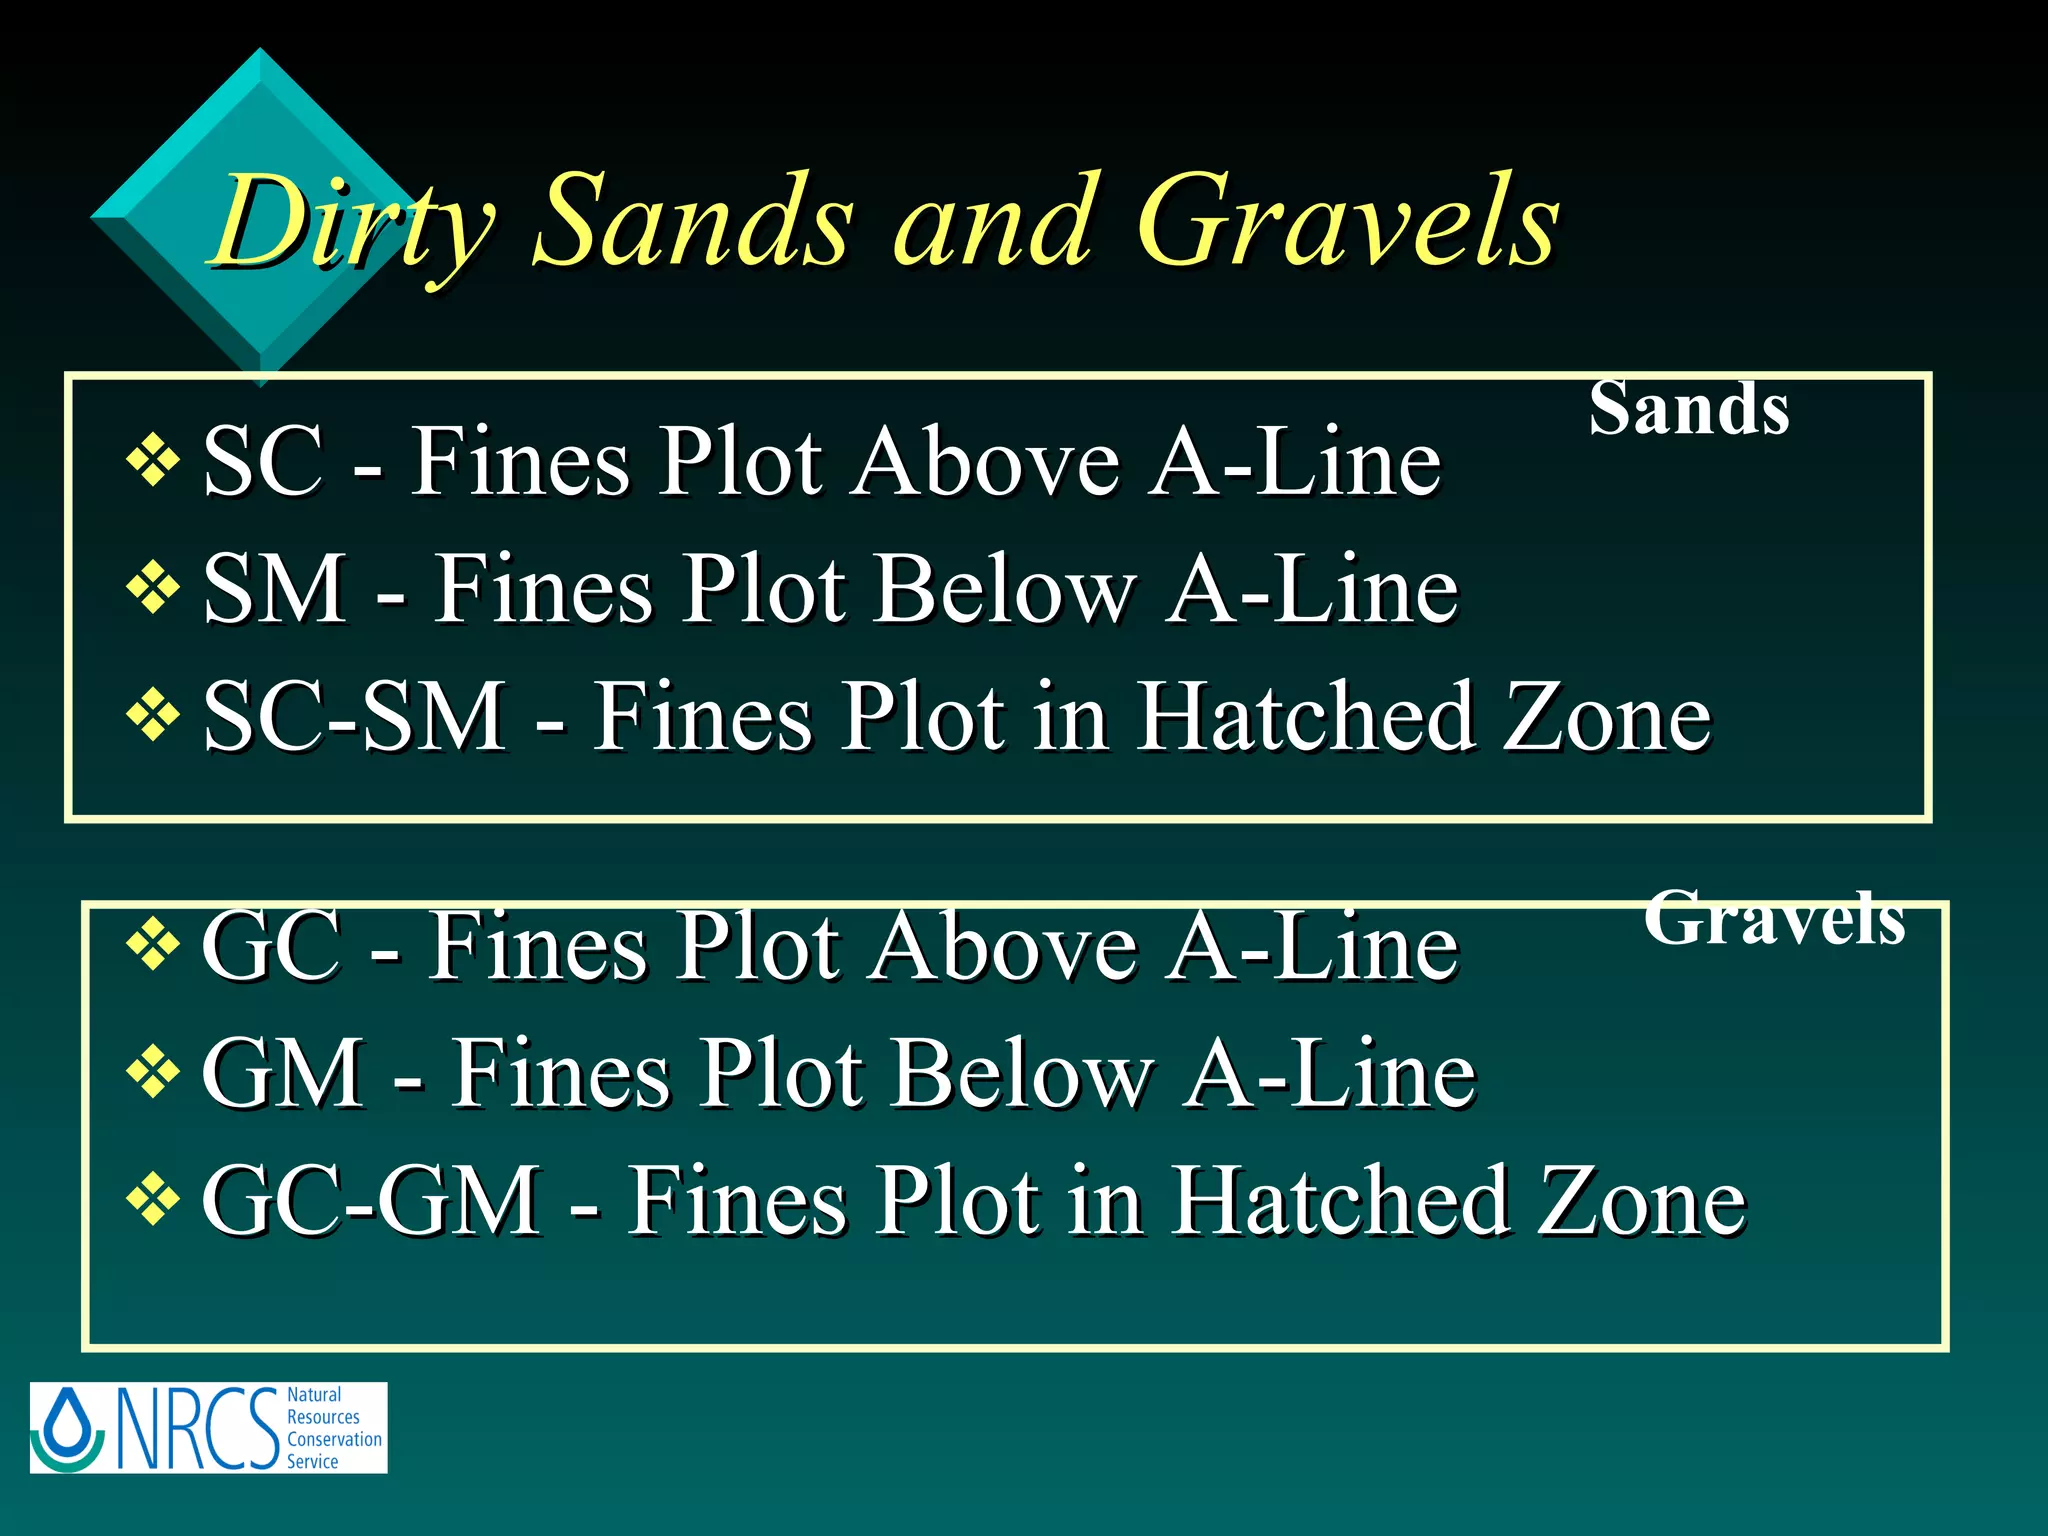
Unified Soil Classification System Training Part B - USCS using Laboratory Data
Comparison of Particle Size Definitions # 200 USDA cobbles sand clay gravel 3” 2   .05 mm # 4 silt USCS cobbles sand fines gravel .074 mm # 4 3”
ASTM Standards Lab Data Classification is by ASTM D2487  Classification of Peat Samples, see ASTM D 4427 Field Classification is by D2488
Comparison of Particle Size Definitions
Activity 2  - Particle Size Comparisons
USCS Flow Chart - Activity 3
Flow Chart Overview Two Broad Categories Fine-Grained - 50% or more finer than the  # 200 sieve Coarse-Grained - Less than 50% finer than the # 200 sieve
USCS Overview
Flow Chart Overview Fine-Grained Soils Organic ( LL ratio < 0.75 ) Inorganic (no odor and LL ratio not < 0.75) Classify by LL, PI Modifiers are H or L for LL value, C or M for plasticity and O for organic
USCS Overview
Activity 4 - Organic Soil  Solve 4 samples
Abbreviations Fine-Grained H - High LL (  >  50 )  L - Low LL ( < 50 )  C - Plastic Fines M - Nonplastic or slightly plastic fines O - Organic Pt - Peat
Activity 5 - Plasticity Chart
Activity 5 - Plasticity Chart  Solve 4 samples
Activity 7 - Classify Fine-Grained Samples  Assume 6 samples are  not organic  and classify by USCS
Flow Chart Overview Coarse-Grained Soils - 3 Groups Clean - Less than 5 % Fines Dirty - More than 12 % Fines Dual - From 5% to 12% Fines, inclusive
Coarse-grained Soils
Abbreviations Sands and Gravels G - Gravel S - Sand P - Poorly Graded W - Well Graded
Sieve Analyses % fines = % finer than  # 200 sieve % sand = % finer # 4 minus % finer # 200 % gravel = % finer 3”minus % finer # 4
Percent Particle Categories To compute % Gravel subtract % finer than # 4 from % finer than 3” To compute % Sand subtract % finer than # 200 from % finer than # 4 Percent Fines is % finer than # 200
Activity 8 For 7 samples, fill out Activity
Additional Definitions To Classify Clean Coarse-Grained Soils, you must first plot grain-size curve and determine three parameters D 10 ,  D 30 ,  D 60
Determining D 10 , D 30 , and D 60 D 10 , millimeters 10 % finer D 30 , millimeters 30 D 60 , millimeters 60
Computing CU and CC Coefficient of Uniformity Coefficient of Curvature High Values Indicate Well-Graded Soil Values Between 1-3 Indicate Well-Graded Soil
Activity 9 Plot Curve from Data, compute CU Value
Activity 10 Plot Curve from Data, compute CC Value
C haracterizing Clean  Sands and Gravels Clean Well Graded Sands and Gravels have less than 5 % fines and a wide range of particle sizes that are equally distributed Particle Size % Finer Well graded
Poorly Graded   Sands and Gravels Poorly graded % Finer Particle Size Either Mostly One-Size Particle Gap graded Particle Size % Finer Or Gap- Graded
Clean, Well/Poorly Graded Definitions Sands less than 5 % fines CU > 6 CC = 1-3 Gravels less than 5 % fines  CU > 4 CC = 1-3
Activity 11 - Problems 1.  Verify % Fines - Coarse-Grained/Clean 2.  Compute % Gravel and % Sand 3.  Note which predominates 4.  Using provided CU and CC, Determine whether poorly or well graded 5.  Determine Correct USCS classification
Activity 12 Review Example Soil
Activity 13 Use Flow Chart, Classify Soil
Activity 14 Summary of Classifications of Coarse-Grained Soils Clean Sands and Gravels (< 5% fines) Clean Poorly Graded Gravels GP Clean Well Graded Gravels GW Clean Poorly Graded Sands SP Clean Well Graded Sands SW
Dirty Coarse-Grained Soils If a sample has less than 50 % Fines And it has more than 12 % Fines, it is a Dirty Coarse-Grained Soil To Classify, follow the flow chart and the following steps
Dirty Coarse-Grained Soil Determine whether there is a greater % of Sand or Gravel % G = % finer 3” minus # 4 % S = % finer # 4 minus # 200 Determine where minus # 40 fines plot on plasticity chart
Dirty Sands and Gravels SC - Fines Plot Above A-Line SM - Fines Plot Below A-Line SC-SM - Fines Plot in Hatched Zone GC - Fines Plot Above A-Line GM - Fines Plot Below A-Line GC-GM - Fines Plot in Hatched Zone Sands Gravels
Activity 16 - Problems
Activity 17 - Example of Classifying Dual-Classification Coarse-Grained Soil
Activity 18 - Problem
Activity 20 - Review Questions
Activity 21 - Comprehensive Problems

Unified training-part-b

  • 1.
    Unified Soil ClassificationSystem Training Part B - USCS using Laboratory Data
  • 2.
    Comparison of ParticleSize Definitions # 200 USDA cobbles sand clay gravel 3” 2  .05 mm # 4 silt USCS cobbles sand fines gravel .074 mm # 4 3”
  • 3.
    ASTM Standards LabData Classification is by ASTM D2487 Classification of Peat Samples, see ASTM D 4427 Field Classification is by D2488
  • 4.
    Comparison of ParticleSize Definitions
  • 5.
    Activity 2 - Particle Size Comparisons
  • 6.
    USCS Flow Chart- Activity 3
  • 7.
    Flow Chart OverviewTwo Broad Categories Fine-Grained - 50% or more finer than the # 200 sieve Coarse-Grained - Less than 50% finer than the # 200 sieve
  • 8.
  • 9.
    Flow Chart OverviewFine-Grained Soils Organic ( LL ratio < 0.75 ) Inorganic (no odor and LL ratio not < 0.75) Classify by LL, PI Modifiers are H or L for LL value, C or M for plasticity and O for organic
  • 10.
  • 11.
    Activity 4 -Organic Soil Solve 4 samples
  • 12.
    Abbreviations Fine-Grained H- High LL ( > 50 ) L - Low LL ( < 50 ) C - Plastic Fines M - Nonplastic or slightly plastic fines O - Organic Pt - Peat
  • 13.
    Activity 5 -Plasticity Chart
  • 14.
    Activity 5 -Plasticity Chart Solve 4 samples
  • 15.
    Activity 7 -Classify Fine-Grained Samples Assume 6 samples are not organic and classify by USCS
  • 16.
    Flow Chart OverviewCoarse-Grained Soils - 3 Groups Clean - Less than 5 % Fines Dirty - More than 12 % Fines Dual - From 5% to 12% Fines, inclusive
  • 17.
  • 18.
    Abbreviations Sands andGravels G - Gravel S - Sand P - Poorly Graded W - Well Graded
  • 19.
    Sieve Analyses %fines = % finer than # 200 sieve % sand = % finer # 4 minus % finer # 200 % gravel = % finer 3”minus % finer # 4
  • 20.
    Percent Particle CategoriesTo compute % Gravel subtract % finer than # 4 from % finer than 3” To compute % Sand subtract % finer than # 200 from % finer than # 4 Percent Fines is % finer than # 200
  • 21.
    Activity 8 For7 samples, fill out Activity
  • 22.
    Additional Definitions ToClassify Clean Coarse-Grained Soils, you must first plot grain-size curve and determine three parameters D 10 , D 30 , D 60
  • 23.
    Determining D 10, D 30 , and D 60 D 10 , millimeters 10 % finer D 30 , millimeters 30 D 60 , millimeters 60
  • 24.
    Computing CU andCC Coefficient of Uniformity Coefficient of Curvature High Values Indicate Well-Graded Soil Values Between 1-3 Indicate Well-Graded Soil
  • 25.
    Activity 9 PlotCurve from Data, compute CU Value
  • 26.
    Activity 10 PlotCurve from Data, compute CC Value
  • 27.
    C haracterizing Clean Sands and Gravels Clean Well Graded Sands and Gravels have less than 5 % fines and a wide range of particle sizes that are equally distributed Particle Size % Finer Well graded
  • 28.
    Poorly Graded Sands and Gravels Poorly graded % Finer Particle Size Either Mostly One-Size Particle Gap graded Particle Size % Finer Or Gap- Graded
  • 29.
    Clean, Well/Poorly GradedDefinitions Sands less than 5 % fines CU > 6 CC = 1-3 Gravels less than 5 % fines CU > 4 CC = 1-3
  • 30.
    Activity 11 -Problems 1. Verify % Fines - Coarse-Grained/Clean 2. Compute % Gravel and % Sand 3. Note which predominates 4. Using provided CU and CC, Determine whether poorly or well graded 5. Determine Correct USCS classification
  • 31.
    Activity 12 ReviewExample Soil
  • 32.
    Activity 13 UseFlow Chart, Classify Soil
  • 33.
    Activity 14 Summaryof Classifications of Coarse-Grained Soils Clean Sands and Gravels (< 5% fines) Clean Poorly Graded Gravels GP Clean Well Graded Gravels GW Clean Poorly Graded Sands SP Clean Well Graded Sands SW
  • 34.
    Dirty Coarse-Grained SoilsIf a sample has less than 50 % Fines And it has more than 12 % Fines, it is a Dirty Coarse-Grained Soil To Classify, follow the flow chart and the following steps
  • 35.
    Dirty Coarse-Grained SoilDetermine whether there is a greater % of Sand or Gravel % G = % finer 3” minus # 4 % S = % finer # 4 minus # 200 Determine where minus # 40 fines plot on plasticity chart
  • 36.
    Dirty Sands andGravels SC - Fines Plot Above A-Line SM - Fines Plot Below A-Line SC-SM - Fines Plot in Hatched Zone GC - Fines Plot Above A-Line GM - Fines Plot Below A-Line GC-GM - Fines Plot in Hatched Zone Sands Gravels
  • 37.
    Activity 16 -Problems
  • 38.
    Activity 17 -Example of Classifying Dual-Classification Coarse-Grained Soil
  • 39.
  • 40.
    Activity 20 -Review Questions
  • 41.
    Activity 21 -Comprehensive Problems