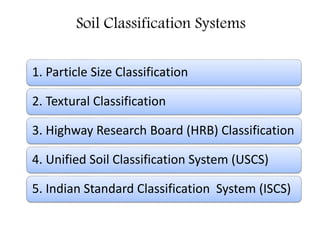
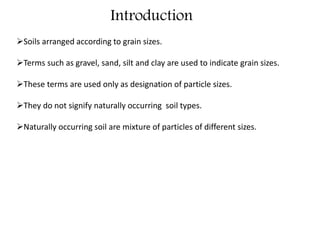
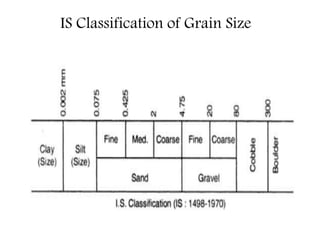
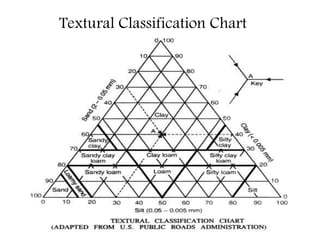
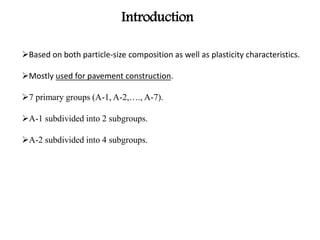
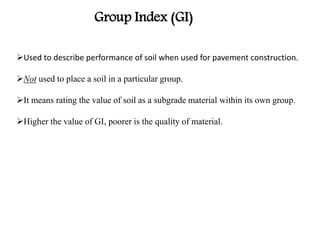
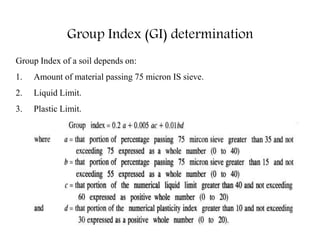
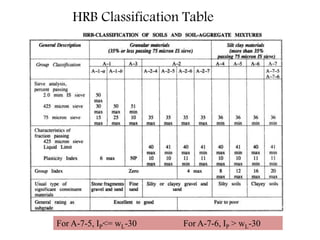
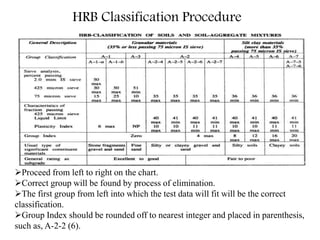
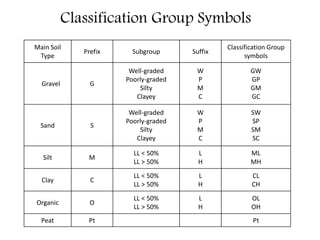
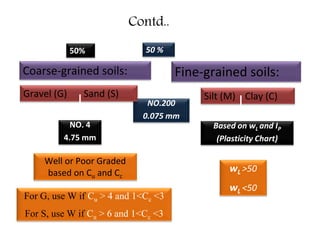
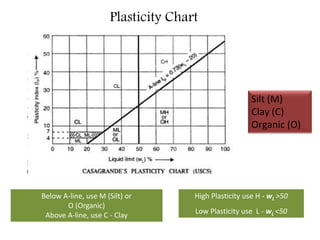
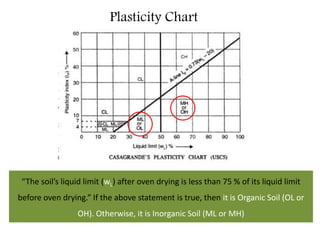
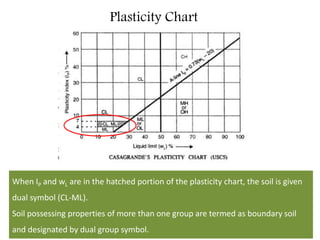
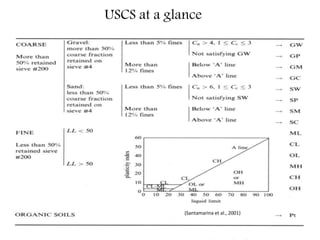
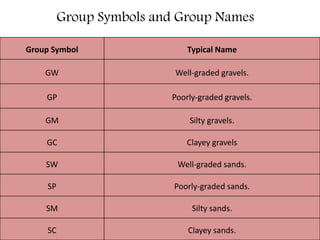
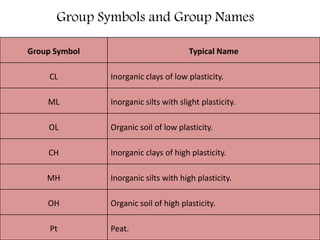
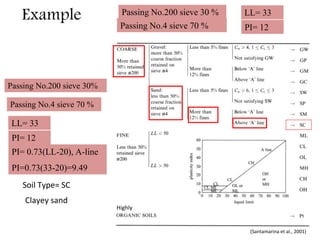
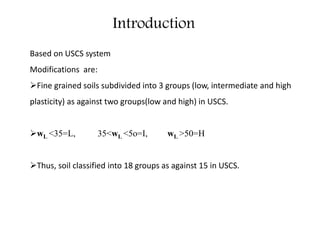
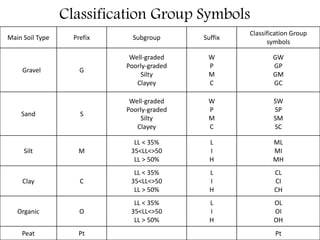
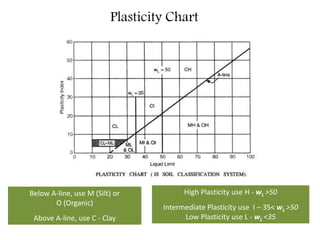
Geotechnical Engineering
(RCE-501)
3RD YEAR (5th Semester)
CIVIL ENGINEERING DEPARTMENT
I. T. S ENGINEERING COLLEGE, GR. NOIDA
By
Aungkar Bhagat
Soil Classification Systems
1. Particle Size Classification
2. Textural Classification
3. Highway Research Board (HRB) Classification
4. Unified Soil Classification System (USCS)
5. Indian Standard Classification System (ISCS)
Particle Size Classification
Soils arranged according to grain sizes.
Terms such as gravel, sand, silt and clay are used to indicate grain sizes.
These terms are used only as designation of particle sizes.
They do not signify naturally occurring soil types.
Naturally occurring soil are mixture of particles of different sizes.
Introduction
IS Classification of Grain Size
Textural Classification
Soil classification of composite soils exclusively based on Particle Size
Distribution.
Most popular is the Triangular Classification of U.S. Public Roads
Administration.
Classification based on % of sand, silt and clay size.
More suitable for describing coarse grained soil.
Clay soil properties are less dependent on particle size distribution.
Introduction
Textural Classification Chart
Example
30% sand
30% silt
40% clay
Soil Type
Clay
Highway Research Board (HRB)
Classification
Based on both particle-size composition as well as plasticity characteristics.
Mostly used for pavement construction.
7 primary groups (A-1, A-2,…., A-7).
A-1 subdivided into 2 subgroups.
A-2 subdivided into 4 subgroups.
Introduction
Used to describe performance of soil when used for pavement construction.
Not used to place a soil in a particular group.
It means rating the value of soil as a subgrade material within its own group.
Higher the value of GI, poorer is the quality of material.
Group Index (GI)
Group Index of a soil depends on:
1. Amount of material passing 75 micron IS sieve.
2. Liquid Limit.
3. Plastic Limit.
Group Index (GI) determination
HRB Classification Table
For A-7-5, IP<= wL-30 For A-7-6, IP > wL-30
HRB Classification Procedure
Proceed from left to right on the chart.
Correct group will be found by process of elimination.
The first group from left into which the test data will fit will be the correct
classification.
Group Index should be rounded off to nearest integer and placed in parenthesis,
such as, A-2-2 (6).
Example
56% passes 75 micron sieve.
 Plastic Limit (wP) =23%
Liquid Limit (wL)=36%
Plasticity Index (IP) = 36-23=13%
Example
Passing 75 micron>35% IP < 40% wL>10%
A-6
wL=36%
IP =13%
Example
Group Index Calculation
a= 56-35=21
b=56-15=41, Take 40
56% passes 75 micron sieve.
 Plastic Limit (wP) =23%
Liquid Limit (wL)=36%
Plasticity Index (IP) =13%
c=0
d=13-10=3
GI=5.4=5 A-6 (5)
Unified Soil Classification System
USCS
Origin of USCS
 First developed by Professor A. Casagrande (1948)
for the purpose of airfield construction during
World War II.
 Afterwards, it was modified to enable the system
to be applicable to dams, foundations, and other
construction .
Four Major Divisions
Course
Grained
Fine
Grained
Organic
Soil
Peat
Classification Groups
•The soil is classified into 15 groups.
•Each group is designated a symbol consisting of two capital letters.
•The first letter is based on main soil type.
•The second letter is based on gradation and plasticity .
Classification Group Symbols
Main Soil
Type
Prefix Subgroup Suffix
Classification Group
symbols
Gravel G
Well-graded
Poorly-graded
Silty
Clayey
W
P
M
C
GW
GP
GM
GC
Sand S
Well-graded
Poorly-graded
Silty
Clayey
W
P
M
C
SW
SP
SM
SC
Silt M
LL < 50%
LL > 50%
L
H
ML
MH
Clay C
LL < 50%
LL > 50%
L
H
CL
CH
Organic O
LL < 50%
LL > 50%
L
H
OL
OH
Peat Pt Pt
Contd..
Coarse-grained soils: Fine-grained soils:
NO.200
0.075 mm
Well or Poor Graded
based on Cu and Cc
50 %
NO. 4
4.75 mm
50%
wL >50
wL <50
Gravel (G) Sand (S) Silt (M) Clay (C)
Based on wL and IP
(Plasticity Chart)
For G, use W if Cu > 4 and 1<Cc <3
For S, use W if Cu > 6 and 1<Cc <3
Plasticity Chart
Below A-line, use M (Silt) or
O (Organic)
Above A-line, use C - Clay
High Plasticity use H - wL >50
Low Plasticity use L - wL <50
Silt (M)
Clay (C)
Organic (O)
Plasticity Chart
“The soil’s liquid limit (wL) after oven drying is less than 75 % of its liquid limit
before oven drying.” If the above statement is true, then it is Organic Soil (OL or
OH). Otherwise, it is Inorganic Soil (ML or MH)
Plasticity Chart
When IP and wL are in the hatched portion of the plasticity chart, the soil is given
dual symbol (CL-ML).
Soil possessing properties of more than one group are termed as boundary soil
and designated by dual group symbol.
USCS at a glance
(Santamarina et al., 2001)
Group Symbols and Group Names
Group Symbol Typical Name
GW Well-graded gravels.
GP Poorly-graded gravels.
GM Silty gravels.
GC Clayey gravels
SW Well-graded sands.
SP Poorly-graded sands.
SM Silty sands.
SC Clayey sands.
Group Symbol Typical Name
CL Inorganic clays of low plasticity.
ML Inorganic silts with slight plasticity.
OL Organic soil of low plasticity.
CH Inorganic clays of high plasticity.
MH Inorganic silts with high plasticity.
OH Organic soil of high plasticity.
Pt Peat.
Group Symbols and Group Names
Example
Passing No.200 sieve 30%
Passing No.4 sieve 70 %
LL= 33
PI= 12
PI= 0.73(LL-20), A-line
PI=0.73(33-20)=9.49
Soil Type= SC
Clayey sand
(Santamarina et al., 2001)
Passing No.200 sieve 30 %
Passing No.4 sieve 70 %
LL= 33
PI= 12
Highly
Indian Standard Classification
System (ISCS)
IS:1498-1970
Introduction
Based on USCS system
Modifications are:
Fine grained soils subdivided into 3 groups (low, intermediate and high
plasticity) as against two groups(low and high) in USCS.
wL <35=L, 35<wL <5o=I, wL >50=H
Thus, soil classified into 18 groups as against 15 in USCS.
Classification Group Symbols
Main Soil Type Prefix Subgroup Suffix
Classification Group
symbols
Gravel G
Well-graded
Poorly-graded
Silty
Clayey
W
P
M
C
GW
GP
GM
GC
Sand S
Well-graded
Poorly-graded
Silty
Clayey
W
P
M
C
SW
SP
SM
SC
Silt M
LL < 35%
35<LL<>50
LL > 50%
L
I
H
ML
MI
MH
Clay C
LL < 35%
35<LL<>50
LL > 50%
L
I
H
CL
CI
CH
Organic O
LL < 35%
35<LL<>50
LL > 50%
L
I
H
OL
OI
OH
Peat Pt Pt
Plasticity Chart
High Plasticity use H - wL >50
Intermediate Plasticity use I – 35< wL >50
Low Plasticity use L - wL <35
Below A-line, use M (Silt) or
O (Organic)
Above A-line, use C - Clay
Thank You

9 soil classification

  • 1.
    Geotechnical Engineering (RCE-501) 3RD YEAR(5th Semester) CIVIL ENGINEERING DEPARTMENT I. T. S ENGINEERING COLLEGE, GR. NOIDA By Aungkar Bhagat
  • 2.
    Soil Classification Systems 1.Particle Size Classification 2. Textural Classification 3. Highway Research Board (HRB) Classification 4. Unified Soil Classification System (USCS) 5. Indian Standard Classification System (ISCS)
  • 3.
  • 4.
    Soils arranged accordingto grain sizes. Terms such as gravel, sand, silt and clay are used to indicate grain sizes. These terms are used only as designation of particle sizes. They do not signify naturally occurring soil types. Naturally occurring soil are mixture of particles of different sizes. Introduction
  • 5.
  • 6.
  • 7.
    Soil classification ofcomposite soils exclusively based on Particle Size Distribution. Most popular is the Triangular Classification of U.S. Public Roads Administration. Classification based on % of sand, silt and clay size. More suitable for describing coarse grained soil. Clay soil properties are less dependent on particle size distribution. Introduction
  • 8.
  • 9.
    Example 30% sand 30% silt 40%clay Soil Type Clay
  • 10.
    Highway Research Board(HRB) Classification
  • 11.
    Based on bothparticle-size composition as well as plasticity characteristics. Mostly used for pavement construction. 7 primary groups (A-1, A-2,…., A-7). A-1 subdivided into 2 subgroups. A-2 subdivided into 4 subgroups. Introduction
  • 12.
    Used to describeperformance of soil when used for pavement construction. Not used to place a soil in a particular group. It means rating the value of soil as a subgrade material within its own group. Higher the value of GI, poorer is the quality of material. Group Index (GI)
  • 13.
    Group Index ofa soil depends on: 1. Amount of material passing 75 micron IS sieve. 2. Liquid Limit. 3. Plastic Limit. Group Index (GI) determination
  • 14.
    HRB Classification Table ForA-7-5, IP<= wL-30 For A-7-6, IP > wL-30
  • 15.
    HRB Classification Procedure Proceedfrom left to right on the chart. Correct group will be found by process of elimination. The first group from left into which the test data will fit will be the correct classification. Group Index should be rounded off to nearest integer and placed in parenthesis, such as, A-2-2 (6).
  • 16.
    Example 56% passes 75micron sieve.  Plastic Limit (wP) =23% Liquid Limit (wL)=36% Plasticity Index (IP) = 36-23=13%
  • 17.
    Example Passing 75 micron>35%IP < 40% wL>10% A-6 wL=36% IP =13%
  • 18.
    Example Group Index Calculation a=56-35=21 b=56-15=41, Take 40 56% passes 75 micron sieve.  Plastic Limit (wP) =23% Liquid Limit (wL)=36% Plasticity Index (IP) =13% c=0 d=13-10=3 GI=5.4=5 A-6 (5)
  • 19.
  • 20.
    Origin of USCS First developed by Professor A. Casagrande (1948) for the purpose of airfield construction during World War II.  Afterwards, it was modified to enable the system to be applicable to dams, foundations, and other construction .
  • 21.
  • 22.
    Classification Groups •The soilis classified into 15 groups. •Each group is designated a symbol consisting of two capital letters. •The first letter is based on main soil type. •The second letter is based on gradation and plasticity .
  • 23.
    Classification Group Symbols MainSoil Type Prefix Subgroup Suffix Classification Group symbols Gravel G Well-graded Poorly-graded Silty Clayey W P M C GW GP GM GC Sand S Well-graded Poorly-graded Silty Clayey W P M C SW SP SM SC Silt M LL < 50% LL > 50% L H ML MH Clay C LL < 50% LL > 50% L H CL CH Organic O LL < 50% LL > 50% L H OL OH Peat Pt Pt
  • 24.
    Contd.. Coarse-grained soils: Fine-grainedsoils: NO.200 0.075 mm Well or Poor Graded based on Cu and Cc 50 % NO. 4 4.75 mm 50% wL >50 wL <50 Gravel (G) Sand (S) Silt (M) Clay (C) Based on wL and IP (Plasticity Chart) For G, use W if Cu > 4 and 1<Cc <3 For S, use W if Cu > 6 and 1<Cc <3
  • 25.
    Plasticity Chart Below A-line,use M (Silt) or O (Organic) Above A-line, use C - Clay High Plasticity use H - wL >50 Low Plasticity use L - wL <50 Silt (M) Clay (C) Organic (O)
  • 26.
    Plasticity Chart “The soil’sliquid limit (wL) after oven drying is less than 75 % of its liquid limit before oven drying.” If the above statement is true, then it is Organic Soil (OL or OH). Otherwise, it is Inorganic Soil (ML or MH)
  • 27.
    Plasticity Chart When IPand wL are in the hatched portion of the plasticity chart, the soil is given dual symbol (CL-ML). Soil possessing properties of more than one group are termed as boundary soil and designated by dual group symbol.
  • 28.
    USCS at aglance (Santamarina et al., 2001)
  • 29.
    Group Symbols andGroup Names Group Symbol Typical Name GW Well-graded gravels. GP Poorly-graded gravels. GM Silty gravels. GC Clayey gravels SW Well-graded sands. SP Poorly-graded sands. SM Silty sands. SC Clayey sands.
  • 30.
    Group Symbol TypicalName CL Inorganic clays of low plasticity. ML Inorganic silts with slight plasticity. OL Organic soil of low plasticity. CH Inorganic clays of high plasticity. MH Inorganic silts with high plasticity. OH Organic soil of high plasticity. Pt Peat. Group Symbols and Group Names
  • 31.
    Example Passing No.200 sieve30% Passing No.4 sieve 70 % LL= 33 PI= 12 PI= 0.73(LL-20), A-line PI=0.73(33-20)=9.49 Soil Type= SC Clayey sand (Santamarina et al., 2001) Passing No.200 sieve 30 % Passing No.4 sieve 70 % LL= 33 PI= 12 Highly
  • 32.
  • 33.
    Introduction Based on USCSsystem Modifications are: Fine grained soils subdivided into 3 groups (low, intermediate and high plasticity) as against two groups(low and high) in USCS. wL <35=L, 35<wL <5o=I, wL >50=H Thus, soil classified into 18 groups as against 15 in USCS.
  • 34.
    Classification Group Symbols MainSoil Type Prefix Subgroup Suffix Classification Group symbols Gravel G Well-graded Poorly-graded Silty Clayey W P M C GW GP GM GC Sand S Well-graded Poorly-graded Silty Clayey W P M C SW SP SM SC Silt M LL < 35% 35<LL<>50 LL > 50% L I H ML MI MH Clay C LL < 35% 35<LL<>50 LL > 50% L I H CL CI CH Organic O LL < 35% 35<LL<>50 LL > 50% L I H OL OI OH Peat Pt Pt
  • 35.
    Plasticity Chart High Plasticityuse H - wL >50 Intermediate Plasticity use I – 35< wL >50 Low Plasticity use L - wL <35 Below A-line, use M (Silt) or O (Organic) Above A-line, use C - Clay
  • 36.