Download to read offline
![Don’t have 20 years to Wait
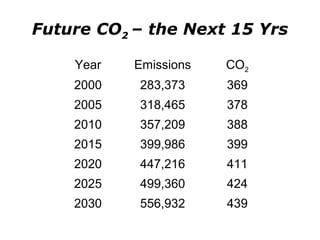
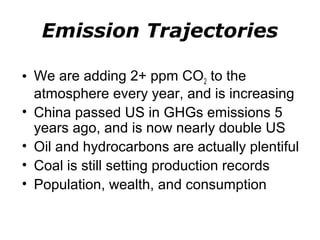
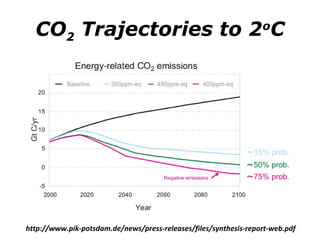
• Trajectory to 450 ppm CO2 (2032-2035)
– 450 ppm CO2 => 2 deg C committed/forcing
– Amplifying feedbacks take us to 3+ deg C
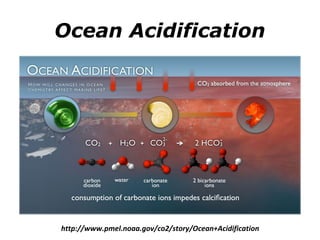
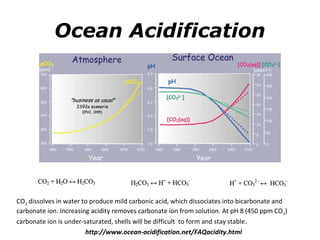
• Ocean acidity 450 ppm CO2 => pH 8
– concentration [CO2] = [HCO3]
• Decisions made today impact 2035
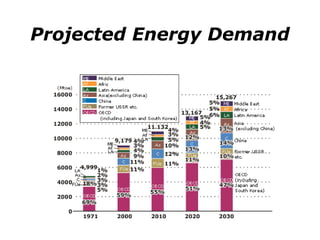
– Still investing in carbon intensive energy
– At 2+ ppm/year, for 20+ years, 450 ppm CO2](https://image.slidesharecdn.com/understandingearthsgreenhouse-141211124800-conversion-gate01/85/Understanding-earth-s-greenhouse-26-320.jpg)


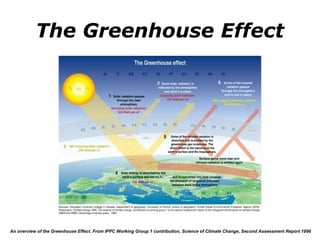
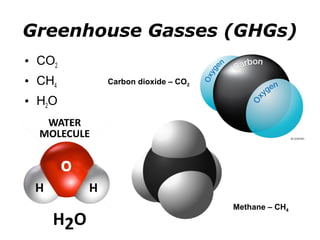
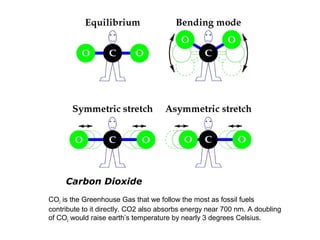
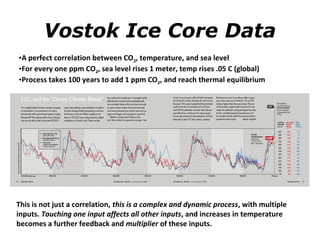
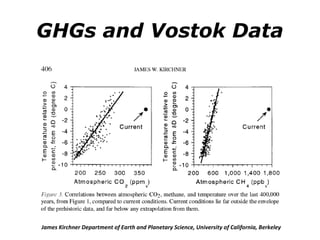
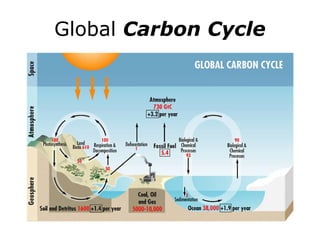
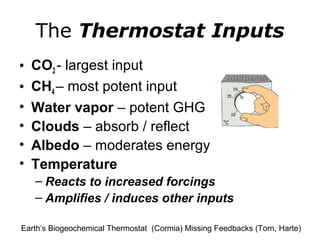
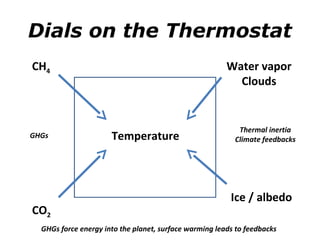
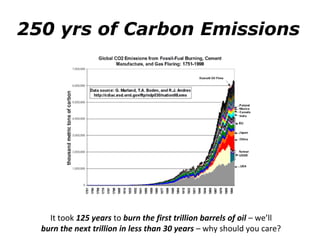
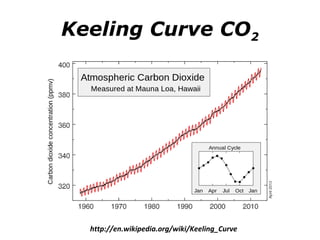
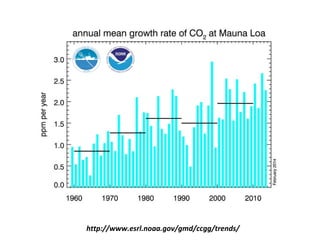
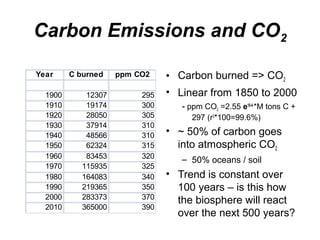
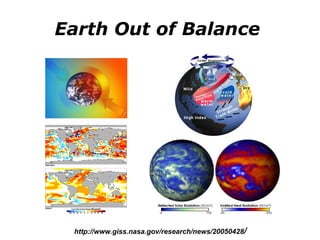
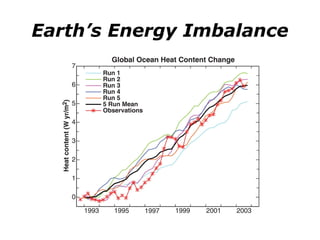
The document discusses the greenhouse effect and how it leads to warming of the Earth. It explains that greenhouse gases like carbon dioxide and methane trap heat in the atmosphere and have increased due to human emissions. Data from ice cores shows a clear correlation between CO2 levels, temperature, and sea level rise over hundreds of thousands of years. While CO2 levels have increased about 40% since the industrial revolution, emissions continue to rise rapidly and could lead to over 2 degrees Celsius of warming with serious consequences if left unchecked.


